This article deals with ‘Stock Exchanges.’ This is part of our series on ‘Economics’ which is an important pillar of the GS-3 syllabus. For more articles, you can click here.
Introduction
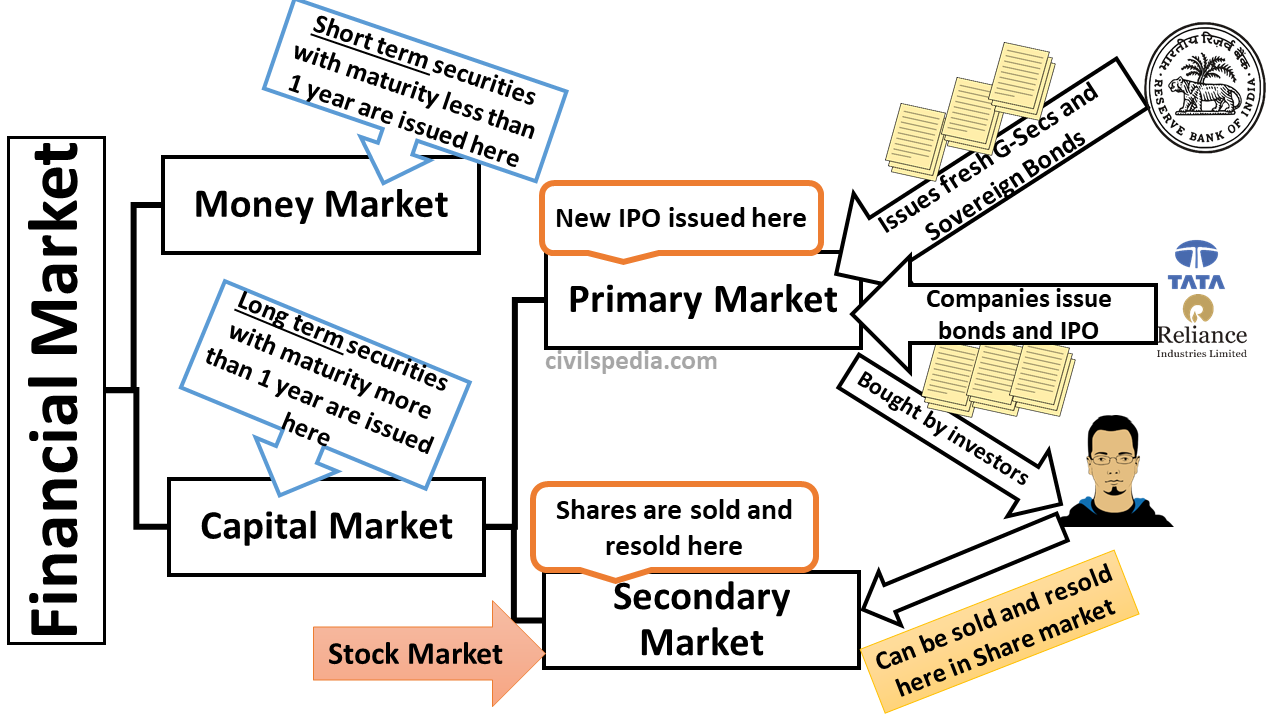
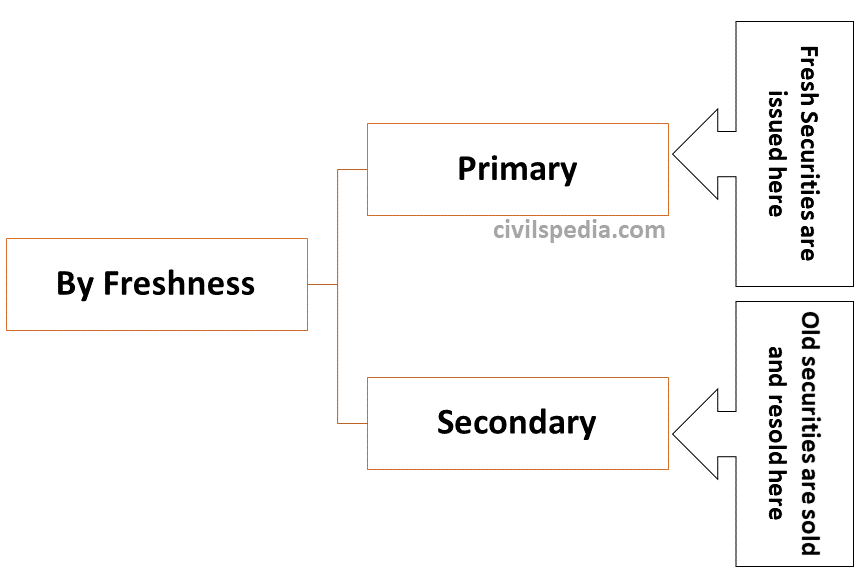
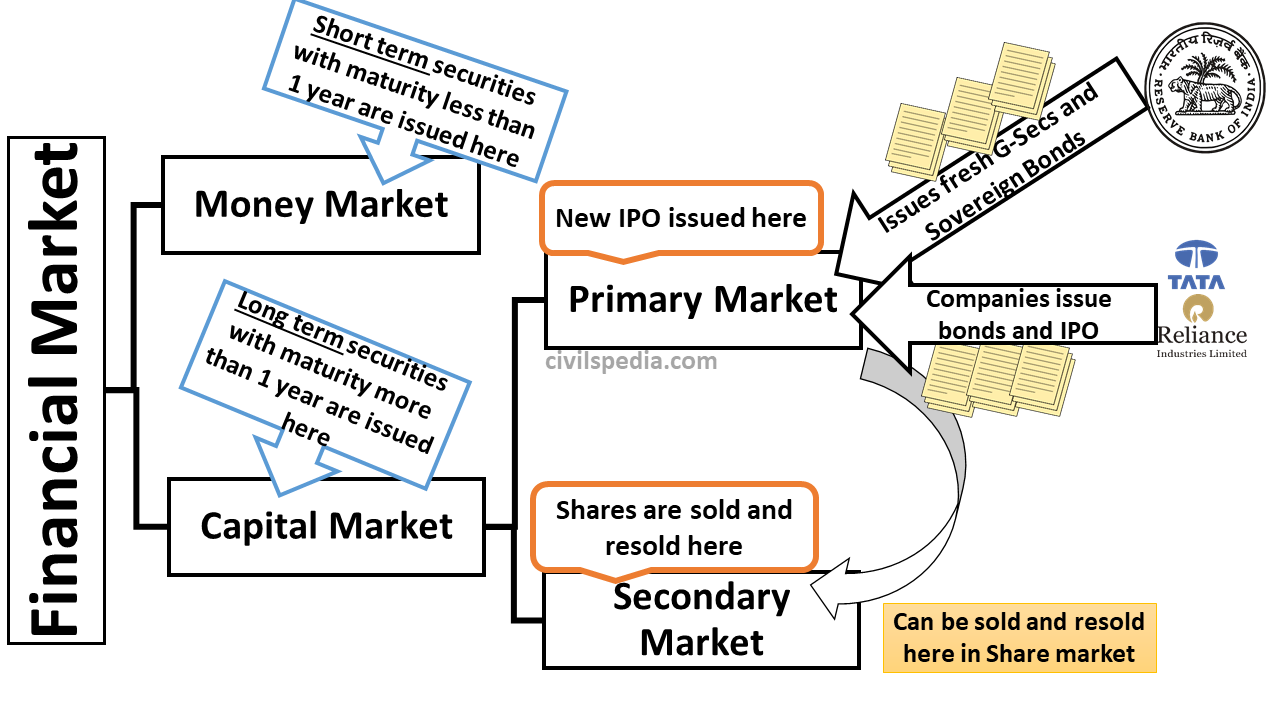
Shares are issued through IPO in the Primary market. Then, they can be resold at the secondary market, commonly known as the Share market or Stock Exchange.
Facts about Stock Exchanges
Worlds first stock market was opened in Amsterdam Stock Exchange in 1631, followed by London Stock Exchange in 1773.
Bombay Stock Exchange was the first to be opened in India (and Asia) in 1875, followed by Ahmedabad and Kolkata.
States have their own Stock Exchanges as well. E.g., Punjab’s Stock Exchange is in Ludhiana.
The world’s five largest stock exchanges are (1) New York Stock Exchange, (2) NASDAQ, (3) Tokyo Stock Exchange, (4) London Stock Exchange and (5) the Bombay Stock Exchange.
In 2018, the Bombay Stock Exchange(BSE) became the first Indian exchange to be designated as a ‘Designated Offshore Securities Market’ (DOSM) by the US Securities and Exchange Commission (SEC). DOSM status allows the sale of securities to US investors through the trading venue of BSE without registration of such securities with the US SEC, which eases the trades by US investors in India. Other Stock Exchanges with DOSM Status are London Stock Exchange, Bourse de Luxembourg, Tokyo Stock Exchange and Toronto Stock Exchange.
Players in Stock Exchanges
1. Broker
A broker is a registered stock exchange member who buys or sells shares/securities on his client’s behalf and charges a commission.
2 . Jobber
A jobber is a broker’s broker or one who specialises in specific securities catering to the need of other brokers.
3 . Market-Maker
Market Maker is an intermediary in the market ready to buy and sell securities and quotes two-way rates.
Stock Exchanges in India
There are 27 Stock Exchanges in India – 7 at the national level and 20 at the regional level.
Bombay Stock Exchange (BSE)
Earlier, BSE was a regional stock exchange and converted to a national exchange in 2002.
It is the biggest stock exchange in India, accounting for 75% of total stocks traded in India and the fifth largest in the world based on market capitalisation.
BSE’s flagship index is Sensex.
Side Topic: Specific problems of share market before 1992
1. Monopoly of Bombay Stock Exchange (BSE)
There were almost 20 regional stock markets in 1992, but BSE enjoyed a monopoly.
Users from outside Bombay found it extremely difficult to trade in BSE due to poor technology & the high cost of telecommunication.
BSE imposed a high entry barrier, so competition among brokers was absent. Services provided by brokers were highly inefficient & costly.
2. Open outcry system
Trading used to take place in the trading ring where non-brokers were not allowed in & these traders used to shout prices.
There wasn’t any mechanism to verify the prices at which trading actually took place.
3. Badla System
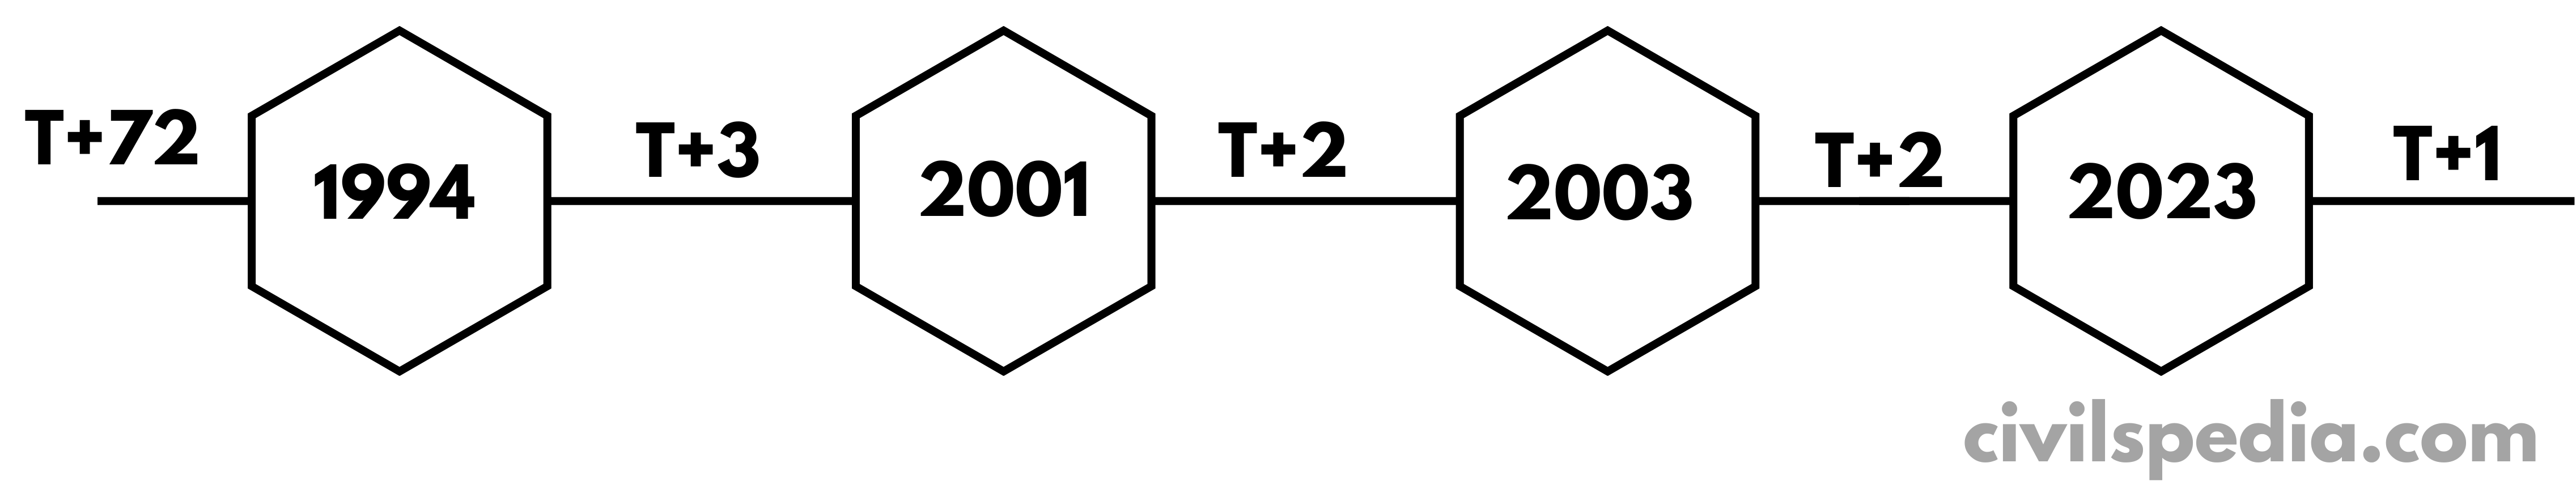
Under Badla System, settlement of share used to happen on T+72 days basis. It means that if the investor has bought shares today, he got real possession of shares after 72 days.
Presently, T+2 System is in place, i.e. settlement has to happen in 2 days. In Jan 2023, T+1 settlement cycle was started trades in top listed securities.
The Lower Settlement period has many benefits to the system
It reduced the capital to collateralise the risk of unsettled deals.
It helped in reducing the systemic risks.
4. Bad Delivery of Shares
Once you buy a share, you have to send these shares to the registrar of the company to register ownership of the share in your name.
But the problem of bad delivery of share can happen. For example, if the signature of the seller didn’t match with one maintained with the registrar, the share would be sent back.
To tackle all these problems
The government made law to give power to SEBI to control primary & secondary markets.
And to end the monopoly of BSE, a new national-level stock exchange NSE was opened.
BADLA System (T+72) system was changed to T+2, i.e. settlement has to be completed in 2 days.
NSE (National Stock Exchange)
NSE is located in Mumbai. It was established in 1992 & started trading in 1993.
Promoted & managed by public sector financial institutions – IDBI, UTI, LIC, GIC, SBI& IDFC & foreign investors like Citigroup.
It is professionally managed (as opposed to brokers).
NSE’s flagship index is S&P’s CRISIL NIFTY-50.
From 2022, Indian investors will be able to trade in the stocks of 50 leading US companies through the NSE International Exchange, a subsidiary of NSE
4 Innovations of NSE which changed all stock exchanges in India
1. Computerized Trading
Trading was done in front of investors leading to Transparency.
2. Satellite Communication
To spread the reach of exchange to all over the country.
3. Professional Managers
Traditional stock exchanges were managed by Brokers leading to a rise in malpractices. Since Brokers themselves were in-charge of enforcement, they never took decisions against themselves.
In NSE, enforcement was entrusted to professional managers.
4. Weekly settlements
T+72 system was replaced with weekly settlements.
Result – NSE busted BSE
Equity trading at NSE commenced in 1993.
Within one year, NSE surpassed BSE in terms of turnover.
Good things happened due to NSE
Cartelisation of brokers ended
Led to higher Transparency
More brokers lead to competition & less commission
No more bad delivery of shares (due to Demat account)
Investors from outside Mumbai were also able to invest.
Later, BSE also introduced similar changes to remain in the market.
Regional Exchanges
There is a total of
20 regional stock exchanges in India.
Ludhiana(established in 1983)
Jaipur
Ahmedabad (1894 – first Regional Exchange)
Indore
Pune
New
Delhi
Meerut
Rajkot
Vadodara
Hyderabad
Mangalore
Bangalore
Ernakulam
Coimbatore
Madras
Patna
Kanpur
Bhubaneshwar
Kolkata
Guwahati
SENSEX
Sensex = Sensitive Index (Full Name – S&P BSE SENSEX)
It is a popular Equity Index of the Bombay Stock Exchange (BSE).
It was started in 1986.
Concept of Free Float Market Capitalisation
To understand how SENSEX is calculated, we must know Free Float Market Capitalisation.
Free Float Market Capitalisation = Total Price of all the shares in the market on that day (excluding with company)
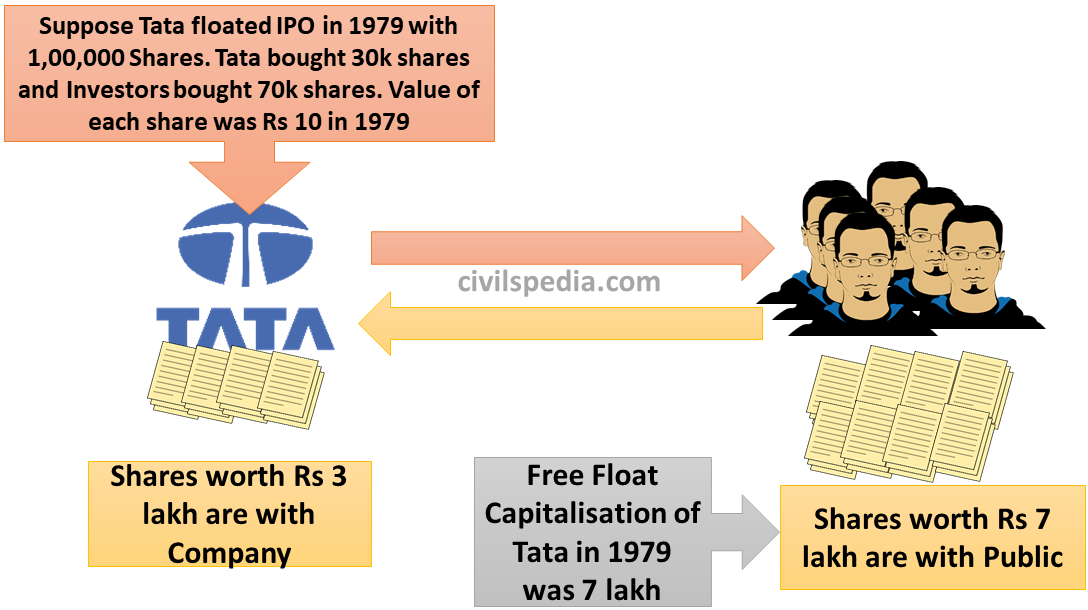
Suppose in 1979; Company launched IPO with 1 lakh shares. 30,000 shares were bought by the Promoter (owner), and the public bought 70,000 shares. Assume Price of each share in 1979 was ₹10. Hence, the Free Float Market Capitalisation of the Company in 1979 was ₹ 7 lakh (10 X 70,000).
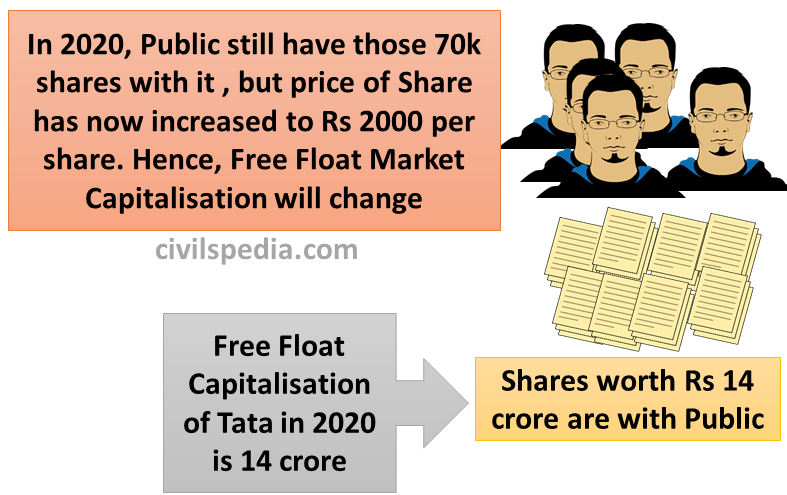
Later, if the Price of Shares increases, Free Float Market Capitalisation will change as well (as explained in the infographic below)
How SENSEX is calculated??
Base Year – 1978-79
Measured using the weighted average of the 30 largest companies traded in BSE & these companies keep on changing based on market capitalization.
The Board of SEBI comprises nine members, excluding the chairman.
Functions
Regulator of Securities (Shares, Bonds, Debentures etc.).
Regulatory oversight over places (Stock Exchanges, Depositories etc.) and Persons (Brokers, MF Managers, Inside Trader)
Regulates any Collective Investment Scheme of or more than ₹100 crores.
Promote financial literacy of investors.
Journey till now
1988
SEBI was formed via Executive Order.
1992
SEBI became a Statutory Body.
2014
SEBI Act amended to give powers to search, seize, and arrest to SEBI and all Collective Investment Schemes of more than ₹ 100 crores was placed under the regulation of SEBI.
2015
Forward Market Commission scrapped and Commodity markets were placed under the regulation of SEBI.
Commodity Exchanges
Commodity trading happens similar to ‘stock trading’ in the stock market. But in contrast to stocks, commodities are actual physical goods such as wheat, oil, gold etc.
Futures are contracts for commodities that are traded on exchanges. Commodity futures serve a great purpose by hedging participants against price fluctuations. Take the example of agriculture.
A corn farmer can sell ‘corn futures’ on a commodity exchange. It will lock the sale price of a specified quantity of wheat at a future date, protecting the farmer from price fluctuations.
Corn mill can purchase the corn futures from the exchange and fix its future purchase cost for a specified quantity of corn.
There are 21 commodity exchanges in India, including three ‘national level’ exchanges, i.e. Multi-commodity Exchange of India Ltd. (MCX), Mumbai; National Commodity and Derivatives Exchange Ltd. (NCDEX), Mumbai and National Multi-commodity Exchange of India Ltd. (NMCE), Ahmedabad.
SEBI regulates Commodity Exchanges. Earlier, Forward Market Commission (FMC) was the regulator of Commodity Exchanges, but the Government of India merged the FMC with the SEBI in September 2015.
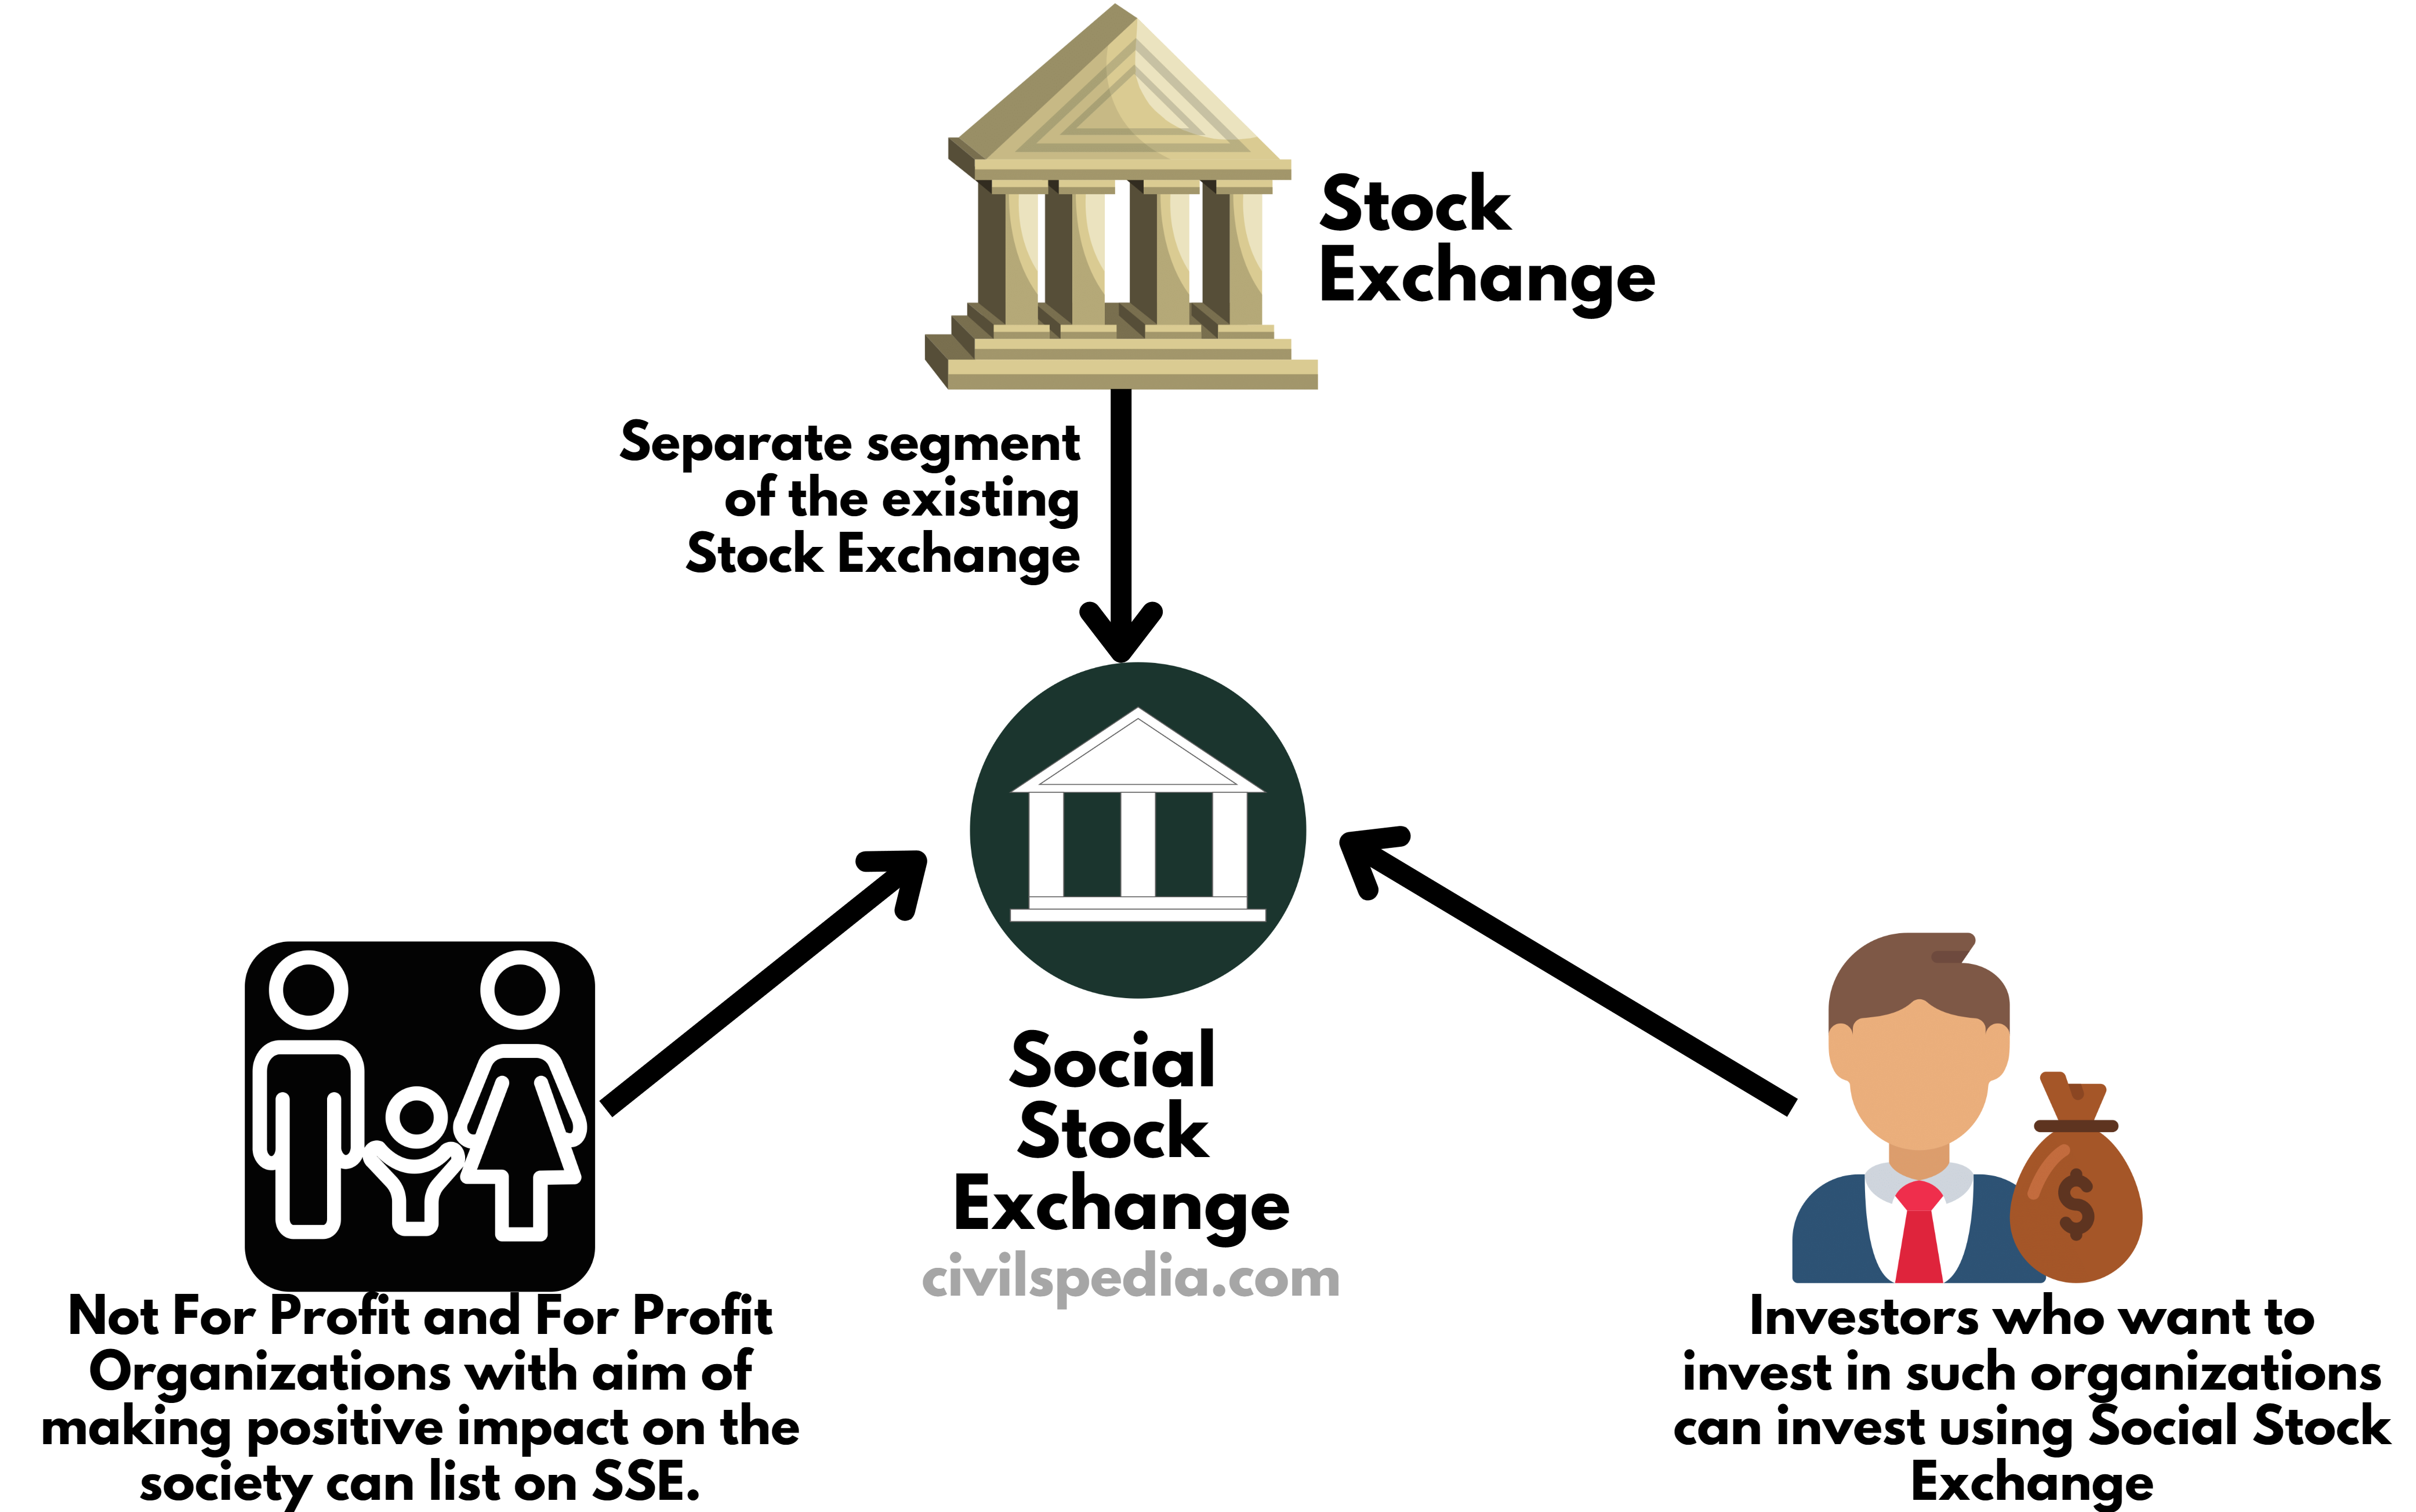
Social Stock Exchange
Social Stock Exchange is a separate segment of the existing Stock Exchange that helps Social Enterprise(s) raise funds from the public through the stock exchange mechanism.
In 2023, National Stock Exchange (NSE) got the approval from the SEBI to launch its Social Stock Exchange.
Not For Profit Organizations and For Profit Organizations with aim of making positive impact on the society are eligible to be listed on SSE.
This article deals with ‘Type of Securities.’ This is part of our series on ‘Economics’ which is an important pillar of the GS-3 syllabus. For more articles, you can click here.
What is Security instrument?
Securities are
fungible and tradable financial instruments that are used to raise capital from
public and private markets.
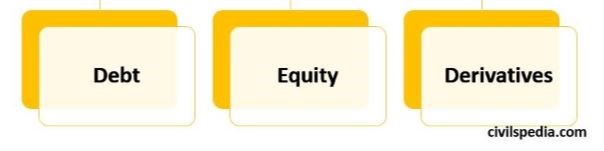
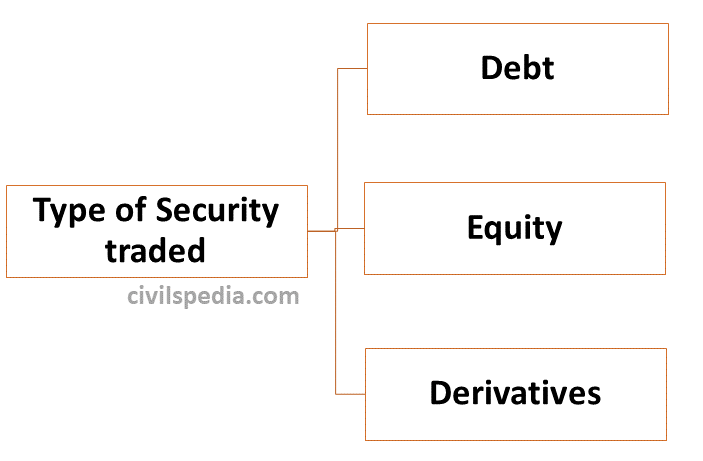
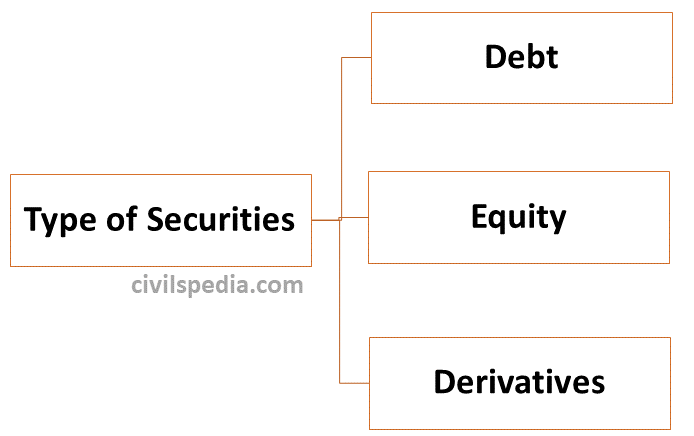
There are three types
of Securities, i.e. (1) Debt, (2) Equity and (3) Derivatives.
Security Market
It is the segment of the financial market of an economy where long term capital is raised via security instruments such as Debt, Equity and Derivatives.
There are different ways to classify Security Markets.
Classification 1: Type of Security being Traded
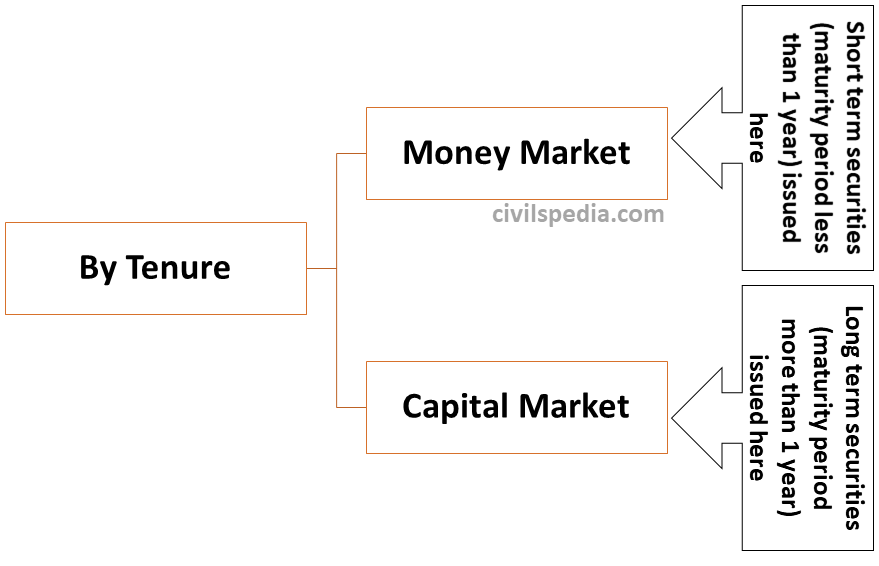
Classification 2: By Tenure of Securities
Classification 3: By Freshness of Security
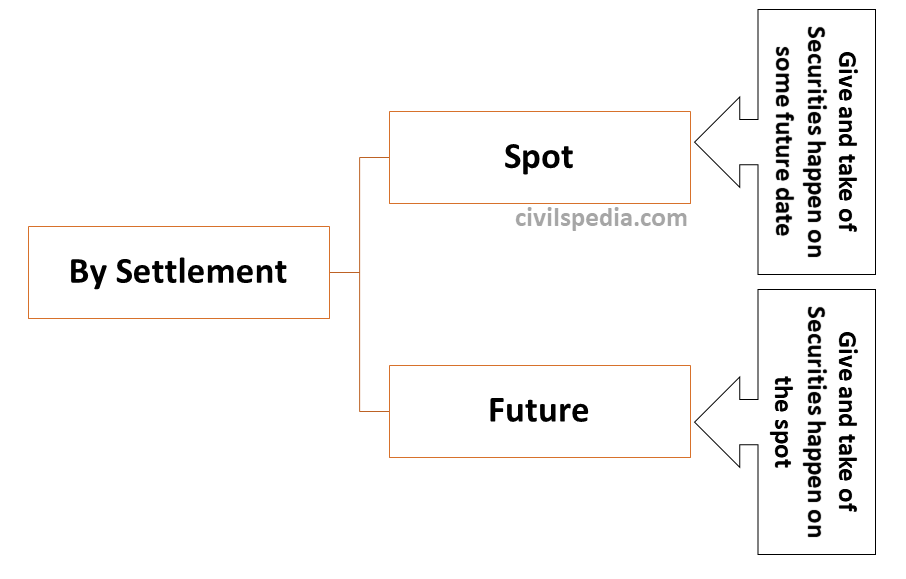
Classification 4: By Settlement of Security
Different Instruments to raise Money from the Market
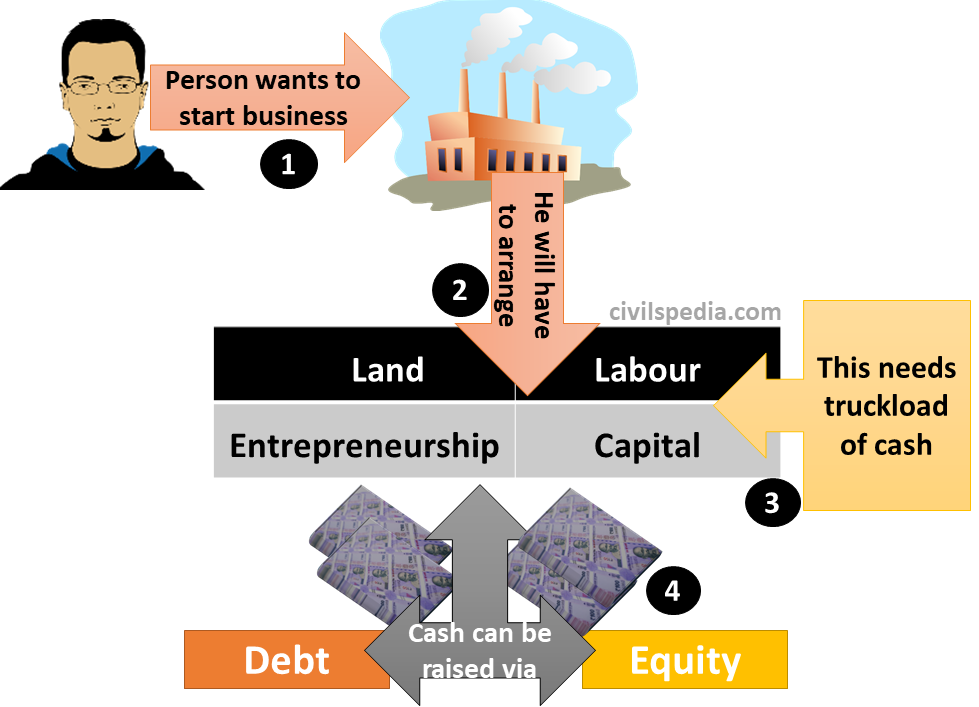
Consider a hypothetical situation – A businessman has ₹5 Lakh & to start a business, he needs ₹10 Lakh. Now the question arises that, how can he arrange the rest 5 Lakhs? Answer – He can approach Security Market to raise capital via Debt or Equity.
In general, if anybody wants
to start a business, he/she will need 4 factors of production
Entrepreneurship
Land
Capital
Labour
And to arrange these factors of production, one needs a truckload of money which can be raised via Debt or Equity. These instruments have their advantages and disadvantages, which we will discuss in detail in the chapter.
Debt Instruments
It is self-explanatory, i.e., you borrow money from someone & say that I will give you 10% annual interest for 5 years & at the end will pay you principle (minimum period more than 1 year).
It is a type of security paper.
If a company raises money via debt, it will have to pay the debt owner whether it is in profit or loss.
Examples of debt include Bonds, Debentures, External Commercial Borrowing, T-Bills, Commercial Papers, Certificate of deposit etc.
The holder of the debt instrument is called the Creditor of the Company (not the owner).
Benefits of becoming Creditor
Fixed Income whether the company is making profit or loss.
First claim during liquidity.
Short and Long-Term Debt Instruments
#1: Short-Term Debt Instruments
They have a maturity period of less than 1 year.
The market where they are sold is called Money Market.
They are highly liquid as they can be sold and resold very easily.
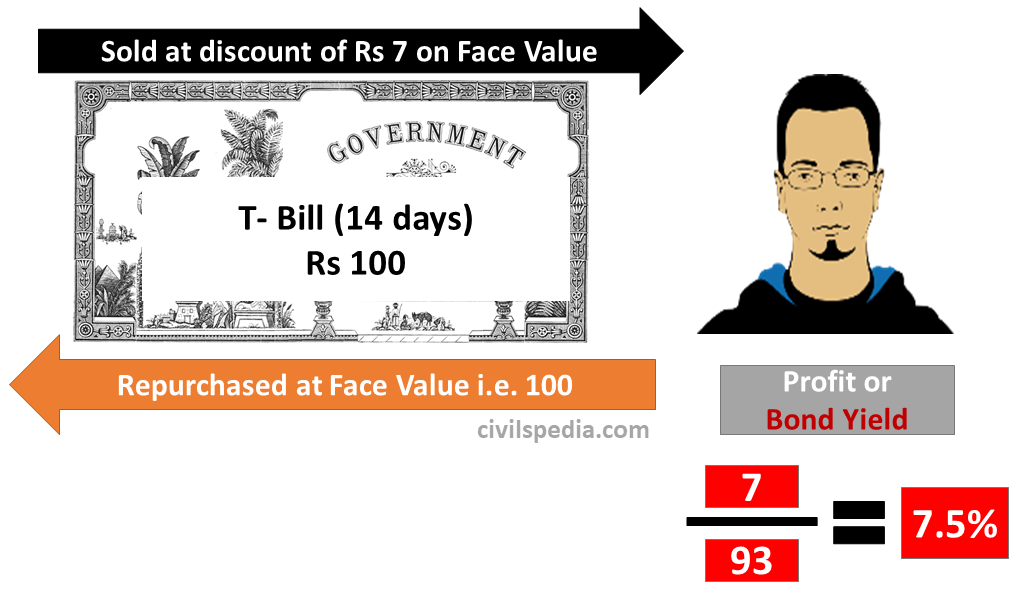
These are sold at a discount to face value and bought at face value after a fixed number of days (all Short Term Debt instruments that are mentioned below are sold and purchased in this way)
E.g., T-Bill issued by the government for a period of up to 14 days.
Short Term Debt Instruments issued by various agencies
1 . Government
1.1 T-Bills or Treasury Bills
T-Bills have a maturity period of 14, 91, 182 or 364 days.
Treasury bills are zero-coupon securities as they don’t pay interest. They are issued on a discount to face value and redeemed at face value upon maturity.
Note: State Governments don’t issue T-Bills (till 2001, they used to issue, but RBI stopped this in 2001).
1.2 Cash Management Bills (CMB)
They can have a maturity period of up to 90 days.
1.3 Ways & Means Advances
The mechanism through which RBI lends money to the government for temporary short term needs when there is a mismatch in receipt and expenditure of the government.
2 . Companies
Commercial Papers
Promissory Notes
Both work the same as T-Bills but are issued by Companies.
3 . Banks
Certificate of Deposits: Work same as T-Bills.
Call Money: Banks inter-borrow among themselves for 1 day for CRR Adjustment.
Notice Money: Same as Call Money but for a period between 2 to 14 days.
Repo Agreements: Monetary Policy instrument under which bank lends from RBI for up to 14 days.
4 . Merchant
Commercial Bill: Merchant sells his unpaid invoice to bank at a discount and again buys the same invoice at face value when recovery date of invoice arrives.
5 . MSMEs
Factoring: Under Factoring, MSME owner pledges his unpaid invoice made to Corporates to Bank or NBFC at a discount and then again buys invoice at face value when recovery date of invoice arrives. It is conducted through electronic system called Trade Receivables Electronic Discounting System (Treds).
Side Topic: Credit Rating
Before reading about Long Term Debt Instruments, we need to know Credit Rating and Bond Yield.
Credit Rating is the process to access the creditworthiness of a prospective borrower to meet future debt obligations.
Credit Rating can be given to individuals, individual companies & countries (sovereign).
SEBI regulations mandate that the company’s credit rating is required to raise money via a debt instrument having a maturity period greater than 18 months.
Usually, equity share is not rated here.
The interest rate paid on Bonds is not fixed & depend on the credit rating of the entity issuing that:-
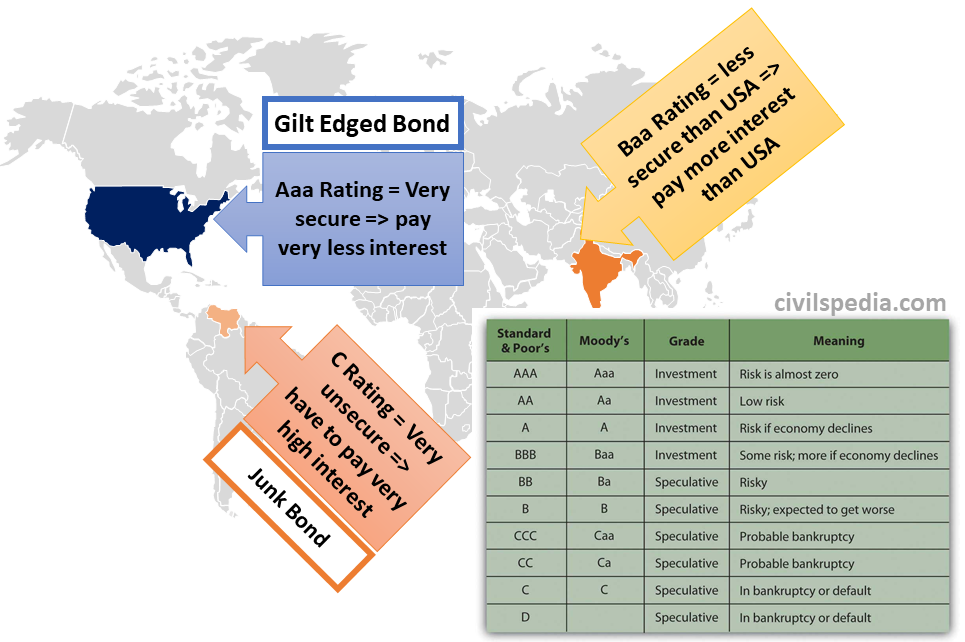
Companies and countries with high credit ratings are least to default on their loans. Hence, the interest rate on bonds issued by them is the lowest (Gilt Edged).
Companies and countries with low credit ratings are most likely to default on their loans. Hence, to attract buyers, they have to offer a high-interest rate.
Companies that do the work of Credit Rating are known as Credit Rating Companies. These include Fitch, CRISIL, S&P, Moody’s etc. and they give rating like AAA,A,BBB,BB,C,D etc.
In India, Credit rating agencies are regulated by SEBI under SEBI (Credit Rating Agencies) Regulations, 1999 of the Securities and Exchange Board of India Act, 1992. Presently, we have seven domestic rating agencies
Acuite Rating and Research
Brickwork Ratings
CARE Ratings
CRISIL Ratings
ICRA
India Ratings and Research
Infomercial Valuation and Rating
Credit Rating of Individual Persons are maintained by Credit Information Companies (CIC) such as Equifax, CIBIL TransUnion etc.
Side Note: Gilt Edged vs Junk Bond
1. Junk Bond
Junk Bonds are also known as High Yield Bond.
If a company has a low rating like C& D issue bonds, nobody will invest in them because they are insecure.
They offer a high-interest rate like 15-17% to seduce investors.
2. Gilt Edged Bond
Gilt Edged Bonds are issued by companies and countries with high credit ratings.
These bonds are highly secure.
They offer very low interest, like 1 to 4%
Side Topic: Bond Yield
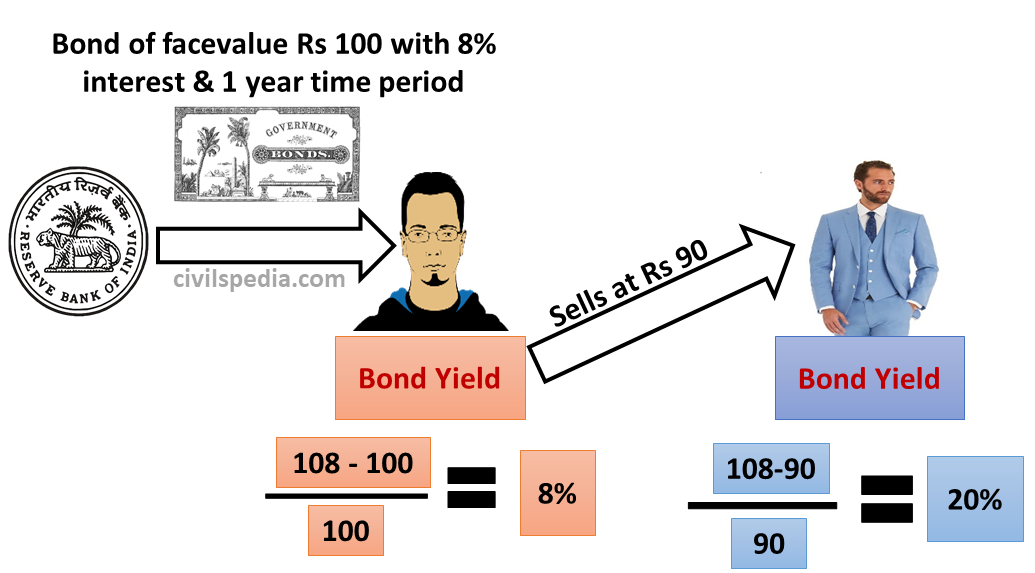
Bond Yields, in essence, shows the financial return the owner of the bond is going to get from the bond at any given time. The simplest version of yield is calculated in the following manner:
If the bond price remains constant (i.e., equal to the face value), then the yield of the bond is the same as the interest rate. But the Bond prices seldom remain constant and are subject to change.
Bond
Yield is the profit percentage that an investor is earning from the given bond.
It is calculated by dividing interest
earned by the investor with the Par Value of Bond for that
investor.
Bond Yield increases in two cases
During Boom Period: In this period, the investor is interested in investing his money in companies likely to grow faster and sell his existing bonds even at a lesser value to invest his money in growing companies.
When the country’s economy is about to collapse, investors try to sell it at lower rates before sovereign default and get whatever they can. The implication is that when the government issues new shares, the government has to offer very high interest (greater than the Bond Yield of earlier floating bonds) to attract investors toward new bonds.
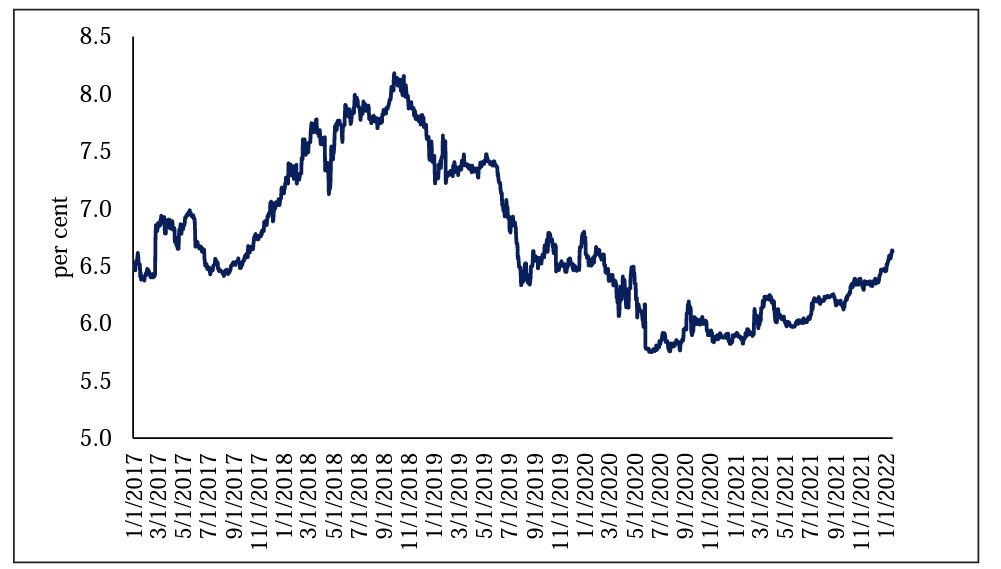
Bond Yield on G-Secs
The yields on 10-year G-sec,
which had reached 8.2 per cent on 26th September 2018, reduced
substantially to reach 5.75 per cent in June 2020. It has since then
increased to stand at 6.45 per cent as of 31st December 2021.
#2: Long Term Debt Instruments
Long Term Debt Instruments have a period of maturity greater than 1 year.
They are sold in called Capital Market.
Types
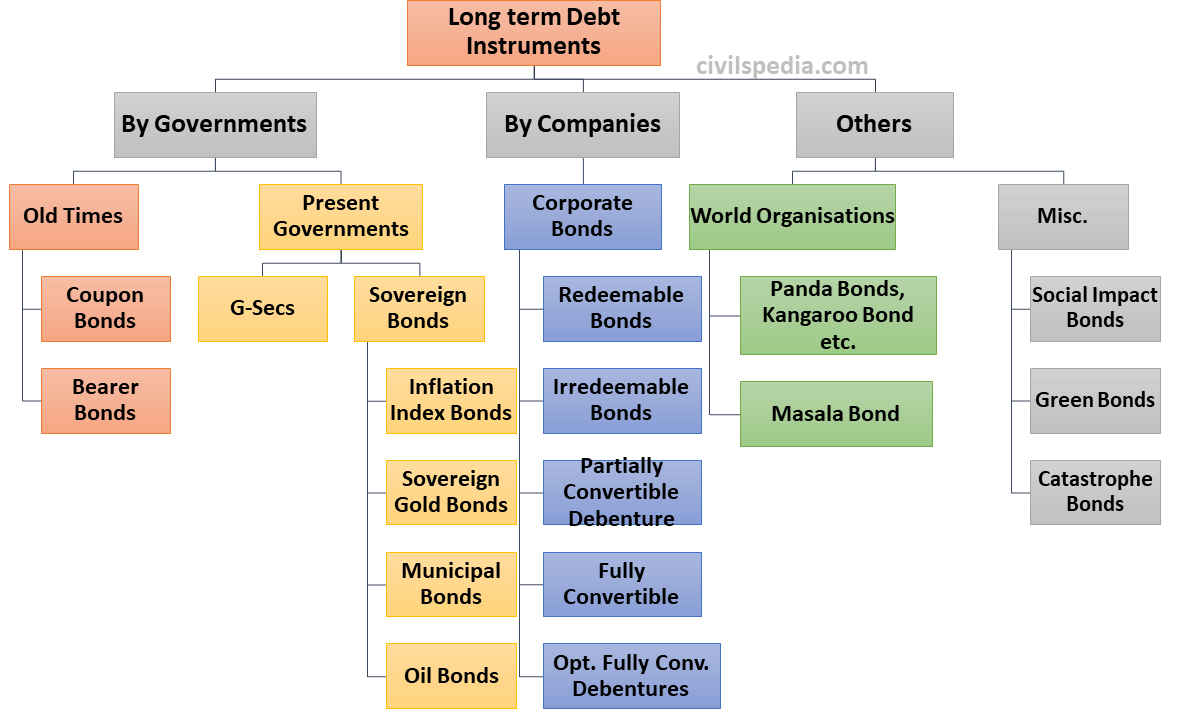
2.1 Long-Term Debt Instruments issued by Governments
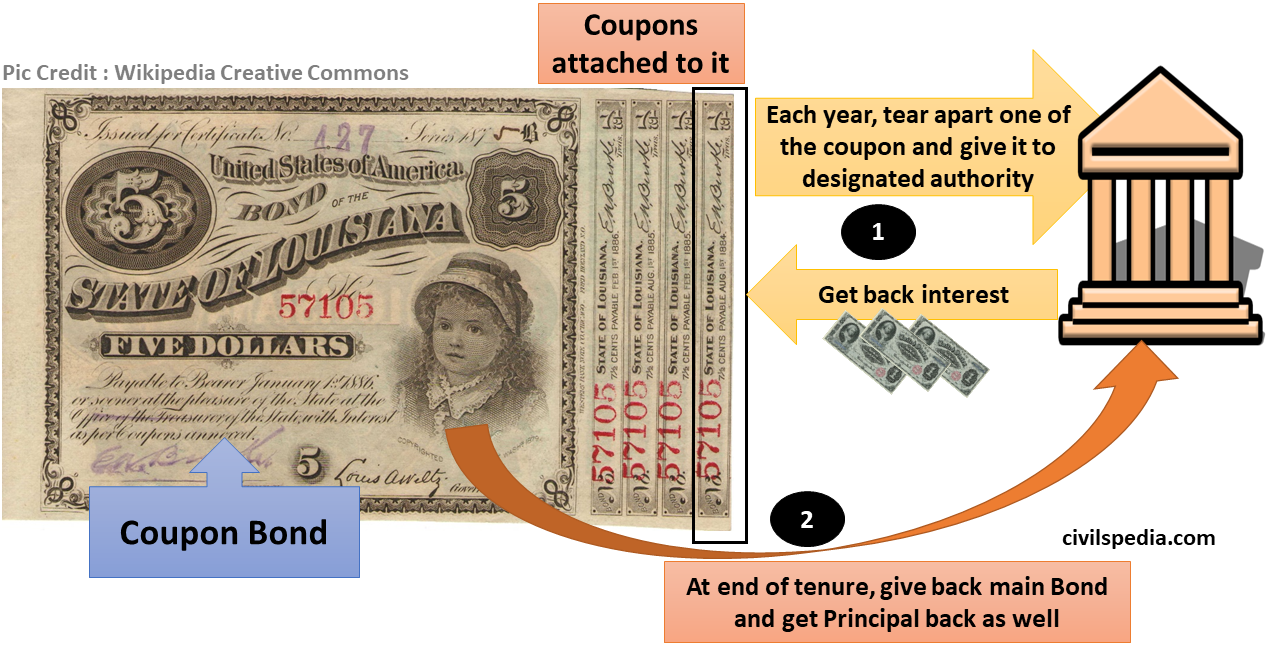
2.1.1 Coupon Bonds
Coupons bonds are bonds issued by the government with Coupons attached to them. The person who has bought the Coupon Bond can get interest each year by tearing the coupon from the bond and giving it to the designated authority. The person will get his initial amount back by giving back Coupon Bond at the maturity period.
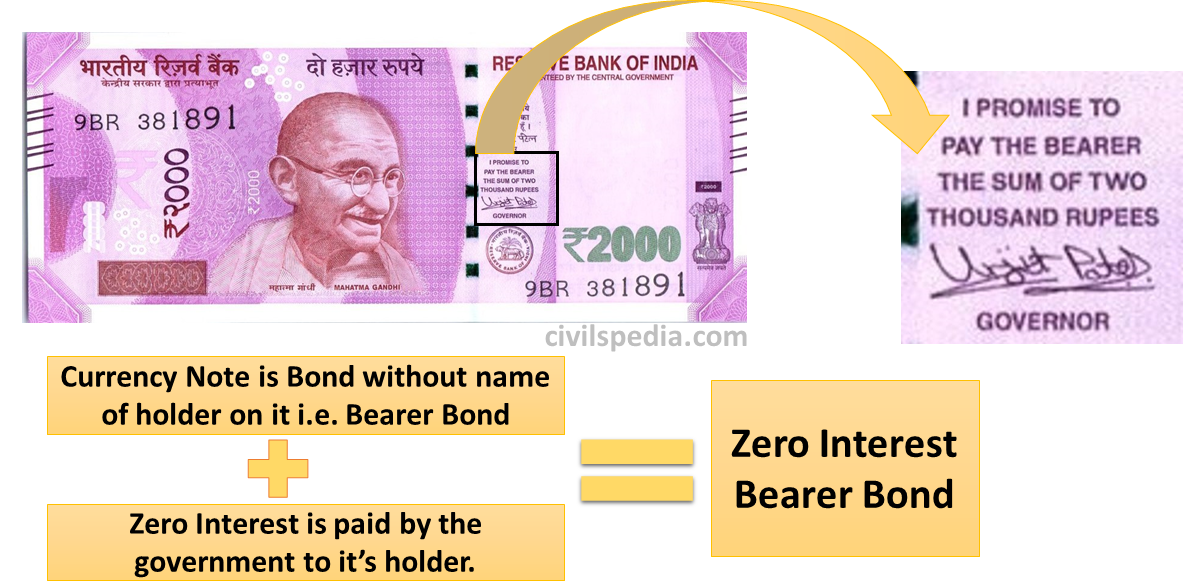
2.1.2 Bearer Bonds
They are regular bonds, but they don’t have the holder name.
Nobody can keep a record of them because no name is written on them. Hence, it can be easily used in money laundering and illegal activities.
Why do Governments issue bearer bonds?
When the Government is in dire need of money like at the time of war, they can’t go in a lengthy procedure of checking the credentials.
Note: Currency is Zero Interest
Bearer Bond.
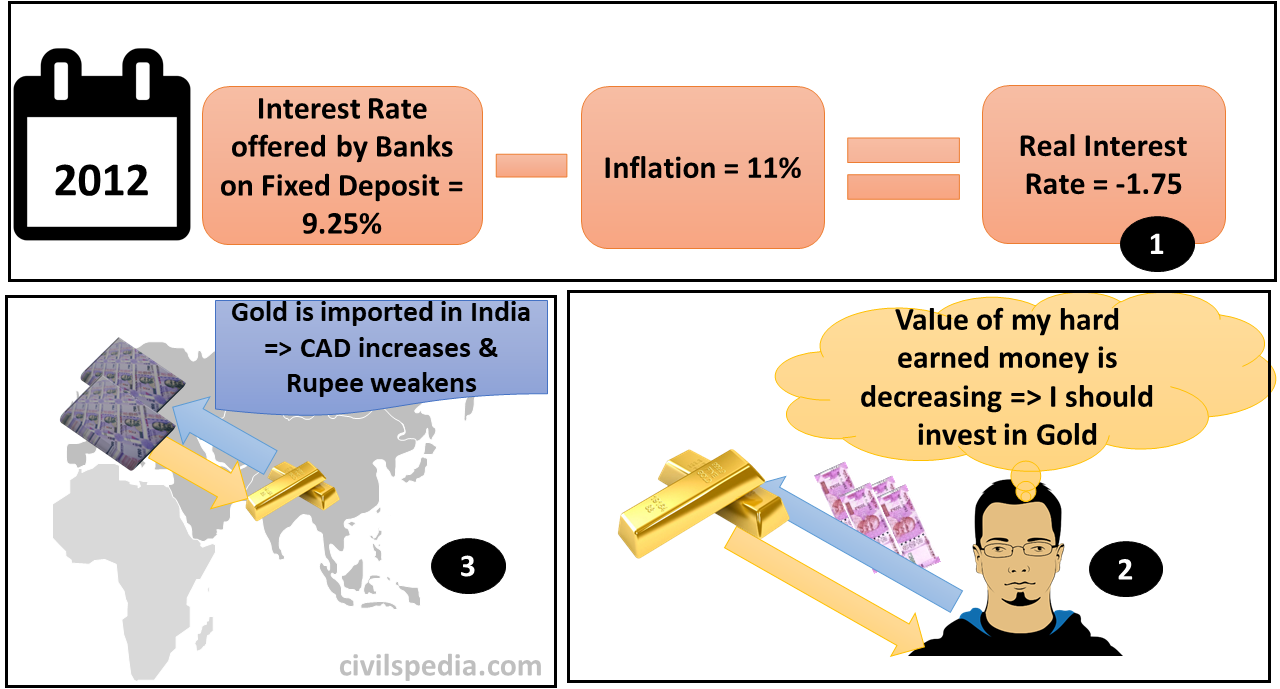
2.1.3 Inflation Index Bonds
If interest offered by the bond is less than the inflation, a person who has invested in these bonds will lose his money’s purchasing power. Hence, in these situations, people start to invest in Gold to preserve the purchasing power of their hard-earned cash, thereby increasing the Current Account Deficit and weakening the rupee further.
To deal with such situations, the Government of India came up with Inflation Index Bonds in 1997, 2013 and 2018 to provide positive real interest rates to households, thereby reducing Gold consumption.
Inflation-indexed bonds provide returns that are always in excess of inflation, ensuring that price rise does not erode the value of savings.
In Inflation Index Bonds, Interest Rate is relative to the inflation in the economy. Eg : CPI + 1.5% or WPI + 2.0% .
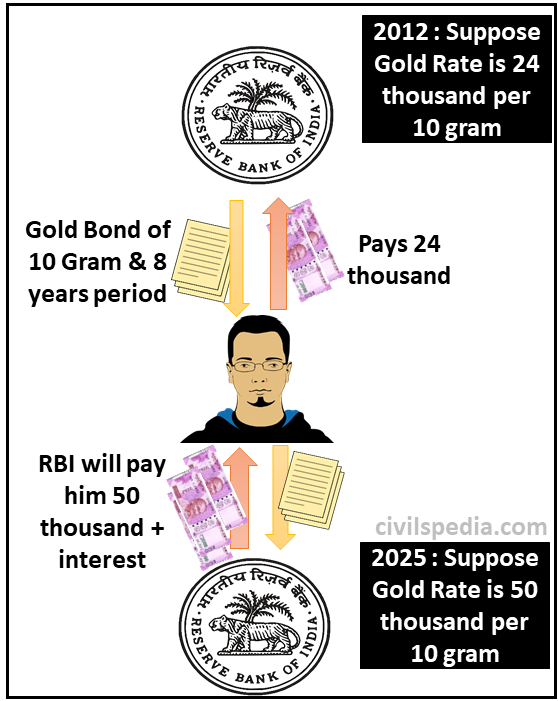
2.1.4 Sovereign Gold Bond
RBI issues Sovereign Gold Bonds on behalf of the government to deal with the problem of gold imports in India.
These bonds are denominated in Gold Grams, and apart from that, the interest of 2.5 to 2.75% is also given. At the end of the tenure of a bond, the person gets an amount equivalent to prevailing gold prices at that time, along with interest.
2.1.5 Municipal Bond
Municipal Bonds are issued by Municipal Corporations.
In India,Bangalore Municipal Corporation was the first to launch Municipal Bond in 1997. Other Municipal Corporations like Ahmedabad, Surat, Pune, Indore, Lucknow, Vadodara etc., have also used this route.
Municipalities are permitted to raise up to ₹10,000 crores via Municipal Bonds.
The urban local bodies (ULBs) are encouraged to tap the bond market under the AMRUT scheme.
Need of Municipal Bonds
Smart Cities & Municipal Bonds: To build smart cities, we need a huge capital, which can be raised via Municipal Bonds.
Financial Crunch of Urban Local Bodies (ULBs): ULBs need to gather huge funds from all available sources to improve the conditions of urban infrastructure. Municipal bonds are a good option.
Committee on urban infrastructure headed by Isher Judge Ahluwalia (2011) had estimated that Indian cities would need to invest around ₹ 40 trillion at constant prices in the two decades till 2031 in urban infrastructure.
14th Finance Commission & Niti Aayog’s 3-Year Agenda also recognise the role of Municipal Bonds in building Urban Infrastructure.
Financial discipline: Raising money from capital markets incentivises municipal corporations to fund new projects and encourages them to become financially disciplined and governance oriented
Challenges
Municipal Bonds are not time tested, and it won’t be easy to attract investors.
It can also be a source of inequalities because the better rated municipal corporations would corner most of the investment, crowding out the investment for the already infrastructurally backward cities.
PFRDA classifies municipal bonds as Class C instruments instead of Class G (Government securities), making them compete with other Class C instruments having higher yields, thus making municipal bonds unattractive.
Most of the Municipalities under Smart City Projects are below BBB- ratings on S&P which means below investment grade.
It will be a challenge to use the capital raised via Municipal Bonds. ULBs can’t absorb huge funds.
No tax benefits: Unlike many Western countries, there are no special tax benefits.
The way forward: Denmark has an agency to protect bondholders if one city in the pool defaults. The Indian government can look into the feasibility of this to instil confidence in the minds of investors.
2.1.6 Consol Bonds
Consol Bond is the short form used for ‘Consolidated Bond‘.
Features of Consol Bond
It doesn’t have any maturity date.
It has an annual interest rate of 4-5% for perpetuity (but will not return principal).
However, the government can buy back the bond when it has sufficient money.
It was in the news because during the Covid pandemic, economists argued for issuing such bonds to revive the economy.
2.1.7 Oil Bonds
Before 2010 for
petrol and 2014 for diesel, the government forced the oil marketing companies
to sell oil at subsidised rates. Instead of paying the oil companies for their
losses, the government issued them oil bonds to contain the fiscal deficit.
Features of Oil Bonds
These Oil Bonds were Long Term (15 -20 years) Government Securities.
They weren’t considered while calculating Fiscal Deficit, but they were part of Public Debt.
They aren’t considered in the SLR requirements of Banks.
2.2 Long-Term Debt Instruments issued by Companies
They are of various types
2.2.1 Redeemable Bonds
The company will pay regular interest and return the principal on maturity.
2.2.2 Irredeemable Bonds
The company will pay only interest, but the principal is not returned.
2.2.3 Partially Convertible Debenture
The company will pay interest, but at the time of maturity, some portion of the bonds will be converted to shares, and on the rest, the principal will be repaid.
Eg : 70% Debenture + 30% Share .
2.2.4 Fully Convertible
The company will pay interest, but at maturity, bonds will be converted to shares (and the principal is not paid).
2.2.5 Optionally Fully Convertible Debentures
The company will pay interest, but at the time of maturity, the company can give the investor an option to convert his bonds/ debentures to shares (just an option that the investor can accept or reject). But the ‘rate’, will be decided by the company (i.e., how many shares against how many debentures).
2.3 Long Term Debt Instruments issued by World Bank
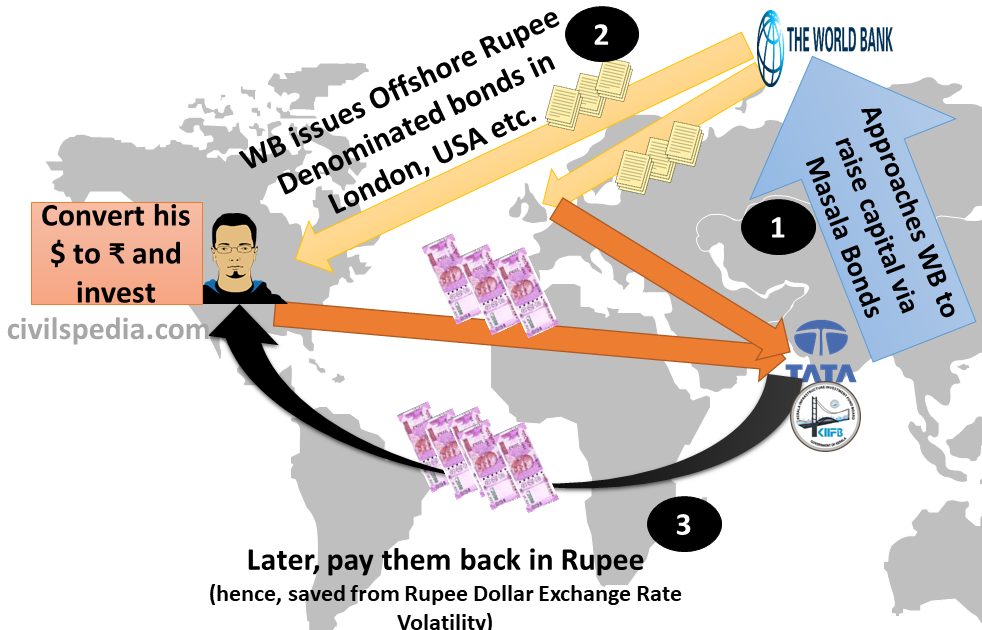
International Finance Corporation (IFC) (organ of World Bank) helps in raising offshore capital via various types of Offshore Bonds called Panda Bonds (for China), Kangaroo Bonds (for Australia) and Masala & Maharaja Bonds (for India).
2.3.1 Masala Bond
These are offshore ₹ denominated bonds.
They are known as Masala Bonds because India is famous for Spices (Formosa Bonds for Taiwan, Samba Bonds for Brazil, Samurai Bond for Japan).
They are called ‘Offshore‘ because they are floated in London and other foreign Exchanges.
‘₹ denominated’ because they are sold & bought in ₹ (& not $).
Benefits of Masala Bond
They help in fighting local currency volatility. The investor must bear the currency volatility in Masala Bonds because they buy these bonds in Rupee and later get back their principal and interest in Rupee.
Interest Rate is also low because they are issued by World Bank (IFC) and not the company itself. Hence, they are very secure (Aaa rated) because in case the company refuses to pay, World Bank will pay on its behalf.
The move to permit Masala bonds is an attempt to increase the international status of ₹ and is also a step toward full currency convertibility.
Recent activities in Masala Bonds
Indian Railway Finance Corporation (IRFC) has raised $ 1 billion via Masala Bonds.
NHAI raised capital via Masala Bonds to fund their highway projects.
Kerala Government’s Kerala Infrastructure Investment Fund Board raised capital via Masala Bonds, becoming the first state.
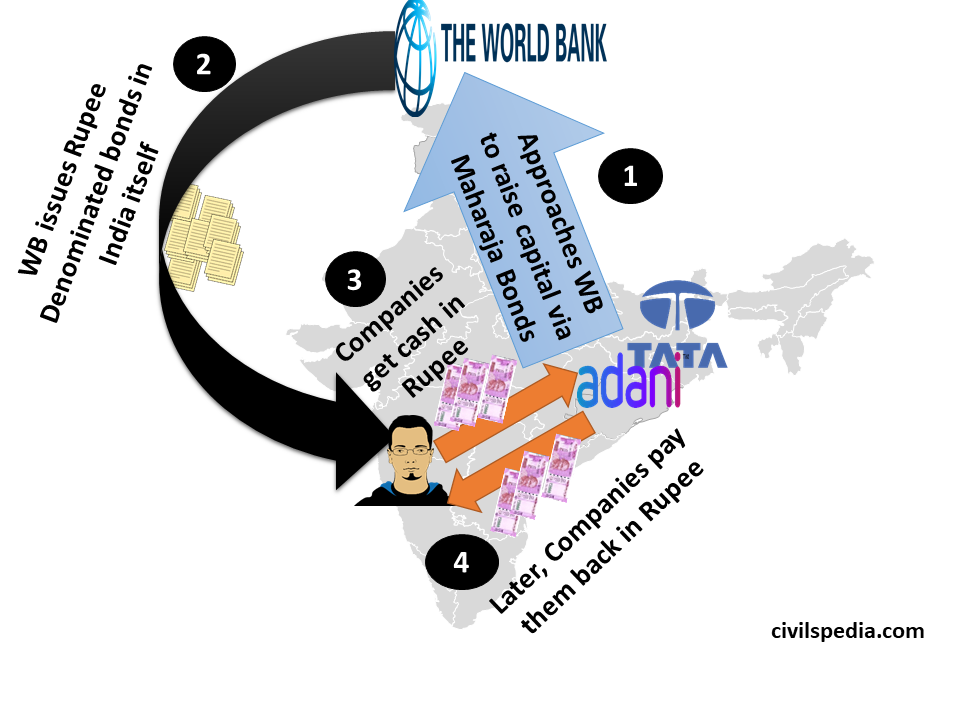
2.3.2 Maharaja Bonds
Rupee Denominated Bond issued in India by World Bank’s IFC.
Maharaja Bonds are the same as Masala Bond, but these bonds are issued in India.
They are also ‘Aaa’ rated, so interest rates are very low.
Side Topic: Formosa Bonds
Formosa bonds are bonds issued in Taiwan and denominated in currencies other than the Taiwanese Dollar.
Formosa bonds are issued by foreign companies in Taiwan.
In 2022, SBI has raised $300 million from Taiwan in the form of Formosa Bonds.
Appendix: Offshore Bonds
Currency of Bond
Issued in which country
Who issues?
Masala Bond
Rupee
denominated
Outside
India
Indian
Companies and IFC
Maharaja Bond
Rupee
denominated
Inside
India
IFC
Uridashi Masala Bond
Rupee
denominated
Japan
Indian
Companies
Panda Bond
Yuan
denominated
China
Foreign
Companies
Dim Sum Bond
Yuan
denominated
Hong
Kong
Foreign
Companies
Samurai Bond
Yen
denominated
Japan
Foreign
Companies
Yankee Bond
Dollar
denominated
USA
Foreign
Companies
Formosa Bond
Denominated
in currencies other than Taiwanese Dollar
Taiwan
Foreign
Companies
2.4 Miscellaneous Type of Long Debt Instruments
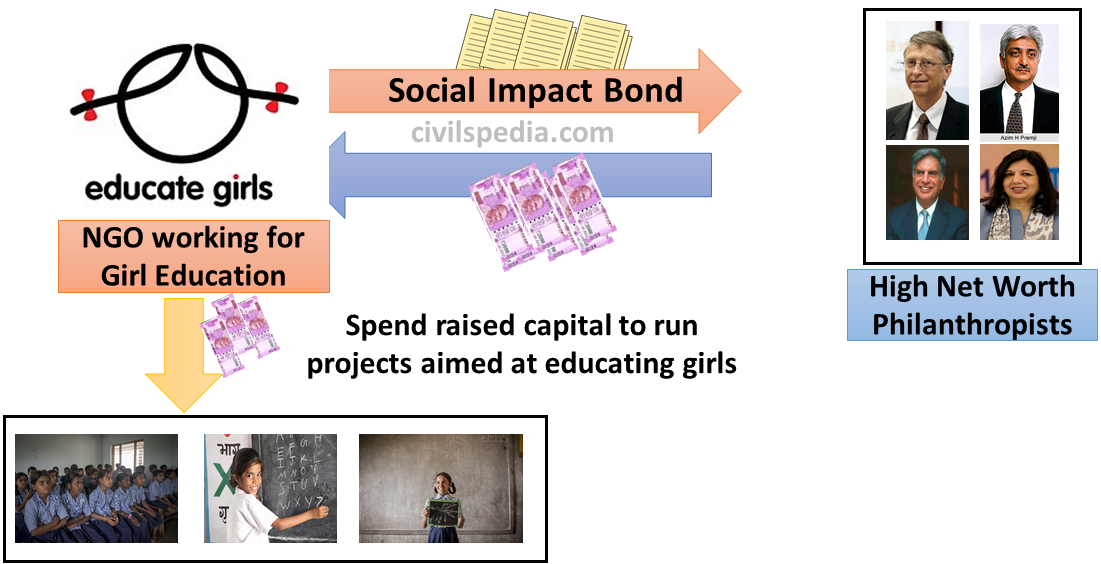
2.4.1 Social Impact Bond
Social Impact Bonds are offered to High Net worth Individuals (HNI) interested in doing philanthropic works like Bill Gates, Premji, Ratan Tata etc. Although interest offered on these Bonds is lower than general bonds, they aim to do social welfare.
E.g. :
NGO named Educate Girls issued Social Development Bonds to raise money to educate girls in India.
SIDBI issued Women’s Livelihood Bonds to invest in projects targeted at improving the livelihood of women.
In 2021, Pimpri Chinchwad Municipal Corporation signed MoU with UNDP to launch Social Impact Bond to raise capital to improve residents’ healthcare services.
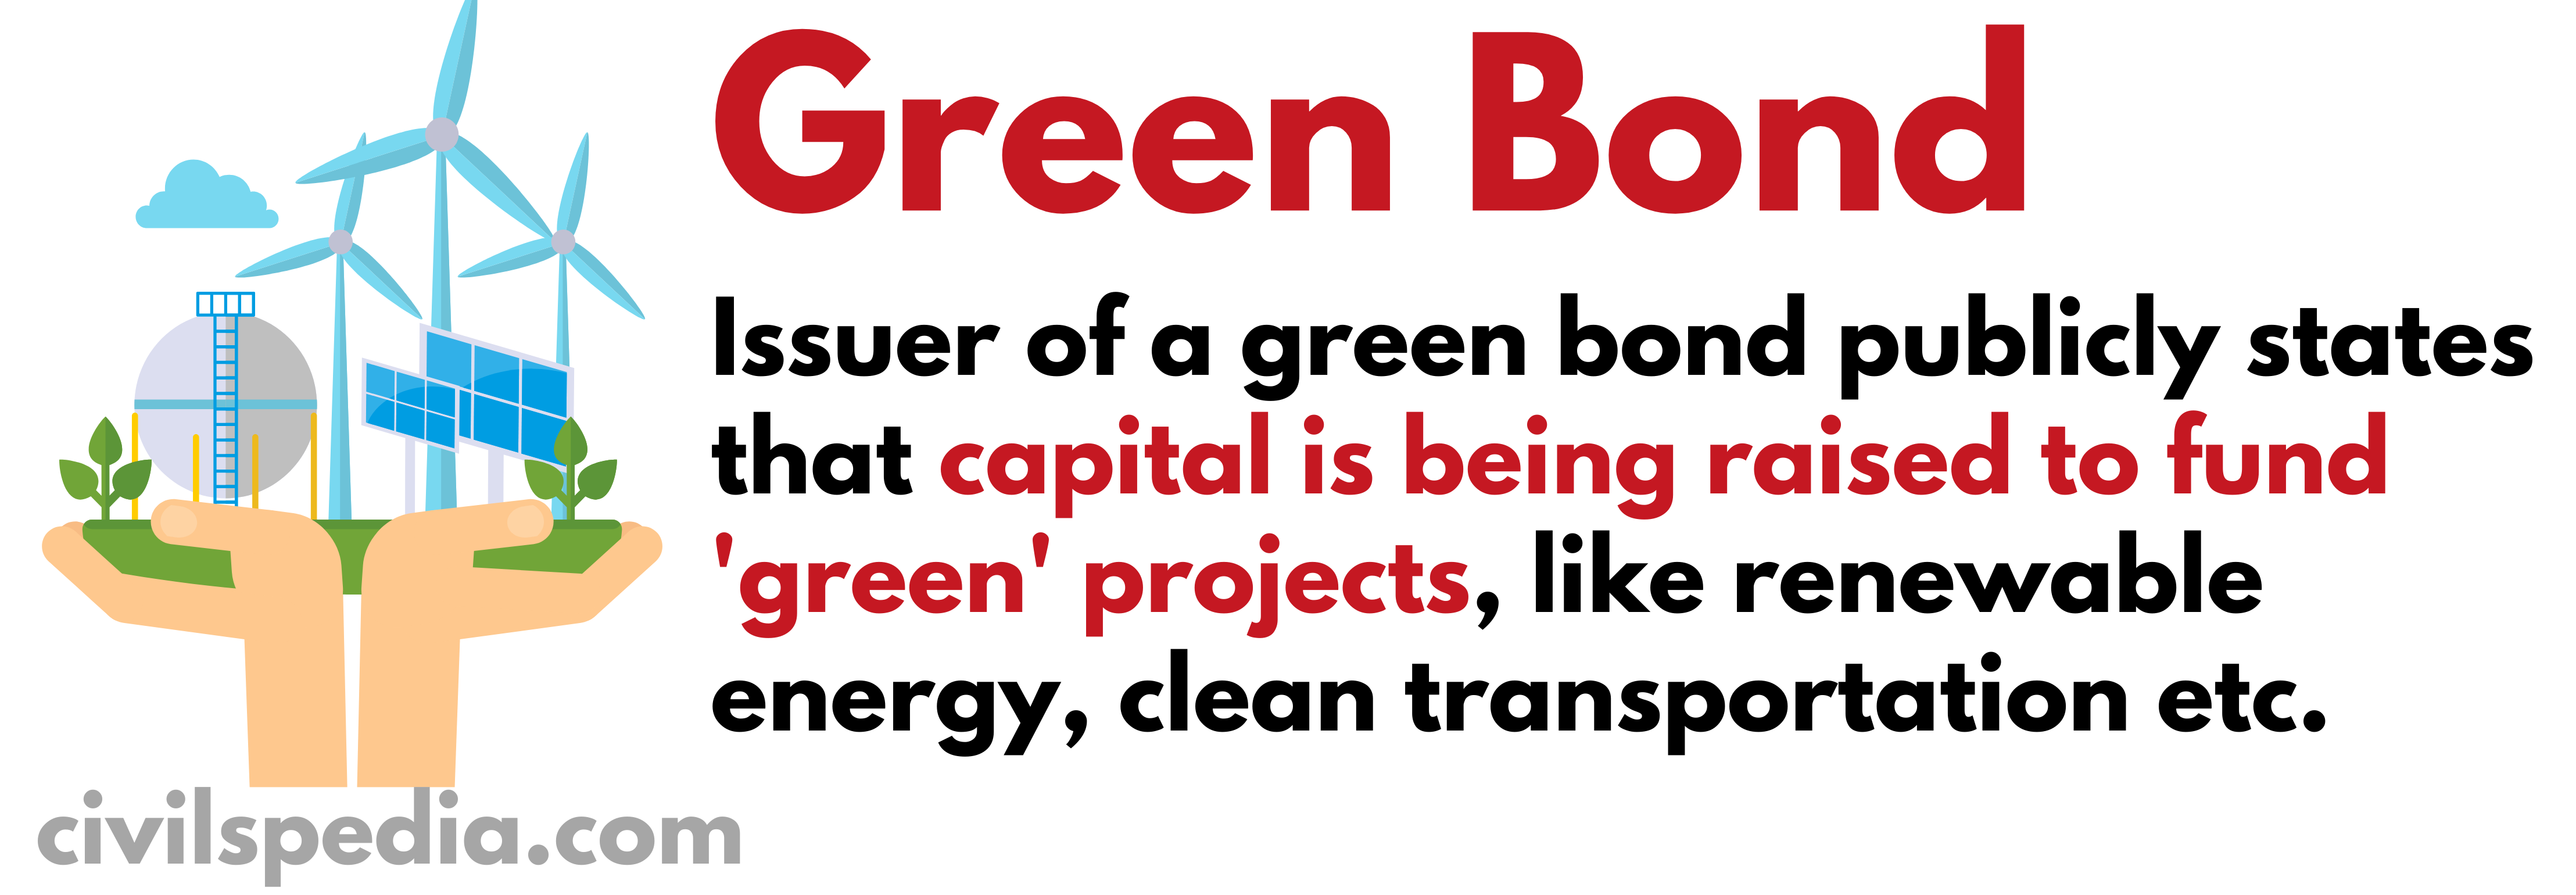
2.4.2 Green Bonds
The green bond is a type of long term bond, but the issuer of a green bond publicly states that capital is being raised to fund ‘green’ (environment friendly) projects, like renewable energy, clean transportation etc. There is no standard definition of green bonds as of now.
Examples of Green Bonds
World’s first Green Bond was launched by World Bank (2007).
India’s first Green Bond was launched by Yes Bank (2015).
Indian Renewable Energy Development Agency (IREDA) launched India’s first Masala Green Bond at London Stock Exchange (2018).
CLP India (Wind Energy Company) was the first Indian company to tap this route.
In 2022, Indian government announced that it is planning to launch Sovereign Green Bonds.
India became the seventh-largest green bond market in the world in 2017.
Side Topic: Blue Bonds
The concept of Blue Bonds is the same as Green Bonds.
The issuer publicly states that capital is being raised to fund climate-resilient water conservation or marine protection projects.
Seychelles (a small island nation in the Indian Ocean) issued the world’s first Blue Bond in 2018 for marine protection and sustainable fishery projects.
2.4.3 Catastrophe Bond
Catastrophe Bonds are high-yield bonds issued by Insurance Companies. Their interest can be as high as 18%, but if a natural disaster happens, then the principal is returned (although if a natural disaster doesn’t occur within the tenure of bond, the principal is returned).
They are frequently issued in developed western countries.
Suggestion: Indian Insurance Companies can also use this.
Equity
The basic concept behind equity: You borrow money from someone & in return, you offer a partnership.
Equity holders are called owners/ proprietors of the company.
Equity holders are given dividends in case the company earns a profit. But they have the last claim during the liquidation of the company.
Types of Equity /Shares
There are two types of shares
1. Ordinary shares
They are the most common type of Shares.
Ordinary shareholders have voting power in shareholders’ meetings, and they have the last claim during liquidation.
2. Preference shares
Although retail investors are also eligible, they are generally issued to banks by companies.
Preference is given to them in the following things.
Holders of Preference Shares are given dividends even if equity shareholders are not.
When a company is to be closed, preference shareholders are given money first from the proceeds of sales of the company’s assets.
They may have enhanced voting rights such as the ability to veto mergers or acquisitions or the right to the first refusal when new shares are issued.
Order of Claim
Bond (Debenture) > Preferential share > Ordinary Share
Terminology in Shares
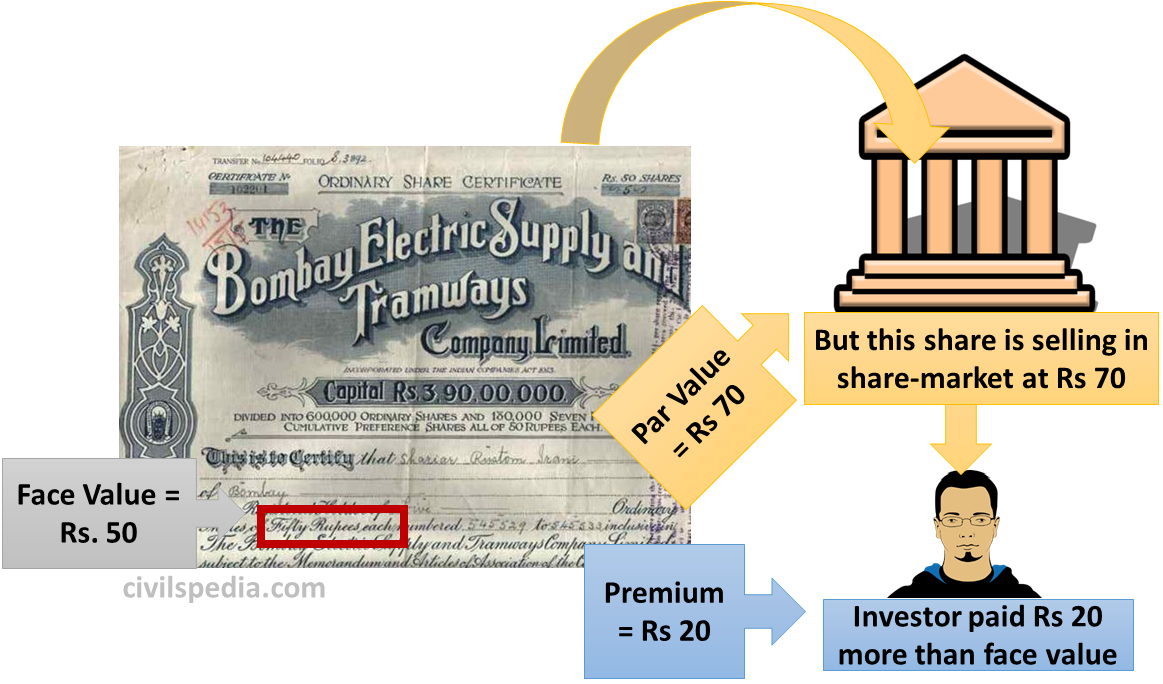
1. Face Value
Face Value is the value of the share written on the share itself.
It can be any integer – 1, 2, 3 ___25, 50, 100 (But can’t be decimal like 1.50) .
Condition: When IPO is issued, the company cannot sell Share below its Face Value.
2. Par Value
Par Value is the market-determined value of the share.
When IPO is launched, Par Value can’t be lower than Face Value. After that, the Par value is decided by the market forces. It can be lower or greater than face value.
3. Premium
If the company is doing well, a person can think that he can get a big dividend when the dividend is announced. So he can buy those shares from the Share Market at a greater price than its Face Value.
The value above Face Value is called Premium. For example, if the above share having a face value of ₹50 is selling at ₹ 70, its Premium is ₹ 20.
Digital Shares
Problems with Paper Shares
Delivery Problem
Fear of Theft
Transfer delays leading to speculations
Demat Account
Demat Account is the short form for Dematerialised Account.
This system was started in the mid-1990s.
Earlier, when investors bought shares, they got a certificate.
But now, the shares are electronically transferred to the investor’s account, known as the Demat account.
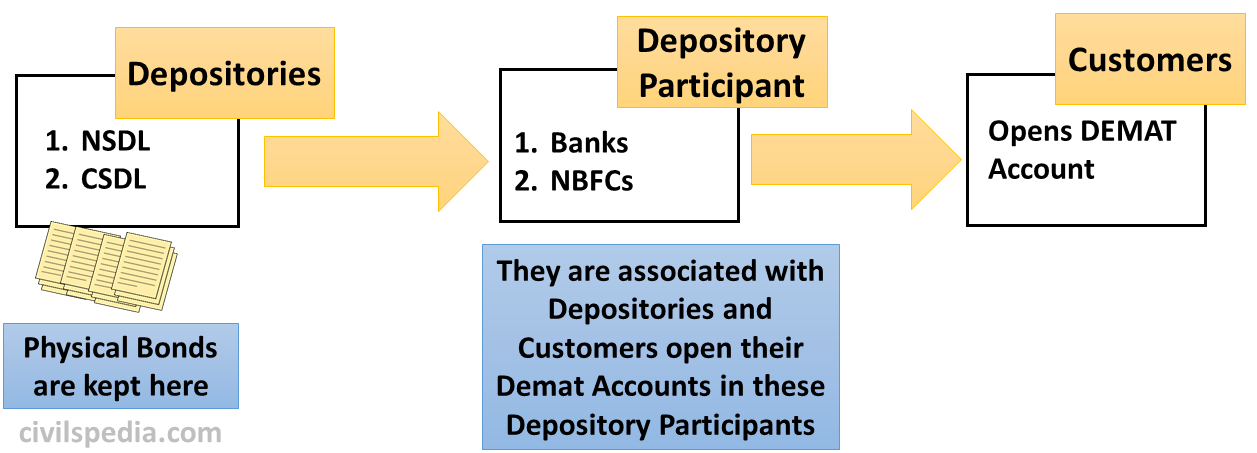
Depositories
It is like a bank locker where securities are held in physical form.
In India, there are two depositories
National Securities Depository Limited (NSDL)
Central Depository Service Limited (CDSL)
Depository Participant (DP)
Depository Participants are
the agents of depositories acting as an intermediary between the depository and the investors.
The customer must open a
“Demat” account in a depository-partner (DP) which can be a bank
or an NBFC.
E.g., ICICI, HDFC, SBI etc.
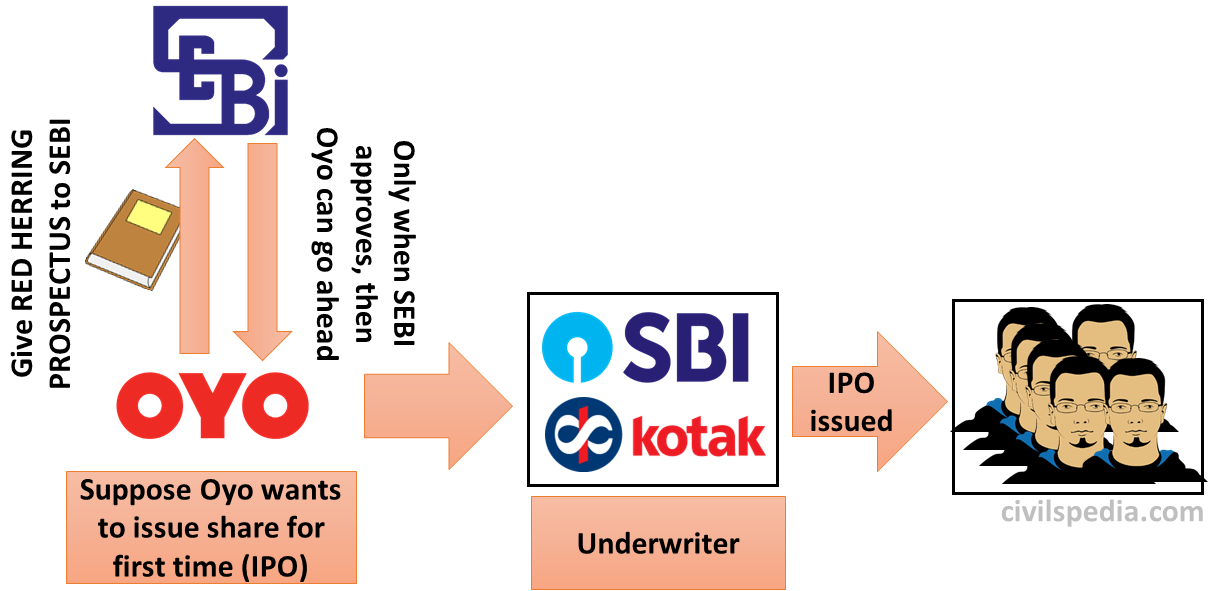
IPO (Initial Public Offer)
When a company sell the shares for the first time to the public, it is called IPO.
Red Herring Prospectus
Before the company launches its IPO to get capital via equity finance, the company has to give Red Herring Prospectus mentioning all the information about their promoters, business plan, address etc. (all details except on which date IPO would be launched & what would be the price of IPO).
Only when SEBI approves they have the permission to go ahead.
Underwriter
Underwriters are the companies who do lengthy legal work & accounting before launching IPO that require CA, Corporate Lawyers etc. They charge a commission for providing these services.
E.g.: Mahindra, ICICI etc.
How price of an IPO would be fixed?
Two methods
Method 1: Fixed Pricing Method
Suppose the company announces face value and premium in advance. Eg
Face value = ₹ 10
Premium = ₹15
Final Price = ₹25
1 lakh such shares will be issued
Hence, it would be announced that ₹25 Lakh IPO would be launched in the market.
Method 2: Book Building Method
Suppose
the application for 1 Lakh shares are invited, and investors are asked to
send applications at which price they want to get these shares.
E.g.,
Quoted price of share
Number of Applications received
₹ 500 X
10,000
₹200 X
50,000
₹ 125 X
40,000
₹100X
500
And so
on
In the above example, at ₹125, all 1 Lakh shares have been booked. Hence, the face value of each share will be fixed at ₹125, and all shares will be sold at Rs 125 per share.
Hence, all the shares are sold at face value in this case.
Follow-up Public Offer (FPO)
If the company has already issued shares previously and now issuing more shares to obtain more capital, it is called Follow-up Public Offer.
It is obligatory for the company that it can offer FPO only to the existing shareholders of the company, known as the Rights issue of share.
If the company doesn’t want the rights issue of a share, the company will have to hold a general meeting of shareholders & pass a resolution about it.
American Depository Receipts(ADR) & Bharat Depository Receipts
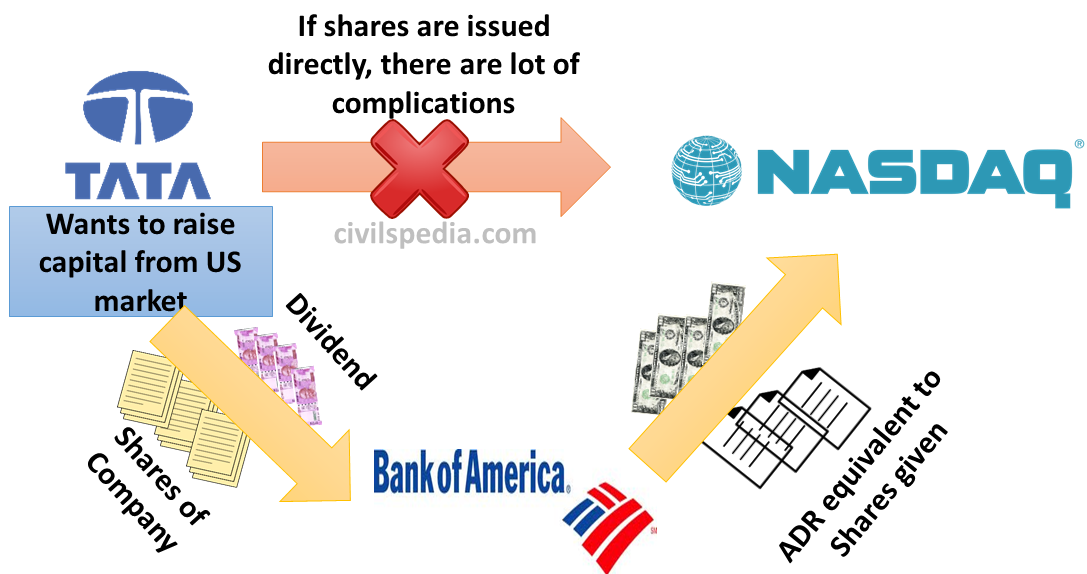
1. American Depository Receipts (ADR)
If Indian Company wants to
issue their shares in the USA, they can’t do it directly as they will have
to register in the USA and comply with other domestic regulations.
Hence, to simplify the
matters, the Indian Company can sell its shares to American Intermediary
(e.g. Bank of America). The Bank can issue an equivalent amount of
American Depository Receipts, which Americans can buy from US Stock
Exchanges.
When an Indian Company issues
a dividend, they will give that to American Intermediary, and American
Intermediary will distribute it to ADR Holders.
2. Global Depository Receipts (GDR)
GDR is same as ADR for European Union countries.
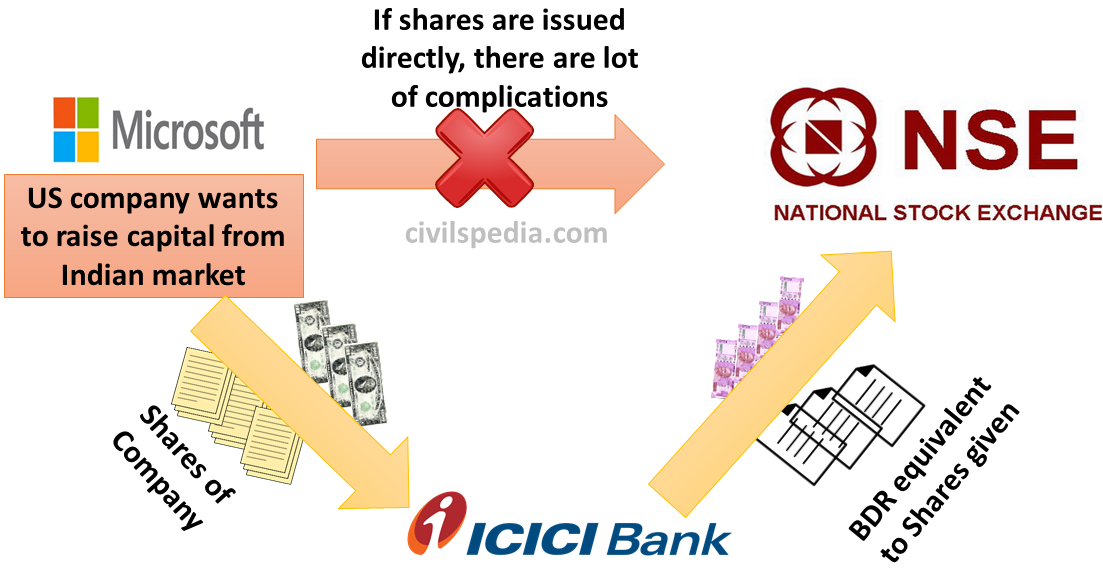
3. Bharat Depository Receipts (BDR)
BDR is opposite to ADR.
It is used when foreign companies want to issue shares in India.
Other Terms associated with Shares
1. Share Buyback
Share Buyback is the process when corporations repurchase the stock it has issued.
It reduces the number of shares outstanding, giving each of the remaining shareholders a larger percentage of the company’s ownership.
Buyback prices are more than market prices.
According to the legal provisions, companies can buy back with reserves but can’t borrow to buyback.
Share Buyback has been allowed in India since 1998.
Reasons for buyback
When companies have significant retained earnings, they don’t issue big dividends because a large amount of money will be wasted in tax. They generally use that money to buy back shares.
If management is optimistic about the future & believe that the current share price is undervalued.
Putting unused cash into use.
Raising earnings per share.
Reducing the number of shareholders to reduce the cost of servicing them.
2. Employee Stock Option Plan (ESOP)
The company gives shares to employees at a discounted rate so that employees become more committed to the company’s success (if the company makes more profit, you make more profit). Employees can sell these shares at a later date depending on the company’s share buyback policy.
Economic Survey (2020) has suggested that the government give ESOP to public sector banks’ employees to improve their performance.
3. Sweet Equity
If Company sells its shares to directors, employees etc. at a discount for their value addition like IPR & know-how.
4. Penny Stocks and Blue Chip Stocks
Penny Stock
Penny Stock are the
shares whose market price remains excessively low compared to their face
value. Such pathetic companies give zero or little dividends.
Blue Chip Stock
Blue Chip Stock are
the shares of a nationally recognized, well-established and financially sound
company with a history of generating good dividends whose market price is
very high than its face value.
5. Share Pledging
When a company raises a loan from the Bank or NBFC by pledging its shares as collateral.
6. Bull and Bear Investors
There are two types
of investors
Bull Investors
– Bulls represent charging. – An optimistic speculator who purchases a particular share hoping that share prices will rise (to sell them later at a much higher price).
Bear Investors
– Bears represent hibernation. – A pessimistic speculator who fears that share prices will fall and sells his shares.
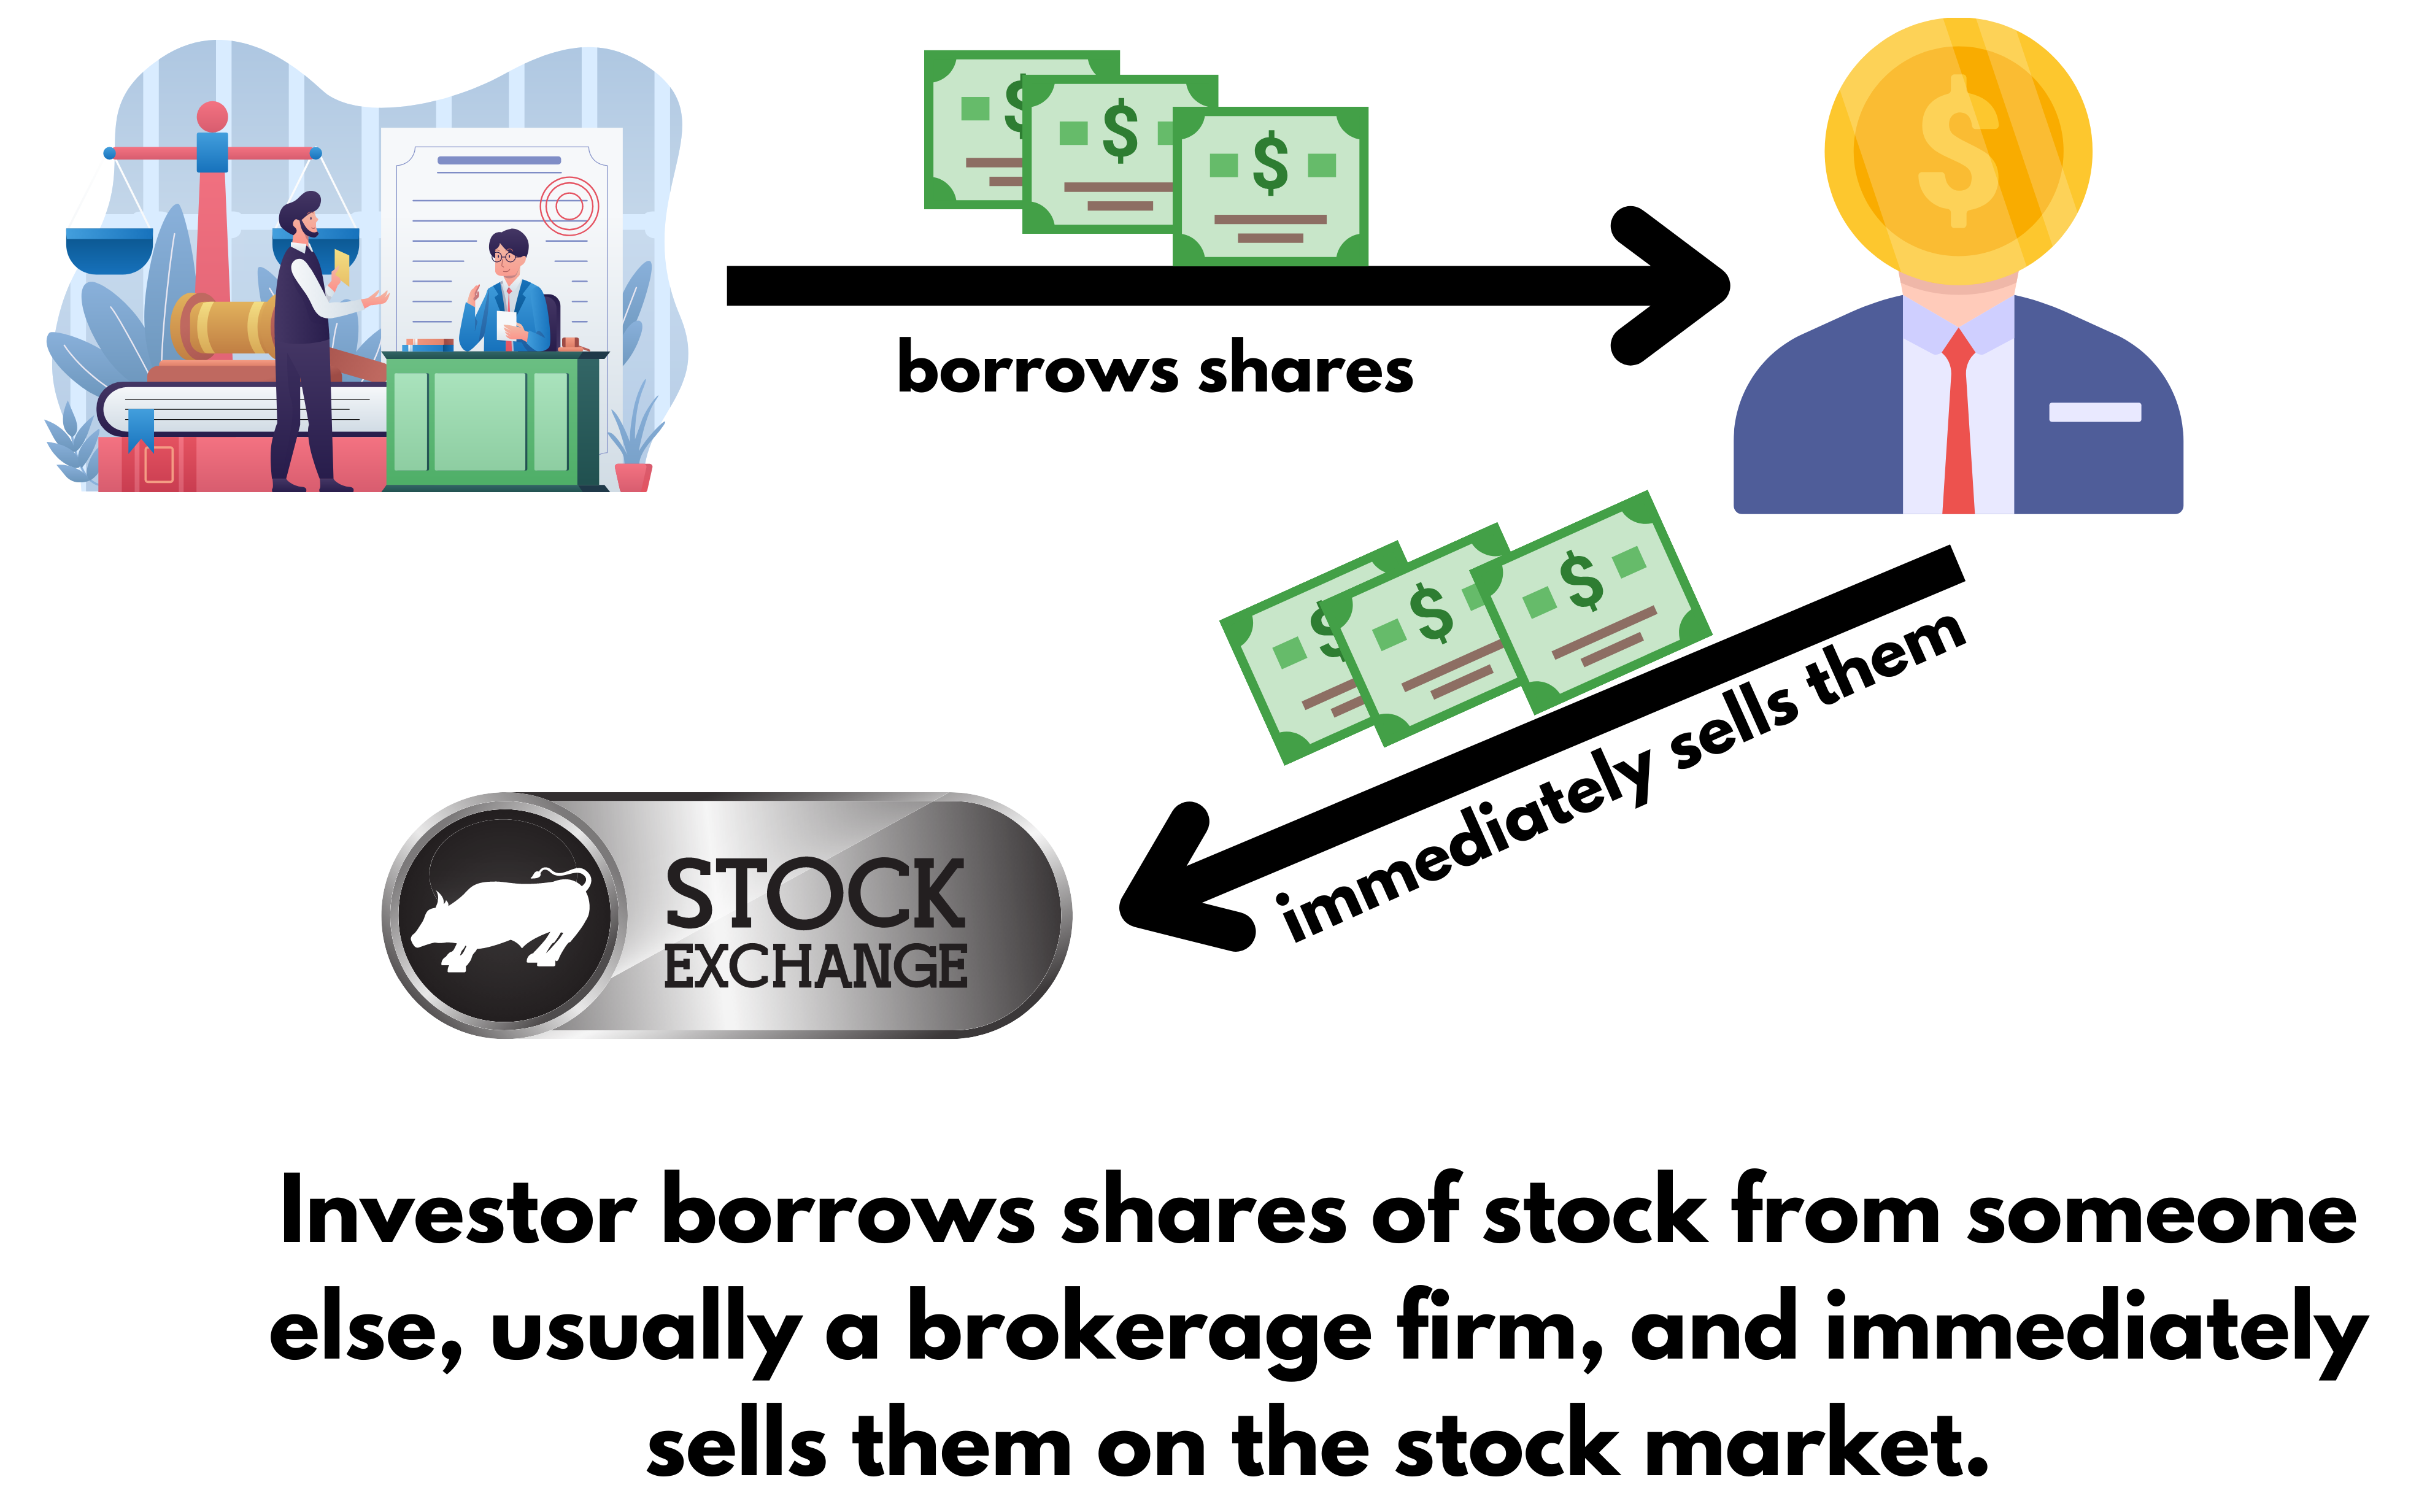
7. Short Selling
Short selling is a way to make
money by betting that a company’s stock price will go down instead of up.
How it works?
Step 1
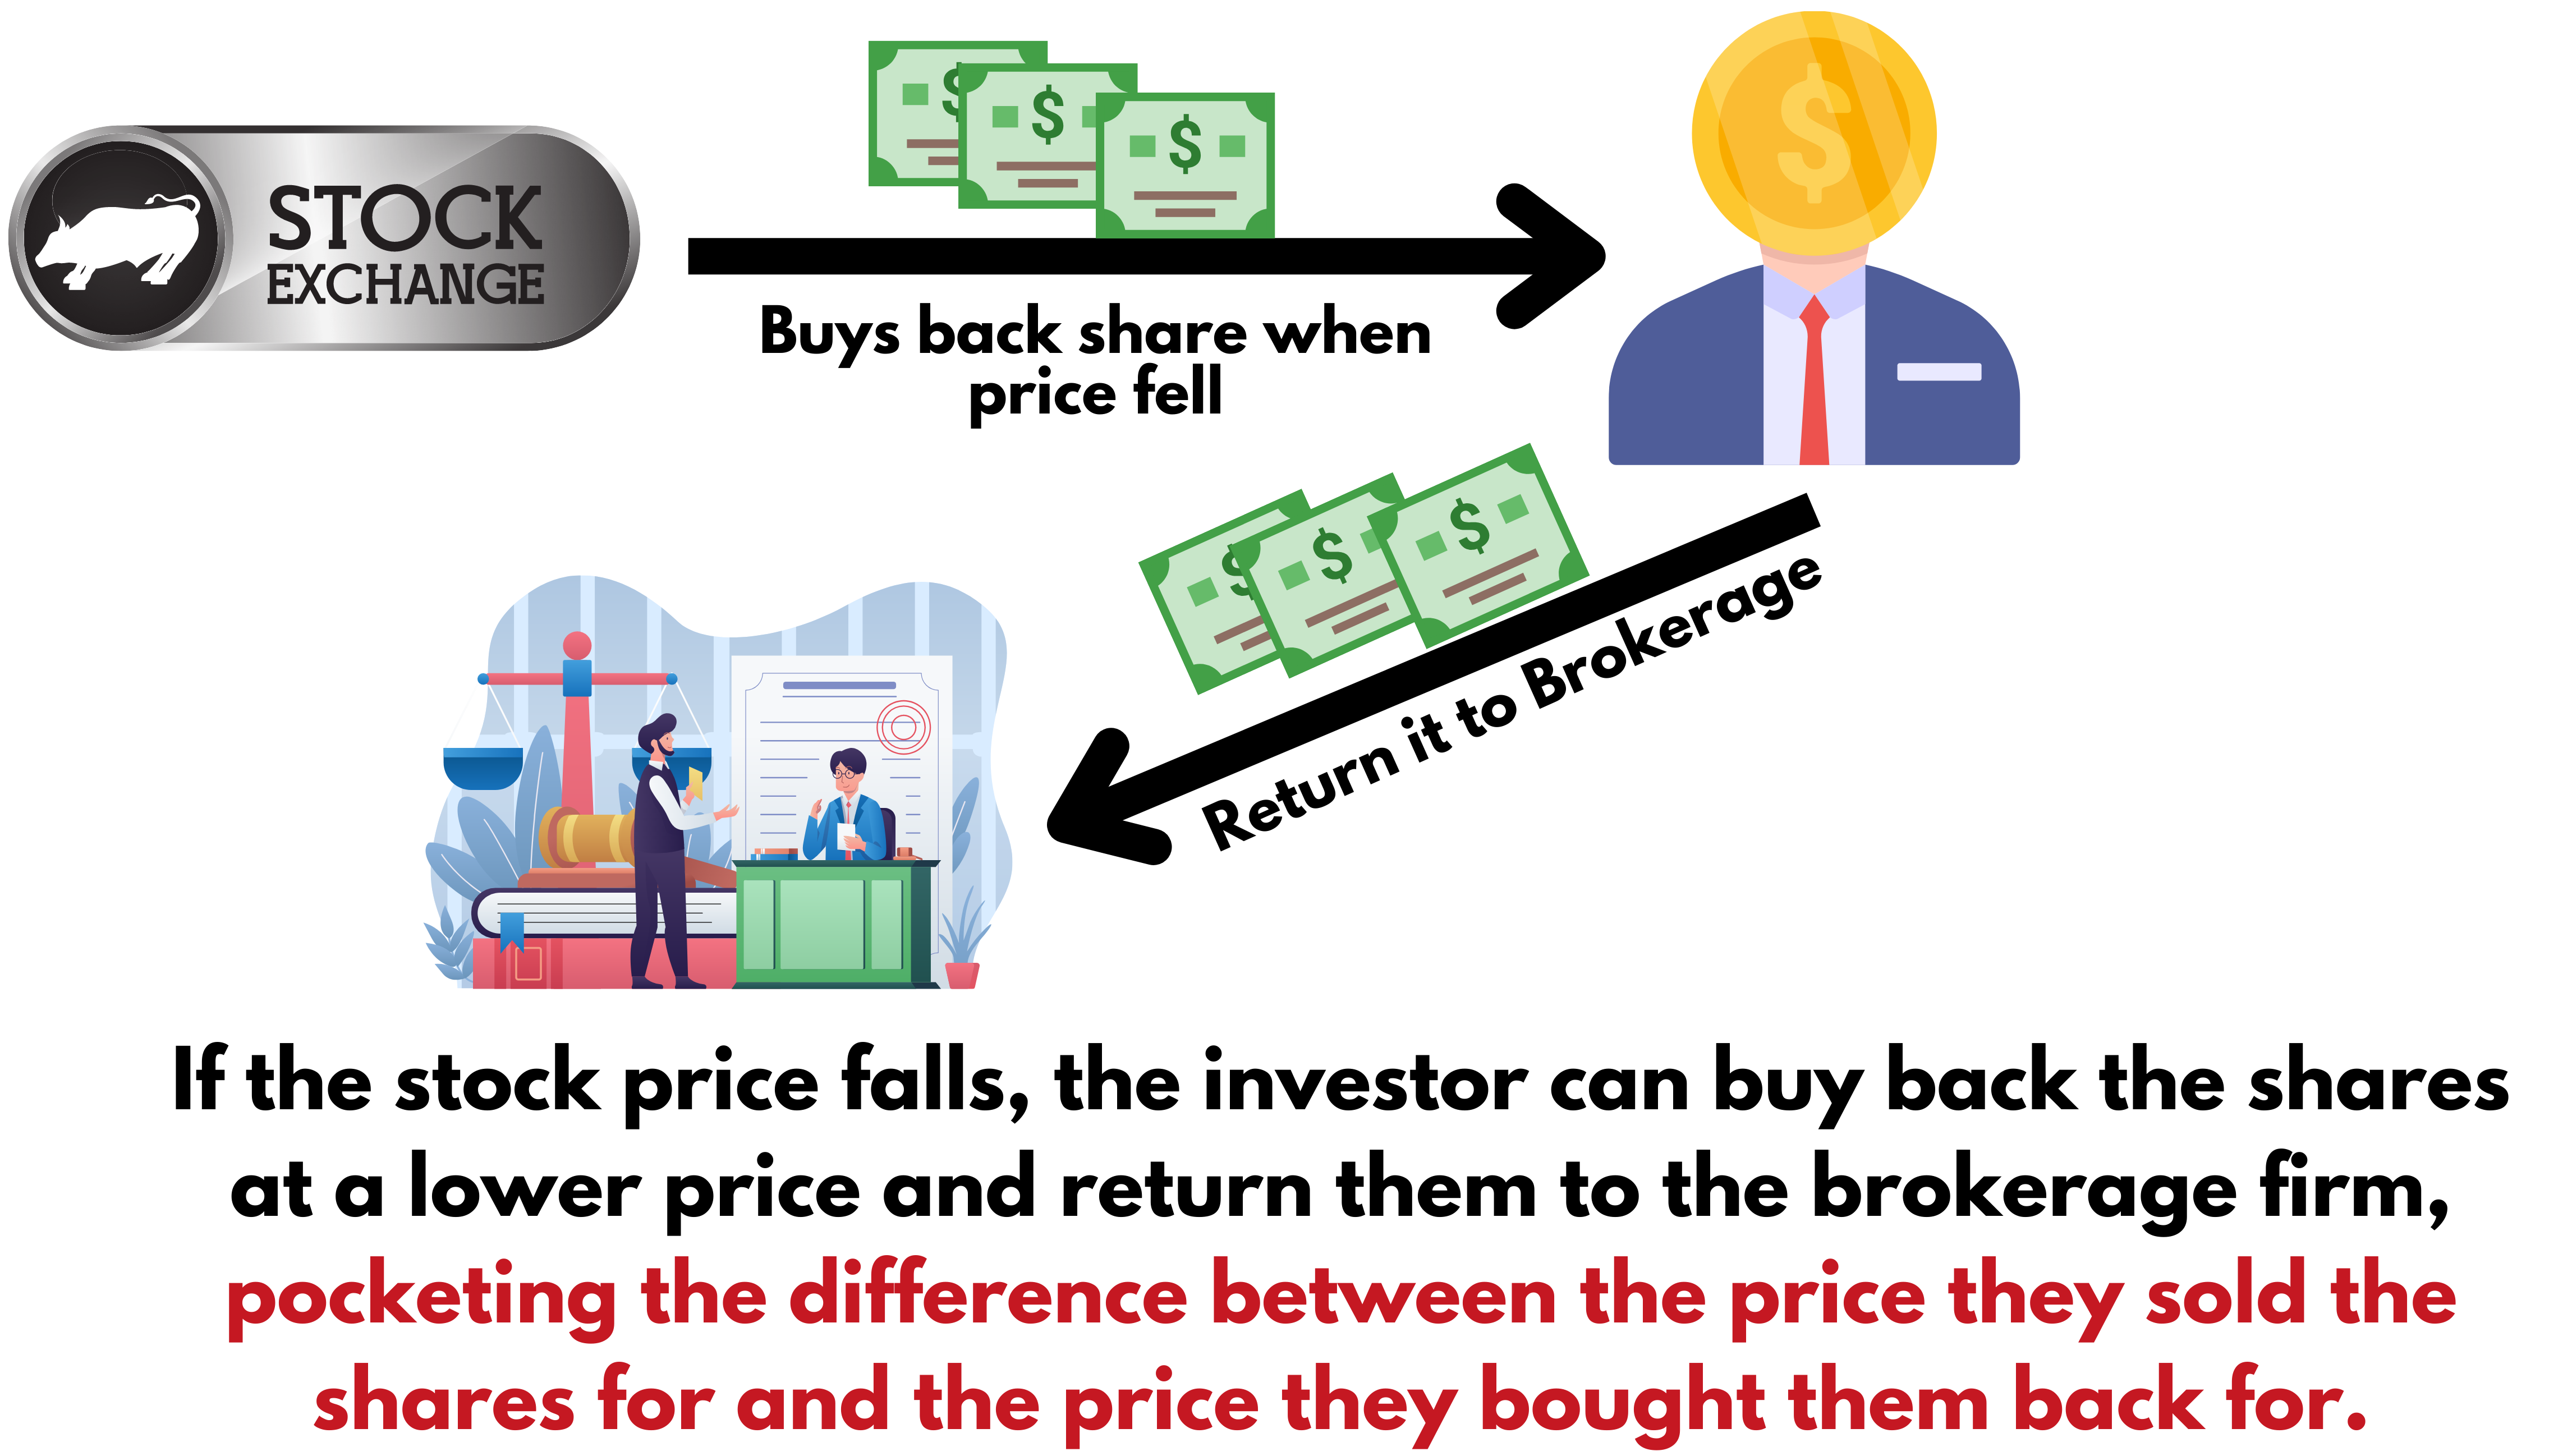
Step 2
The investor will experience a
loss if the stock price increases, as he will have to pay more to repurchase
their shares. Theoretically, this loss can be unlimited because there is no
limit to the price of the stock. Hence, it is advisable to conduct proper
research before involving in short selling.
Short selling was in news due to
Hindenburg Adani issue.
Equity funding for Start-ups
1. Venture Capitalist
The venture capitalist is a company that is willing to invest in projects that are risky but have a promising prospect. Venture Capital bridges the gap where traditional sources of funds cannot participate actively in funding new ventures.
They deal only with big things- big projects & big investments.
Venture capitalist companies arrange this money either by borrowing from companies like mutual funds, pension funds, or they may issue their bonds.
They demand part in the company and seats in the company’s Board of Directors. Hence along with capital, Venture Capitalists also bring in smart advice, hands-on management support and other skills.
The venture capital industry in India is still at a nascent stage. Topromote innovation, enterprise and conversion of scientific technology and knowledge-based ideas into commercial production, it is essential to encourage venture capital activity in India.
For decades, venture capitalists have nurtured the growth of America’s high technology and entrepreneurial communities. Companies such as Compaq, Sun Microsystems, Intel, Microsoft, and Genentech are famous examples of companies that received venture capital early in their development. Now, venture capitalists in India have a chance to do the same for Indian firms.
2. Angel Investors
These are rich gentlemen who provide financial backing to entrepreneurs for starting their business’. Angel investors are usually found among an entrepreneur’s family and friends, but they may be from outside also. They can give debt or equity, but mostly they play in equity.
They are focused on helping the business succeed rather than reaping a huge profit from their investment.
What is the need for Angel Investors?
You can take capital from Banks, IPO or venture capitalists if your business project is likely to make success based on previous experience.
But if your idea is untested & new, nobody would be interested in financing you. E.g., Steve Jobs was funded by Angel Investor when he started Apple.
In India, examples of Angel Investors include Ratan Tata, who invested in Urban Ladder, and TVM Pai, who invested in ZoomCar.
Angel investors can be recognized as Category I Alternate Investment Fund (AIF).
3. Crowd Funding
Crowd Funding is the practice of funding a project or venture by raising money from a large number of people, typically via the internet.
Various platforms like Grex, LetsVenture, etc., provide this service in India.
This funding can be of various types.
Equity-Based
Debt Based
Cause Based
Reward-Based
A large number of startups, software developers, filmmakers (e.g. Kannada movie Lucia), music festivals (e.g. Control ALT Delete) etc., have raised funds via this platform.
Debt vs Equity
Debt
Pros
1. Don’t have to share ownership. 2. Can claim an income tax deduction. 3. Less paperwork & permissions.
Cons
1. Even if the company doesn’t make a profit, it has to pay interest. 2. Have to mortgage something to get a loan.
Equity
Pros
1. No obligation to pay interest even if the company makes a profit. 2. Less tension compared to bank loans & debt.
Cons
1. Have to share ownership. 2. Have to make the board of directors. 3. Require heavy paperwork & time to initiate IPO.
Derivatives
There is another type
of security as well, known as Derivatives. We will have just an overview of
this as it is not that important from an examination point of view.
The financial instrument that derives its price from some underlying asset is known as Derivatives.
The price of derivatives are directly dependent upon the underlying asset in the present & projected future trends, which can be equity, foreign exchange, commodity or mortgaged Backed securities etc.
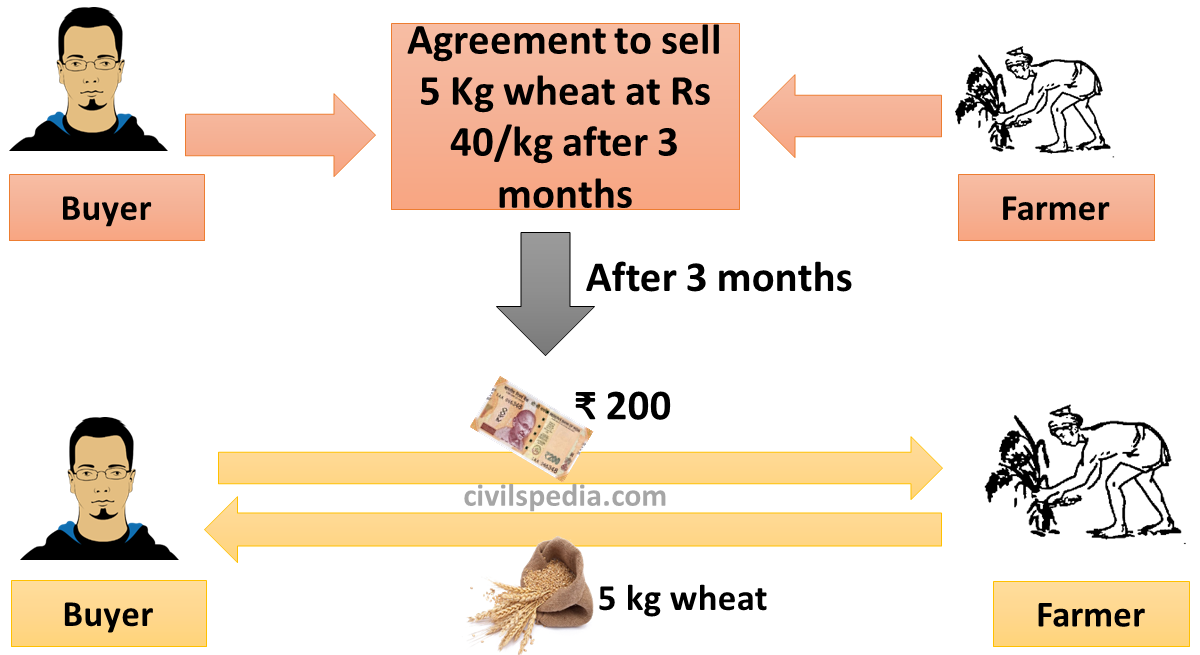
For example, wheat farmers may wish to sell their harvest at a future date to eliminate the risk of a change in prices. Such a transaction is an example of a derivative. The price of this derivative is driven by the spot price of the underlying asset, i.e. wheat.
There are four types of Derivative contracts
1. Forward
A Forward is a contract between two parties to buy or sell an asset at a specified future time at a price agreed on in the contract.
2. Future
Future is a legally binding contract that obligates the parties to transact an asset at a predetermined date and price. Here, the buyer must purchase or seller must sell the underlying asset at the set price, regardless of the current market price.
Future and forward are almost similar. But forward distinguishes itself from a future as it is traded between two parties directly without using an exchange.
3. Option
If a person buys an option, it grants him the right but not the obligation to buy or sell an underlying asset at a set price.
4. Swap
Swap refers to exchanging one financial instrument for another between the transacting parties concerned at a predetermined time.
This article deals with ‘Crony Capitalism.’ This is part of our series on ‘Economics’ which is important pillar of GS-3 syllabus . For more articles , you can click here .
What is Crony Capitalism?
Crony Capitalism is an economic system in which businessmen thrives not by their hardwork or risk taking capacity but through a nexus between a business class and the political class.
Examples of Crony-Capitalism
India
After close election
victories, contractors affiliated to the winning politician are more
likely to be awarded road projects. Around 26% of the roads listed as
completed in Pradhan Mantri Gram Sadak Yojana were missing from 2011
Census Data, suggesting they were never actually built
Brazil
Public Sector Bank was more
likely to approve loan application of a company if owner gave election
donation to the ruling party.
China
Political connections play a
role in the allocation of bank loans to Chinese firms.
Why Crony Capitalism is bad ?
Pro-Crony Policies leads to wealth destruction :
On one hand , Liberalization of Indian economy enabled creative destruction of inefficient companies by empowering markets. Creative destruction in turn enables wealth creation by allowing entry of new firms leading to increased competition and lowered prices for consumers.
But on other hand, Pro-Crony policies of government leads to wealth destruction as cronyism fosters inefficiencies by inhibiting the process of creative destruction.
Cronyism leads to rent seeking behavior
In crony-capitalism, customer is the ultimate loser as bribes paid by the industrialists are extracted from the customers .
Crony Capitalism leads to Discretionary Allocation of Natural Resources
This can be shown using example of coal. Prior to 1993, no specific criteria for allocation of captive mines existed. Allocation was done via Committee in which committee used to decide allocation to private firms. Firms that got the free resource diverted efforts towards the tunneling of the windfall gain instead of towards productive business activity. Currently, the coal mines allocation is governed by Coal Mines (Special Provisions) Act, 2015 which ensures that any future allocation of coal blocks would solely be through competitive auctions
Crony Capitalism leads to Willful Defaults
RBI defines a willful defaulter as a firm that has defaulted in meeting its repayment obligations even though it has the capacity to honour these obligations. Due to Crony Capitalism, Willful Defaulters are not given strict treatment . Such incidents have destroyed total of Rs 1.4 lakh crore from bank’s assets.
This article deals with ‘Type of Economic Systems.’ This is part of our series on ‘Economics’ which is important pillar of GS-3 syllabus . For more articles , you can click here .
Introduction
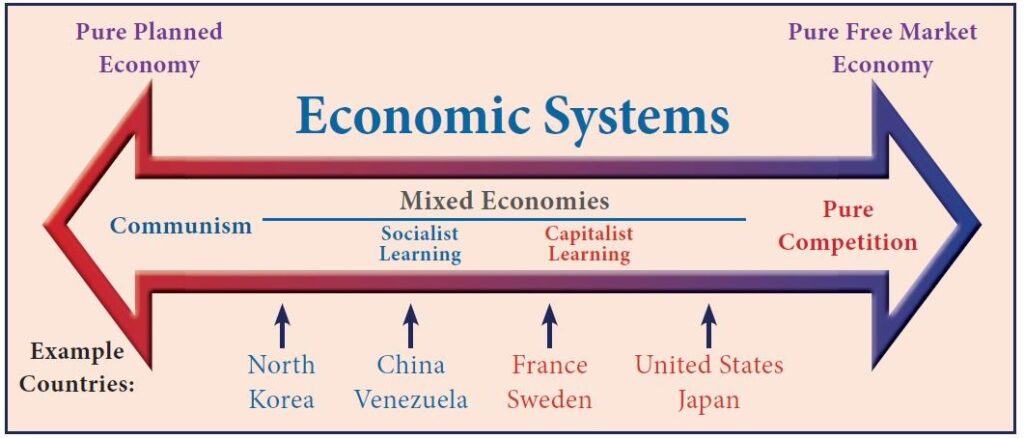
Economic System refers to the manner in which individuals and institutions are connected together to carry out economic activities in a particular area.
There are three major types of economic systems. They are:
Capitalistic Economy (Capitalism)
Socialistic Economy (Socialism)
Mixed Economy (Mixedism)
1 . Capitalistic Economy
Capitalistic Economy is also
termed as a free economy (Laissez faire, in Latin) or market economy where
the role of the government is minimum and market determines the economic
activities.
Adam Smith is the ‘Father of
Capitalism’.
Main features of Capitalistic economy are
The means of production are privately owned.
Golden rule for a producer
under capitalism is ‘to maximize profit.’
There is free competition as government or
any authority cannot prevent firms from buying or selling in the market.
Freedom of Choice and Enterprise i.e. each individual is free
to carry out any occupation or trade and produce any commodity. Similarly,
consumers are free to buy any commodity as per their choice.
Capitalist society is divided into two classes – ‘haves’ that is those who own
property and ‘have-nots’ who do not own property and
work for their living. The outcome of this situation is that the rich
become richer and poor become poorer.
Merits of Capitalistic Economy
Automatic Working: Without any
government intervention, the economy works automatically.
Efficient Use of Resources:
All resources are put into optimum use.
Incentives for Hard work: Hard
work is encouraged and entrepreneurs get more profit for more efficiency.
Production and productivity
levels are very high .
Consumers Sovereignty: All
production activities are aimed at satisfying the consumers.
Development of New Technology:
As profit is the main motive, producers invest on new and efficient
technology
Demerits of Capitalistic Economy
Concentration of Wealth and
Income in a few hands and thereby increases inequalities of income.
Frequent recessions after
certain period of time leading to hardship for the people.
Wastage of Resources: Large
amount of resources are wasted on competitive advertising and duplication
of products .
Class Struggle: Capitalism
leads to class struggle as it divides the society into capitalists and
workers .
Even the harmful goods are
produced if there is possibility to make profit.
2 . Socialistic Economy
Socialistic economy is also known as ‘Planned Economy’ or ‘Command Economy’.
Karl Marx is known as the ‘Father of Socialism’.
Main features of Capitalistic economy are
The Means of Production are owned by the
government.
Planning is an integral part
of a socialistic economy and all decisions are undertaken by the central
planning authority.
Social welfare is the guiding principle behind all economic
activities.
There is absence of competition in the market. The state has full control over
production and distribution of goods and services.
Equality of Income as under socialism private property and the law of
inheritance do not exist.
Socialism provides equal opportunity for all through free health, education and
professional training.
There is a classless society
and so no class conflicts.
Merits of Socialistic Economy
Reduction in Inequalities: No
one is allowed to own and use private property to exploit others.
Allocation of Resources as
central planning authority decides allocation of resources.
Absence of Class Conflicts.
Economic fluctuations can be
avoided in Socialistic Economy.
Demerits of Socialist Economy
Red Tapism and Bureaucratic
lethargy impacts the output of economy.
System does not provide any
incentive for efficiency.
Consumers do not enjoy freedom
of choice over the consumption of goods and services.
Concentration of Power in the
hands of State.
3 . Mixed Economy
In a mixed economy system both
private and public sectors co-exist and work together towards economic
development.
It is a combination of both
capitalism and socialism and tends to eliminate the evils of both
capitalism and socialism.
Examples of Mixed Economy
includes India, England, France and Brazil.
Features of Mixed Economy
Means of production and
properties are owned by both private and public.
In mixed economies, both
private and public sectors coexist. Private industries undertake
activities primarily for profit. Public sector firms are owned by the
government with a view to maximize social welfare
Basic problems of what to
produce, how to produce, for whom to produce and how to distribute are
solved through the price mechanism as well as state intervention .
Though private has freedom to
own resources, produce goods and services and distribute the same, the
overall control on the economic activities rests with the government.
Merits of Mixed Economy
It promotes rapid economic
growth as public requirements and private needs are taken care of.
Economic Equality: The
government uses progressive rates of taxation for levying income tax to
bring about economic equality.
Government safeguards the
interest of the workers and weaker sections by legislating on minimum
wages, and rationing, establishing fair price shops and formulating social
welfare measures.
Demerits of Mixed Economy
Lack of coordination between
public sector and private sector as both work with divergent motives.
Most of the public sector
enterprises in Mixed Economy remain inefficient due to lethargic
bureaucracy and red-tapism .
The fear of nationalization
discourages the private entrepreneurs in their business operations and
innovative initiatives.
Inequalities are present
as Ownership of resources, laws of
inheritance and profit motive of people widens the gap between rich and
poor.
Hence, inequality of capitalism and inefficiency of
socialism are found in mixed economies.
This article deals with ‘Inflation.’ This is part of our series on ‘Economics’ which is an important pillar of the GS-3 syllabus. For more articles, you can click here.
Introduction
Inflation can be defined as the persistent rise in the general level of prices of goods and services in an economy over a period of time.
If the price of one good has gone up, it is not Inflation; it is Inflation only if the prices of most goods have gone up.
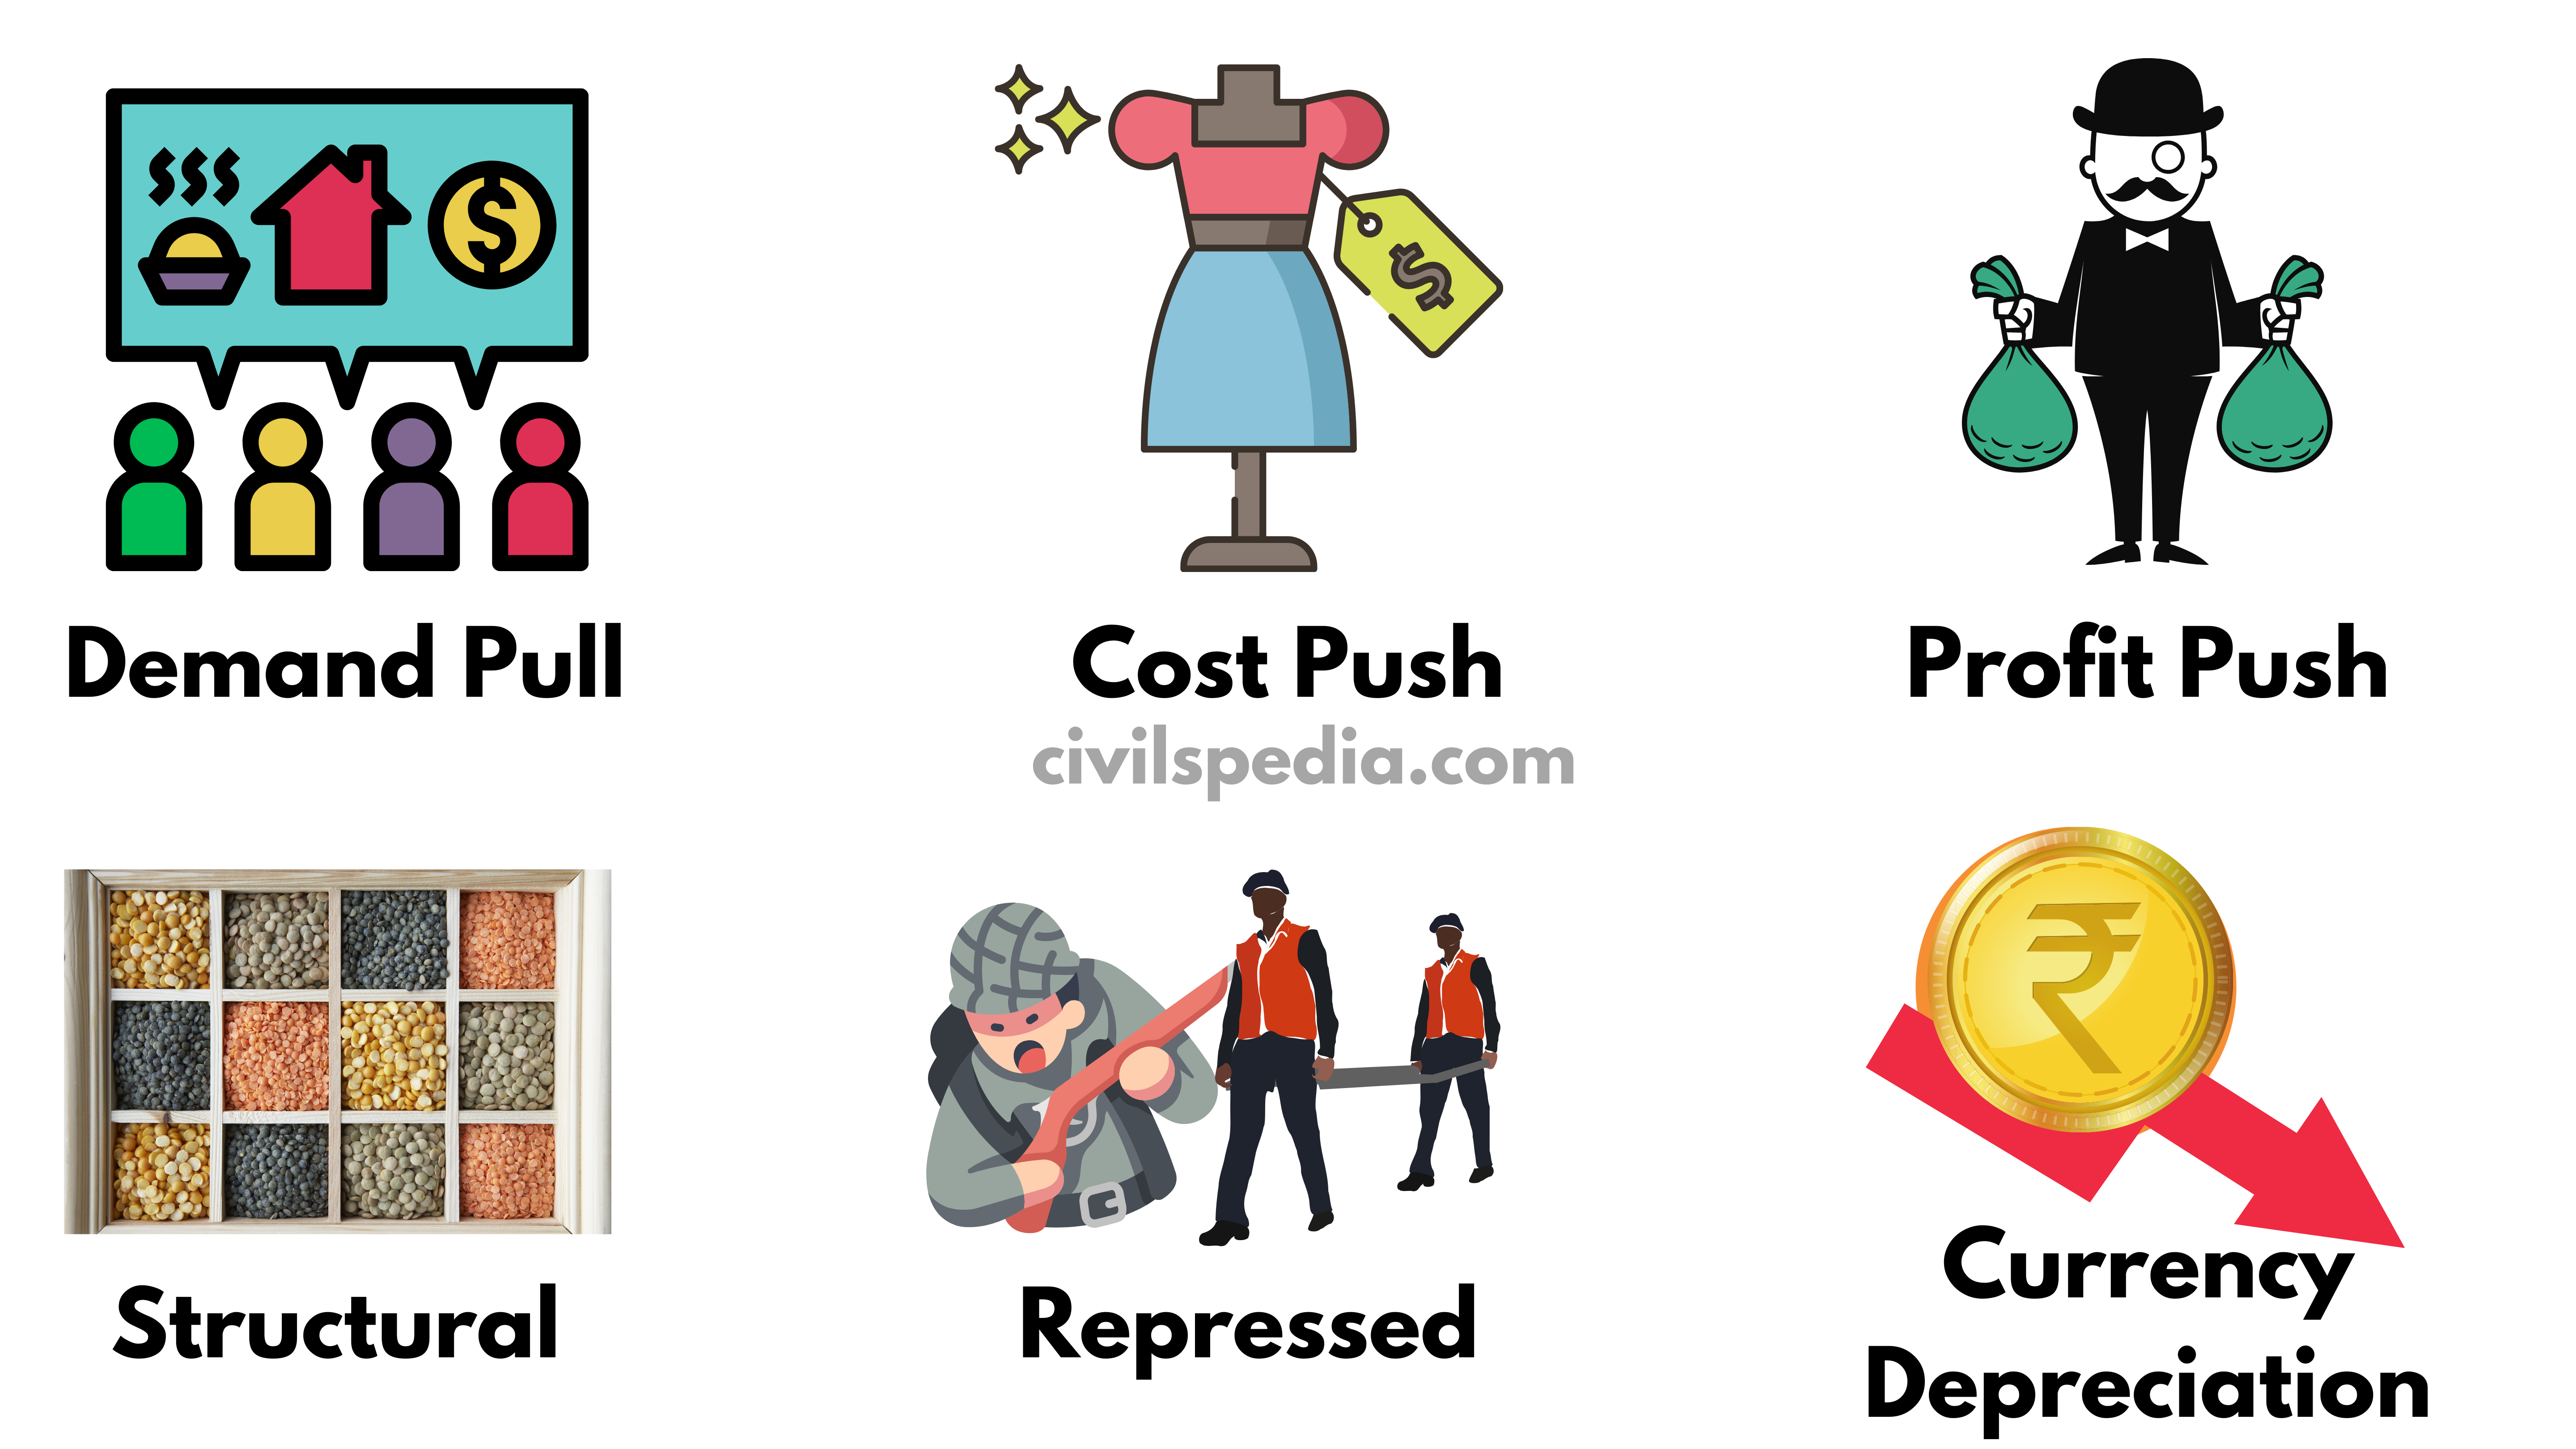
Why does Inflation occur?
1. Demand-pull Inflation
In his book “General Theory on employment, interest, money”, British Economist J.M. Keynes (1883) said, “when the economy is functioning at full employment, aggregate supply will match aggregate demand.” The economy will have a ‘General Price’ level at this equilibrium.
Demand-pull Inflation happens when aggregate demand exceeds aggregate supply.
It can happen (i.e. demand can exceed supply) in the following situations
Increase in money supply due to RBI’s expansionary or easy money policy.
Increase in the propensity to consume.
Increase in investment expenditure.
Increase in the fiscal deficit of the governments.
Increase in net exports.
To tackle such Inflation, the government can
Reduce money supply by increasing interest on loans.
Induce people to save rather than consume by giving attractive investment options.
Follow Fiscal Consolidation and keep fiscal deficit in check.
Import goods in short supply.
2. Cost-push Inflation
It is also known as supply shock inflation.
When supply is reduced due to an increase in the price of raw materials, leading to a higher cost of production.
3. Profit-push Inflation
When Cartels, Monopolists, or Oligopolists deliberately cut their supply or hoard their produce or hike the price in greed of more profit.
E.g., OPEC increases the price of Petroleum or greedy Indian Merchant hoard onion so that their price increases.
4. Structural Inflation
It is caused by deficiencies in certain conditions in the economy when it cannot respond to people’s increased demand for certain specific things or a lack of infra to make commodities available to consumers.
5. Repressed Inflation
During wars or natural disasters, governments impose price controls and rationing measures to keep prices in check. But after the controls are withdrawn at the end of war or disaster, prices will rise rapidly as traders try to cover up their earlier losses, leading to inflation.
6. Other causes
The depreciation of Rupees makes the import of goods expensive.
Post Covid-19 Case Study
After
the Covid-19 pandemic, high inflation was observed because
Demand-push inflation was observed as most countries were following easy money policy and providing loans at low rates.
Repressed inflation was observed due to the pent-up demand of the customers.
Cost-push inflation was observed due to an increase in the price of raw materials owing to supply chain disruptions.
Profit-push inflation was observed in petroleum products because OPEC+ didn’t increase the supply of crude oil commensurate with the increase in demand.
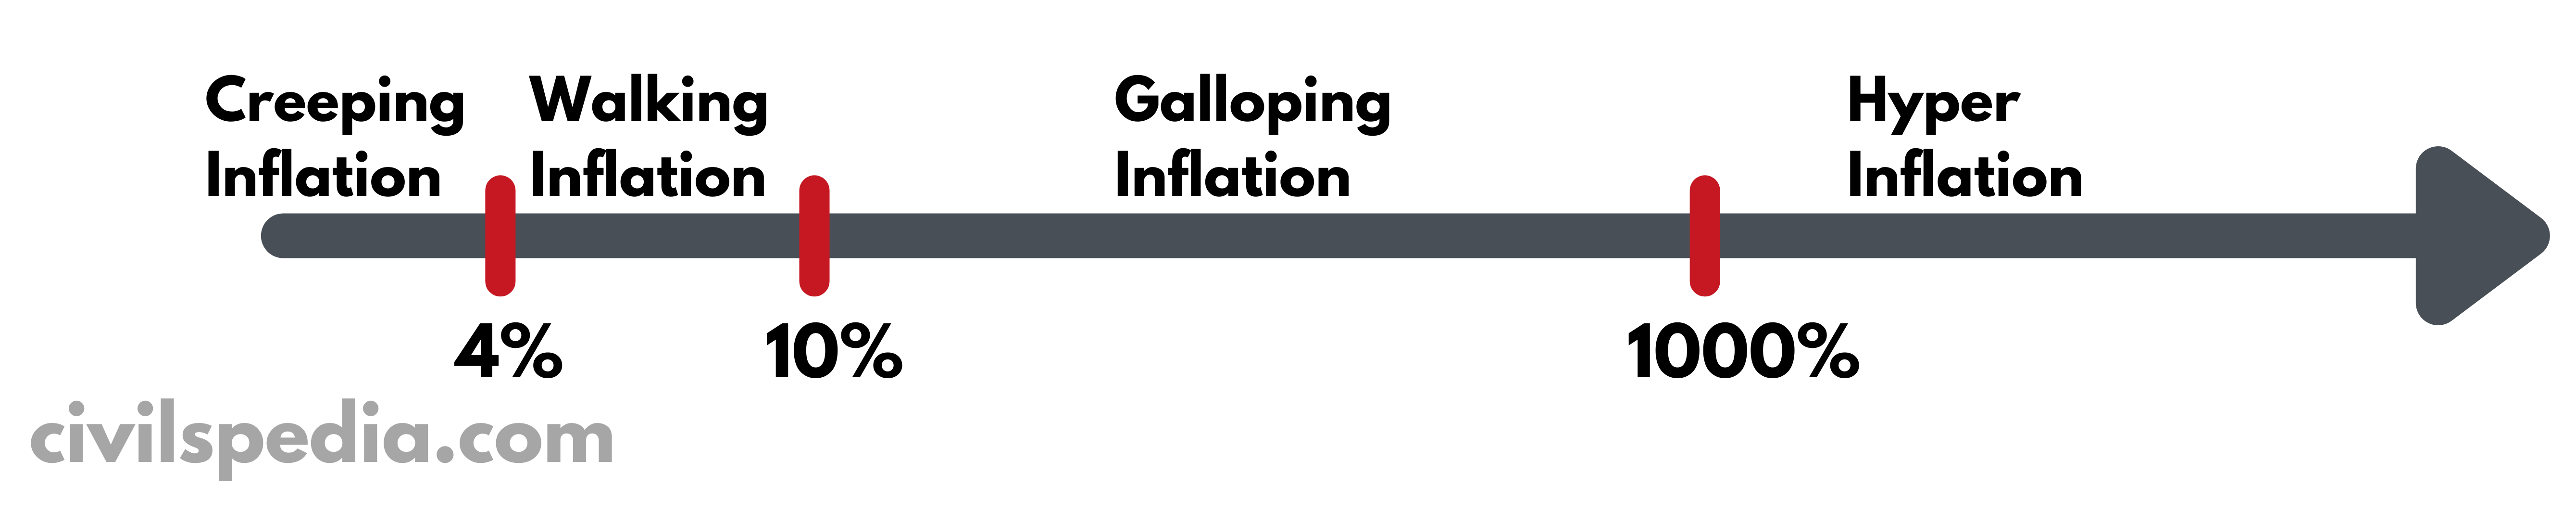
Types of Inflation based on speed
1. Creeping Inflation
Inflation of up to 4% (for the Indian economy).
It is regarded as safe and essential for job creation and economic growth.
2 . Walking
Inflation of more than 4% but limited to single-digit only.
3 . Galloping Inflation
Very high inflation in the range of double-digit or triple-digits.
Examples :
In the 1970s and 1980s, Latin American countries such as Argentina, Chile and Brazil faced Galloping Inflation in the range of 50 to 700 per cent.
After the disintegration of the ex-USSR in the early 1990s, the Russian economy faced such inflation.
4 . Hyperinflation Inflation
In Hyperinflation, annual inflation rates are in the million or even trillion. Prices of goods shoot up overnight.
Examples
Germany during Great Depression when Deutsche Mark became worthless.
In recent times, Zimbabwe and Venezuela faced Hyperinflation.
Some definitions
1. Deflation
Persistent fall in the level of prices of goods and services.
2. Disinflation
Reduction in rate of inflation.
3. Stagflation
Stagflation is the combination of inflation & unemployment due to recession.
Stagflation is the economic construct developed post the first oil shock of the early seventies when US inflation had soared to 11.5 per cent, even as the unemployment rate spiked to 9 per cent.
4. Reflation
Attempt to raise the price to counteract deflationary pressures.
5. Skewflation
Episodic price rises in one or a small group of commodities while inflation in the remaining goods and services remains the same.
E.g., the episodic rise in the price of onions, tomatoes, or pulses.
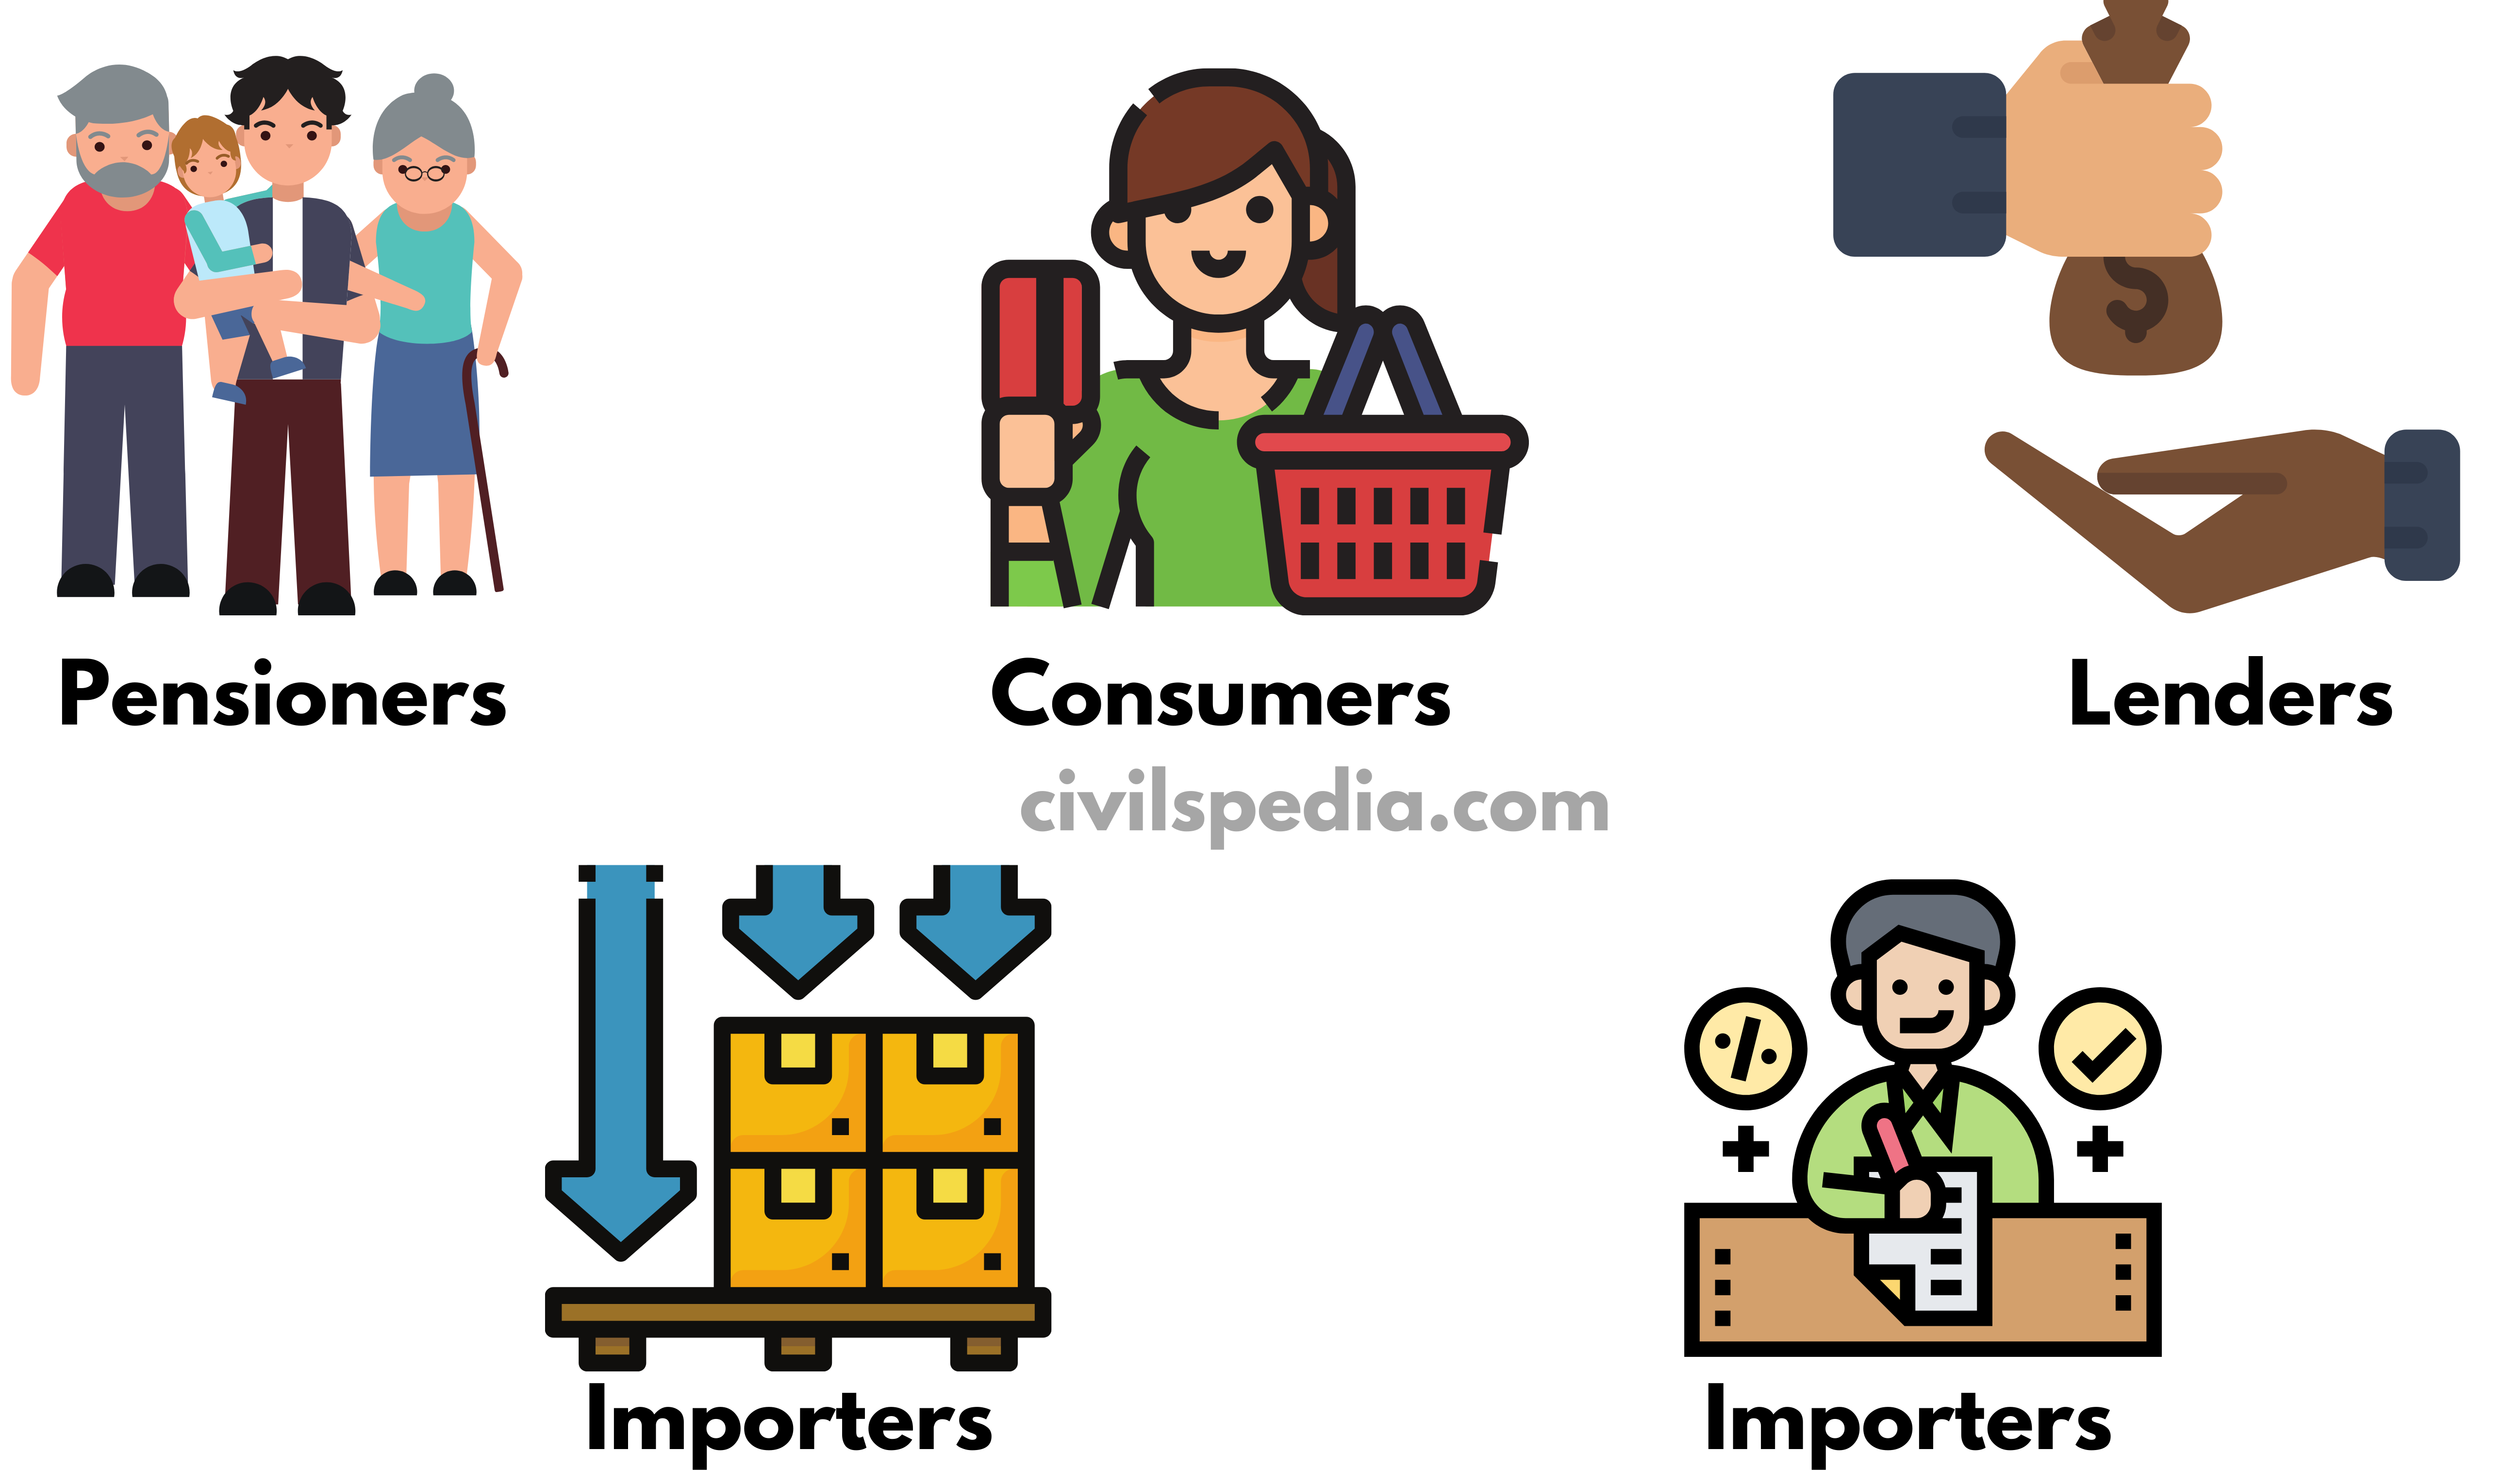
Impacts of Inflation
Inflation hurts the following groups
People on a fixed income, pensioners and bondholders suffer because their income remains fixed while money’s purchasing power is reduced due to inflation.
Consumers suffer because a price rise means more money being paid by consumers for what they buy.
Lenders suffer because the money they will get back will have less purchasing power. (Note – Inflation favours the Debtors over the Lenders).
Importers suffer because inflation leads to currency depreciation, increasing the cost of imports.
Taxpayers suffer as they have to pay more direct and indirect taxes. As indirect taxes are imposed ad valorem (on value), increased prices of goods make taxpayers pay increased indirect taxes. Similarly, the direct tax increases due to inflation as the taxpayer’s gross income moves to the upward slabs of tax brackets.
Additionally, Inflation has the following negative impacts
Reduction in overall demand: Due to a decrease in the purchasing power of people, the overall
demand in the economy decreases.
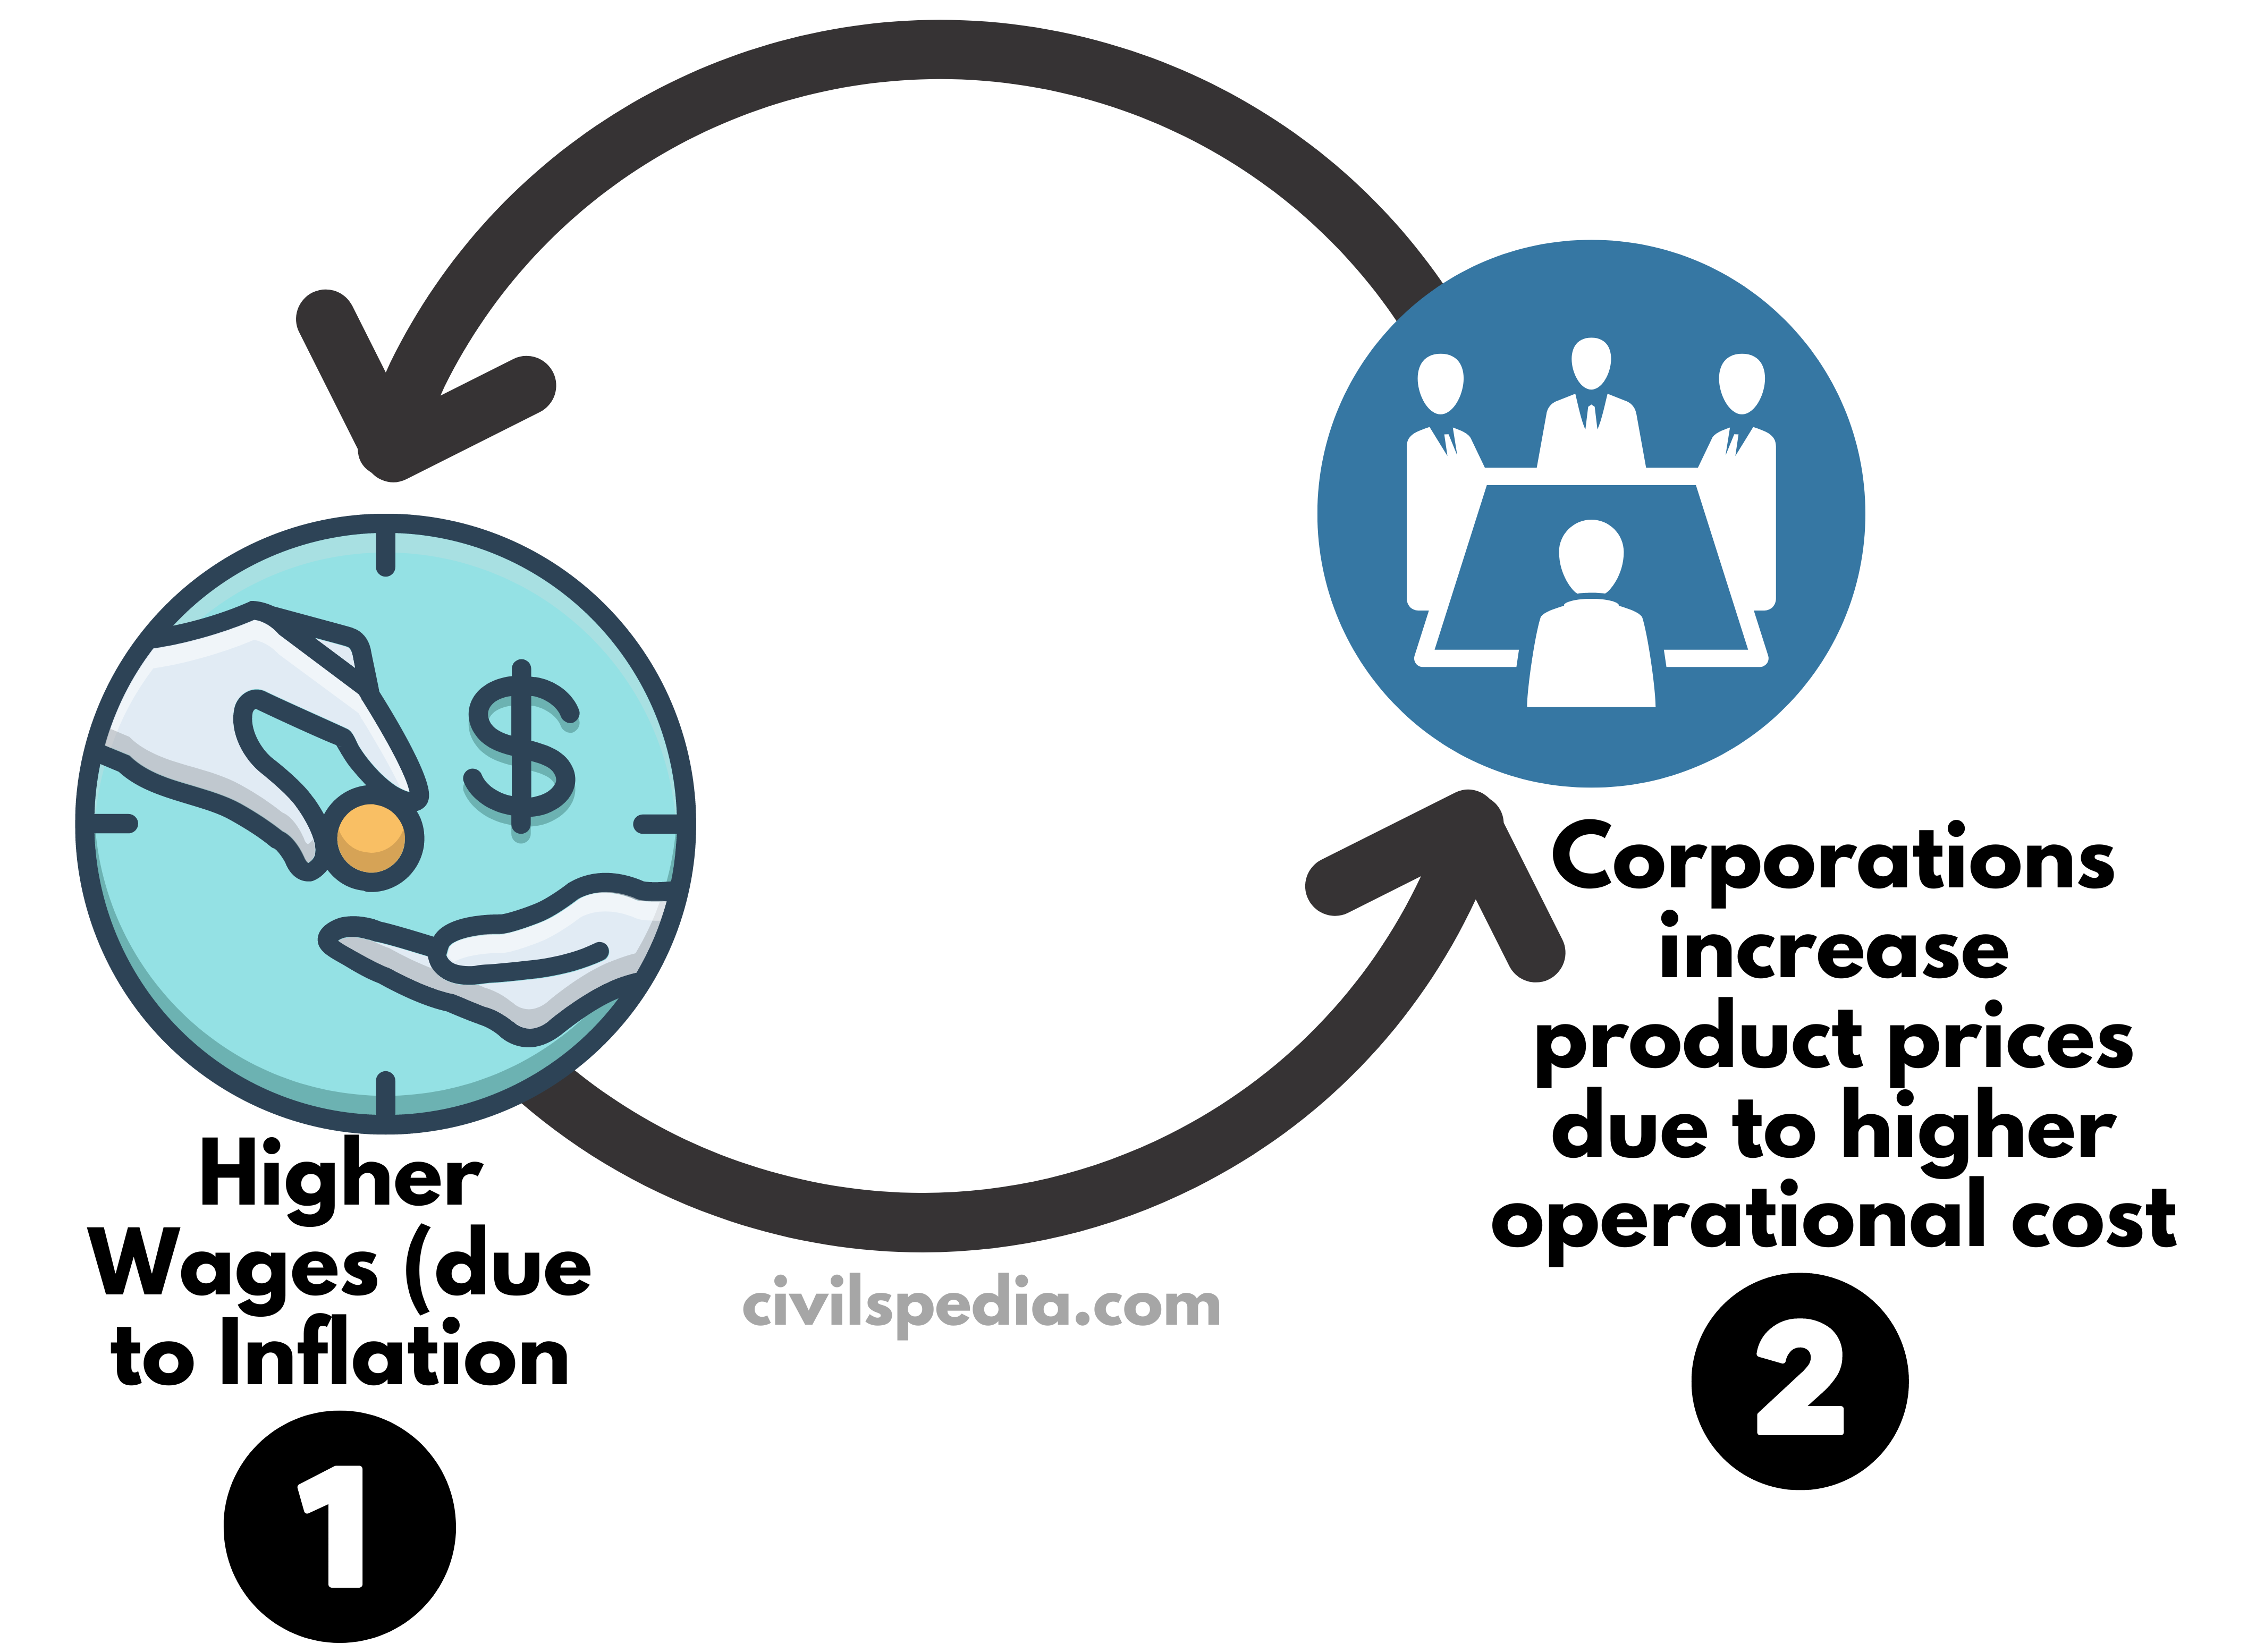
Wage-Inflation Spiral: Persistent inflation impacts the psychology of people who,
in turn, demand higher wages. It starts the Wage-Inflation spiral. The
companies further increase the price as the cost of their operations
increases due to higher wages.
Inflation benefits the following groups
Businessmen make huge profits because the final product price rises faster than the price of raw materials.
Borrowers benefit as they have to return the same money, but it has less purchasing power.
Government is the biggest beneficiary as it is the biggest borrower. Due to inflation, they have to pay back lesser in real terms.
Exporters benefit because the depreciation of currency leads to cheaper exports.
Is inflation good or bad?
Controlled inflation (between 2 to 6% for India) is desirable & good for the economy. This is because producers & traders make reasonable profits encouraging them to invest. But inflation above safe levels, i.e. 6% for India, hurt the economy negatively.
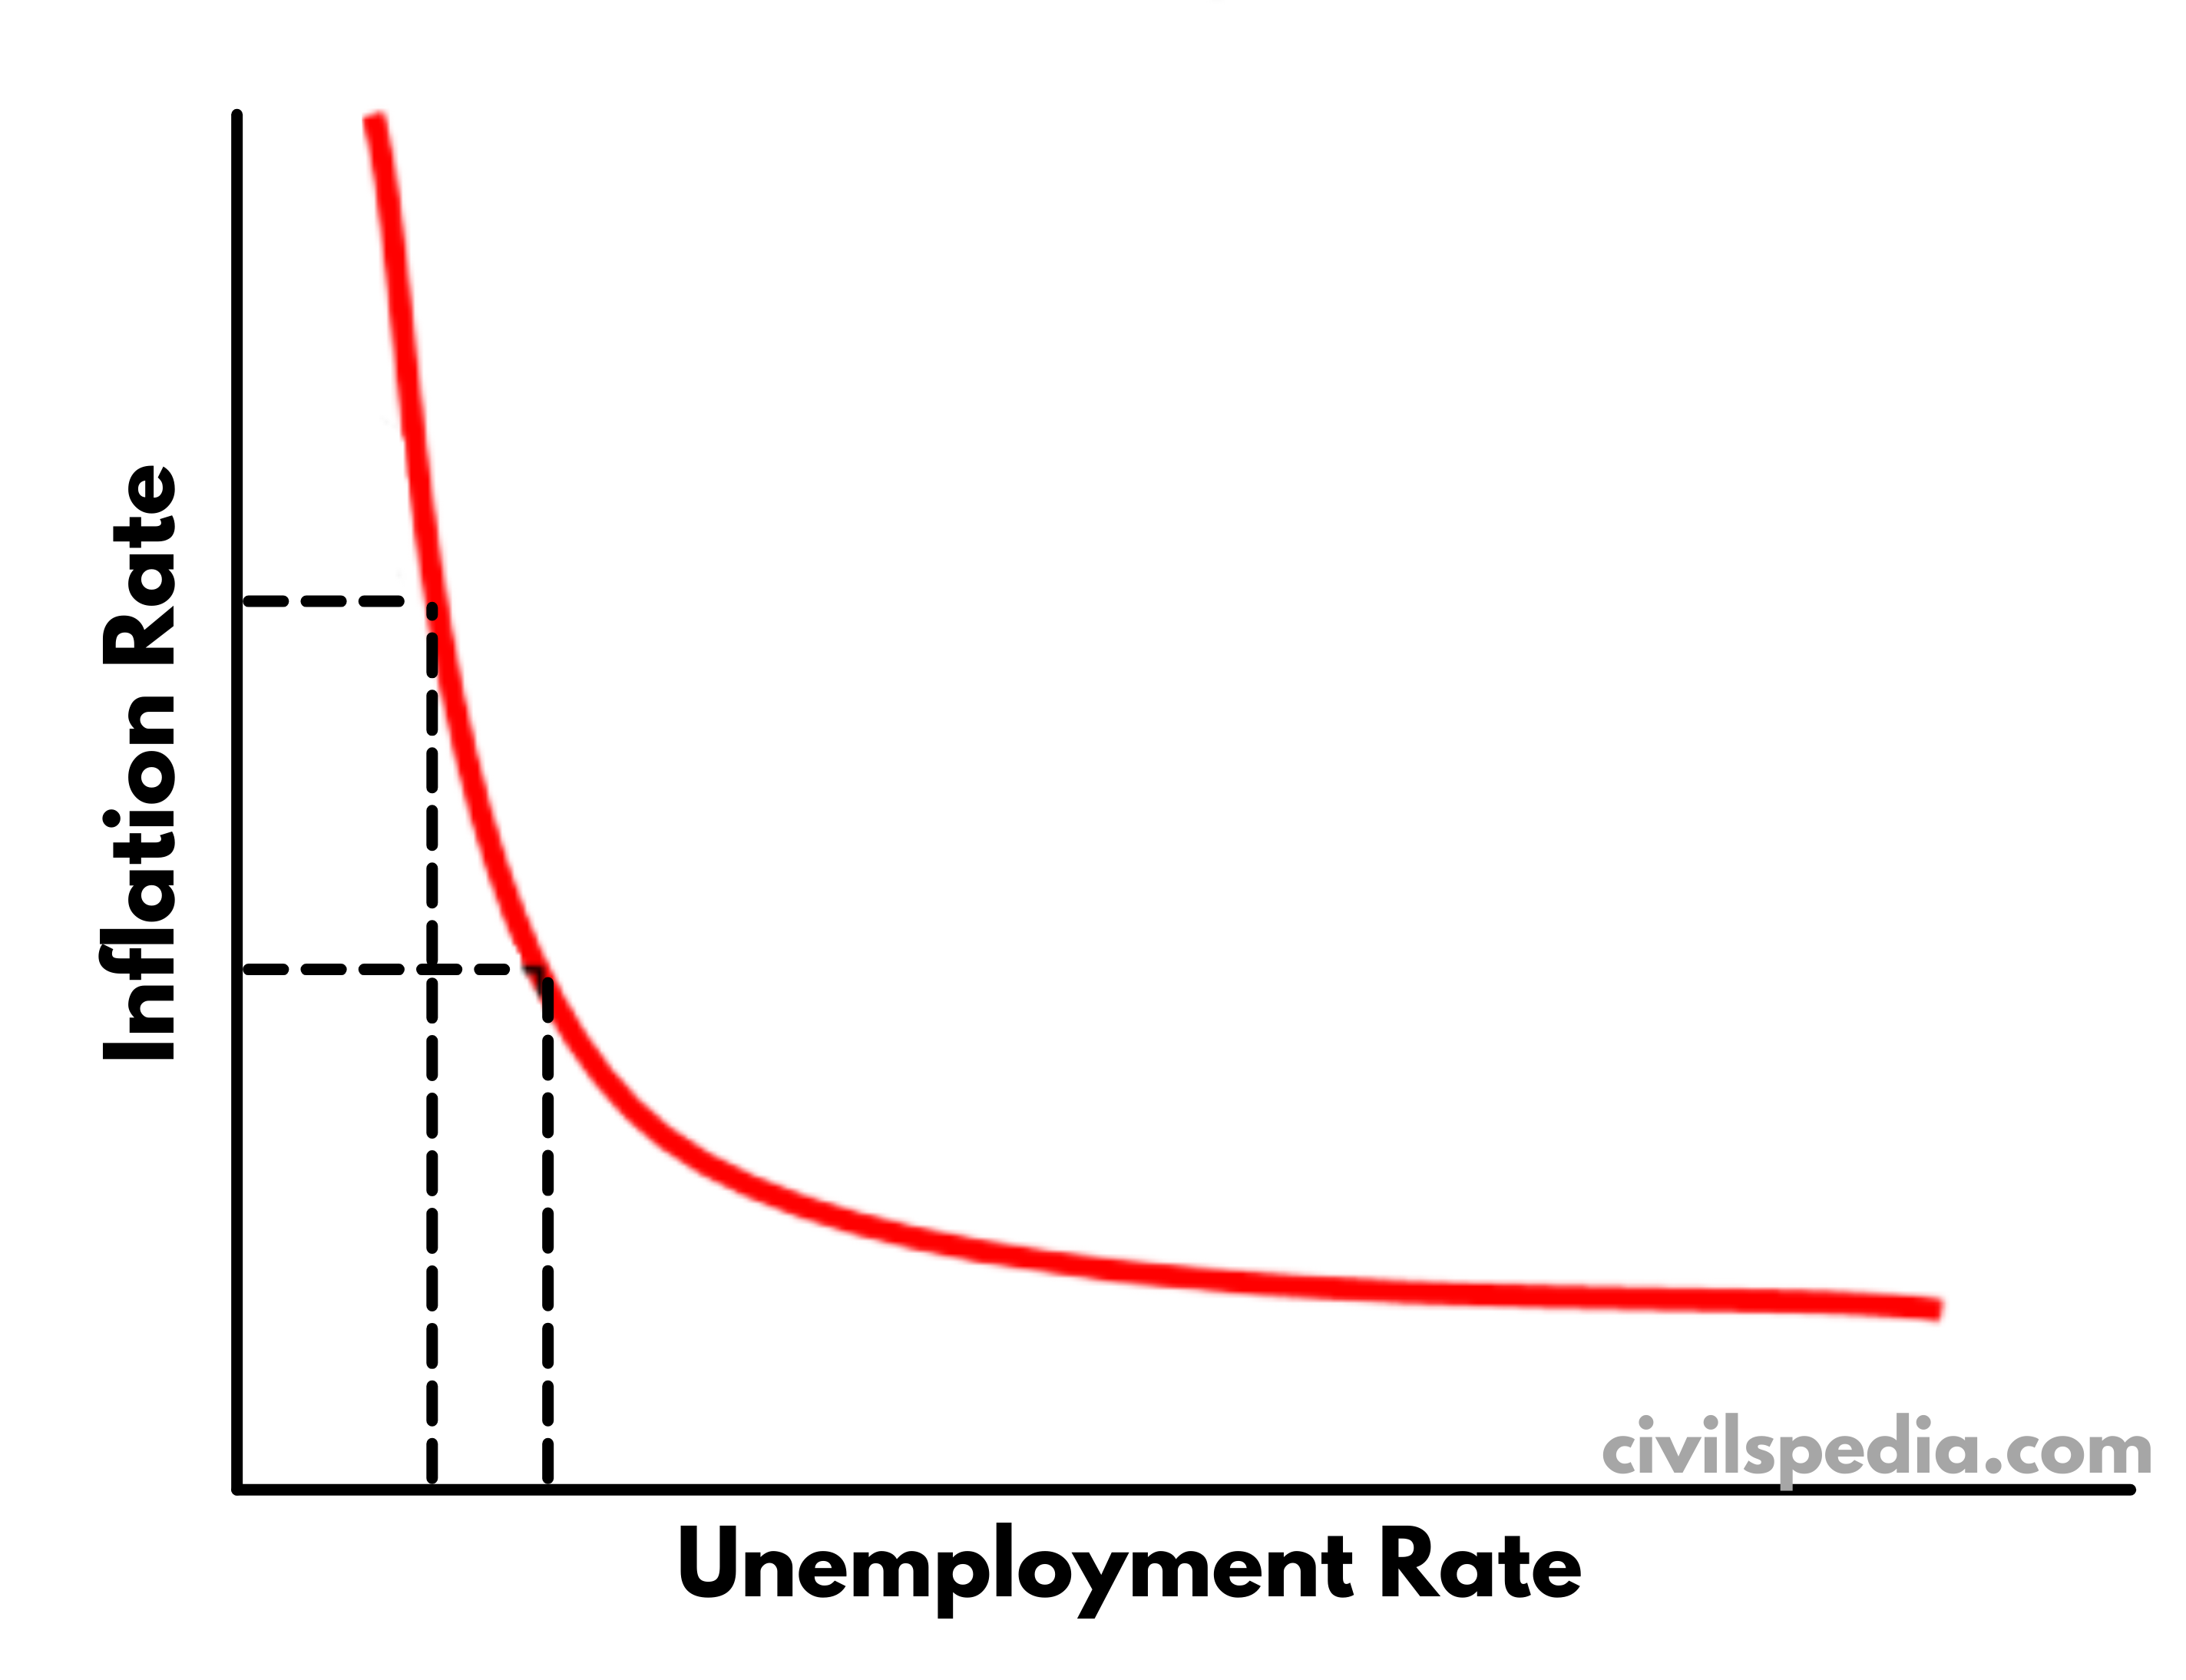
Philip’s Curve
It is a graphic curve showing a relationship between inflation and unemployment.
Economist William Philips said there is a ‘trade-off’ between inflation and unemployment.
When inflation increases correspondingly, unemployment decreases (because firms, enticed by higher prices, try to ramp up production by recruiting more people.)
When inflation decreases, unemployment increases.
This idea became popular in the early 1960s when economists started to argue that unemployment could be checked forever at the cost of slightly higher inflation. Central Banks around the world began to make monetary policies accordingly.
But in the 1970s, this idea was challenged because countries that followed the above policies suffered high inflation as well as unemployment in the long run. American economists Milton Friedman and Edmund Phelps argued that the trade-off between inflation and unemployment was only short-term. Once people expect higher inflation, they start to demand higher wages, and thus unemployment will rise back to its ‘natural rate’.
Index Theory
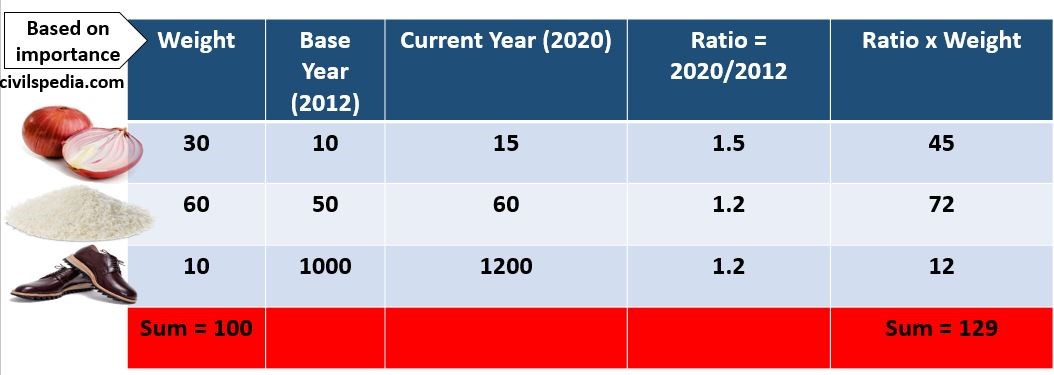
Inflation means a general rise in the price of goods and services. But rise against what? There should be some Base Year for that against which increases in prices of goods and services are measured.
The relative importance of all the goods and services is not the same. We cant equate rice and onion with shoes. Shoes are bought occasionally, but eatables are bought frequently, and their price rise hurts more. Hence, weight has to be assigned to all goods and services according to their relative importance.
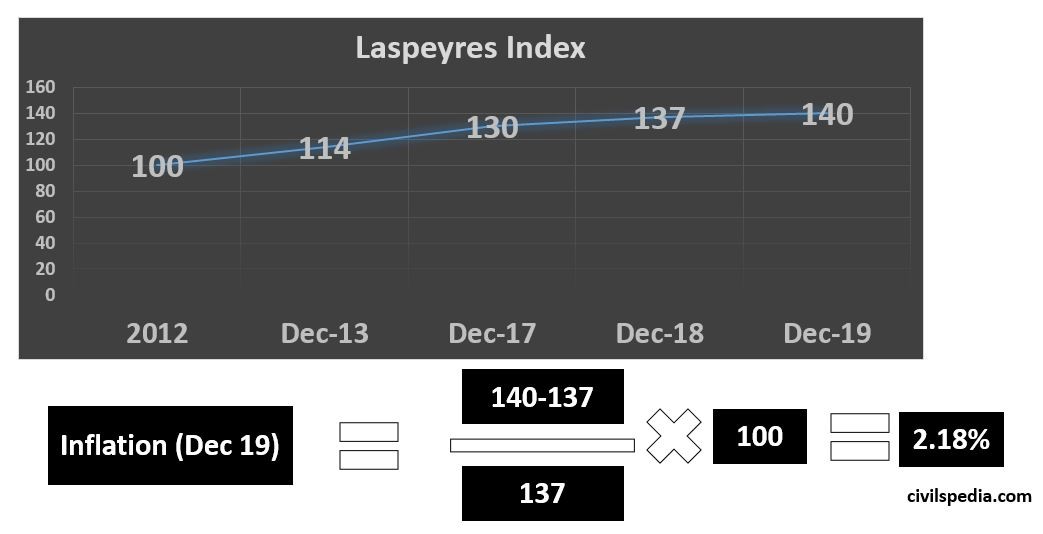
Hence, the Laspeyres formula is used to calculate WPI, CPI and IIP index, which is a weighted arithmetic mean of a basket of commodities that tracks price/production level against the base year.
The inflation rate is calculated using a change in Laspeyres Index in a particular month of the year compared to that of the same month of the previous year.
Base Years
Base Years
for different Indexes are different
Base Year
Who
CPI
2012
NSO
(under MoSPI)
WPI
2011
Economic
Advisor, DPIIT
IIP
2011
NSO
Side
Note: GDP
2011
NSO
Index 1: Consumer Price Index (CPI)
CPI measures inflation using the weighted average of prices of a basket of consumer goods and services, such as transportation, food, and medical care.
There are different types of CPIs released by various agencies, as given below.
Released by
Base Year
CPI (1) Rural 2) Urban 3) All India)
NSO
2012
Consumer Food Price Index (CFPI)
NSO
2012
CPI (Industrial Worker)
Labour Ministry
2016
CPI (Agricultural Labourer)
Labour Ministry
1986
CPI (Rural Labourer)
Labour Ministry
1986
CPI (All India)
CPI (All India) is released by NSO with the base year of 2012.
It is the headline CPI inflation of India.
Monetary Policy Committee uses CPI (All India) under its Inflation Targeting Mechanism.
CPI (Rural) and CPI (Urban)
Since the basket of goods used by people living in rural and urban areas differ, NSO also releases CPI (Rural) and CPI (Urban) to show the inflation in these areas separately.
These are also released by NSO, with 2012 as the base year. But, weightage assigned to different goods varies in accordance with the relative importance of goods used in these areas.
Basket of Goods and Weightage assigned
Component
CPI (All India) weight
CPI (Rural) weight
CPI (Urban) weight
Food and beverages
45.86
34.18
36.29
Pan, tobacco and intoxicants
2.35
3.26
1.36
Clothing and Footwear
6.53
7.36
5.57
Housing
10.07
—-
21.67
Fuel and Light
6.84
7.94
5.50
Miscellaneous
28.32
27.26
29.53
Total
100
100
100
Consumer Food Price Index (CFPI)
If only the Food Component is seen, we get Consumer Food Price Index (CFPI).
Core Inflation
CPI minus Food and Fuel component is called Core Inflation.
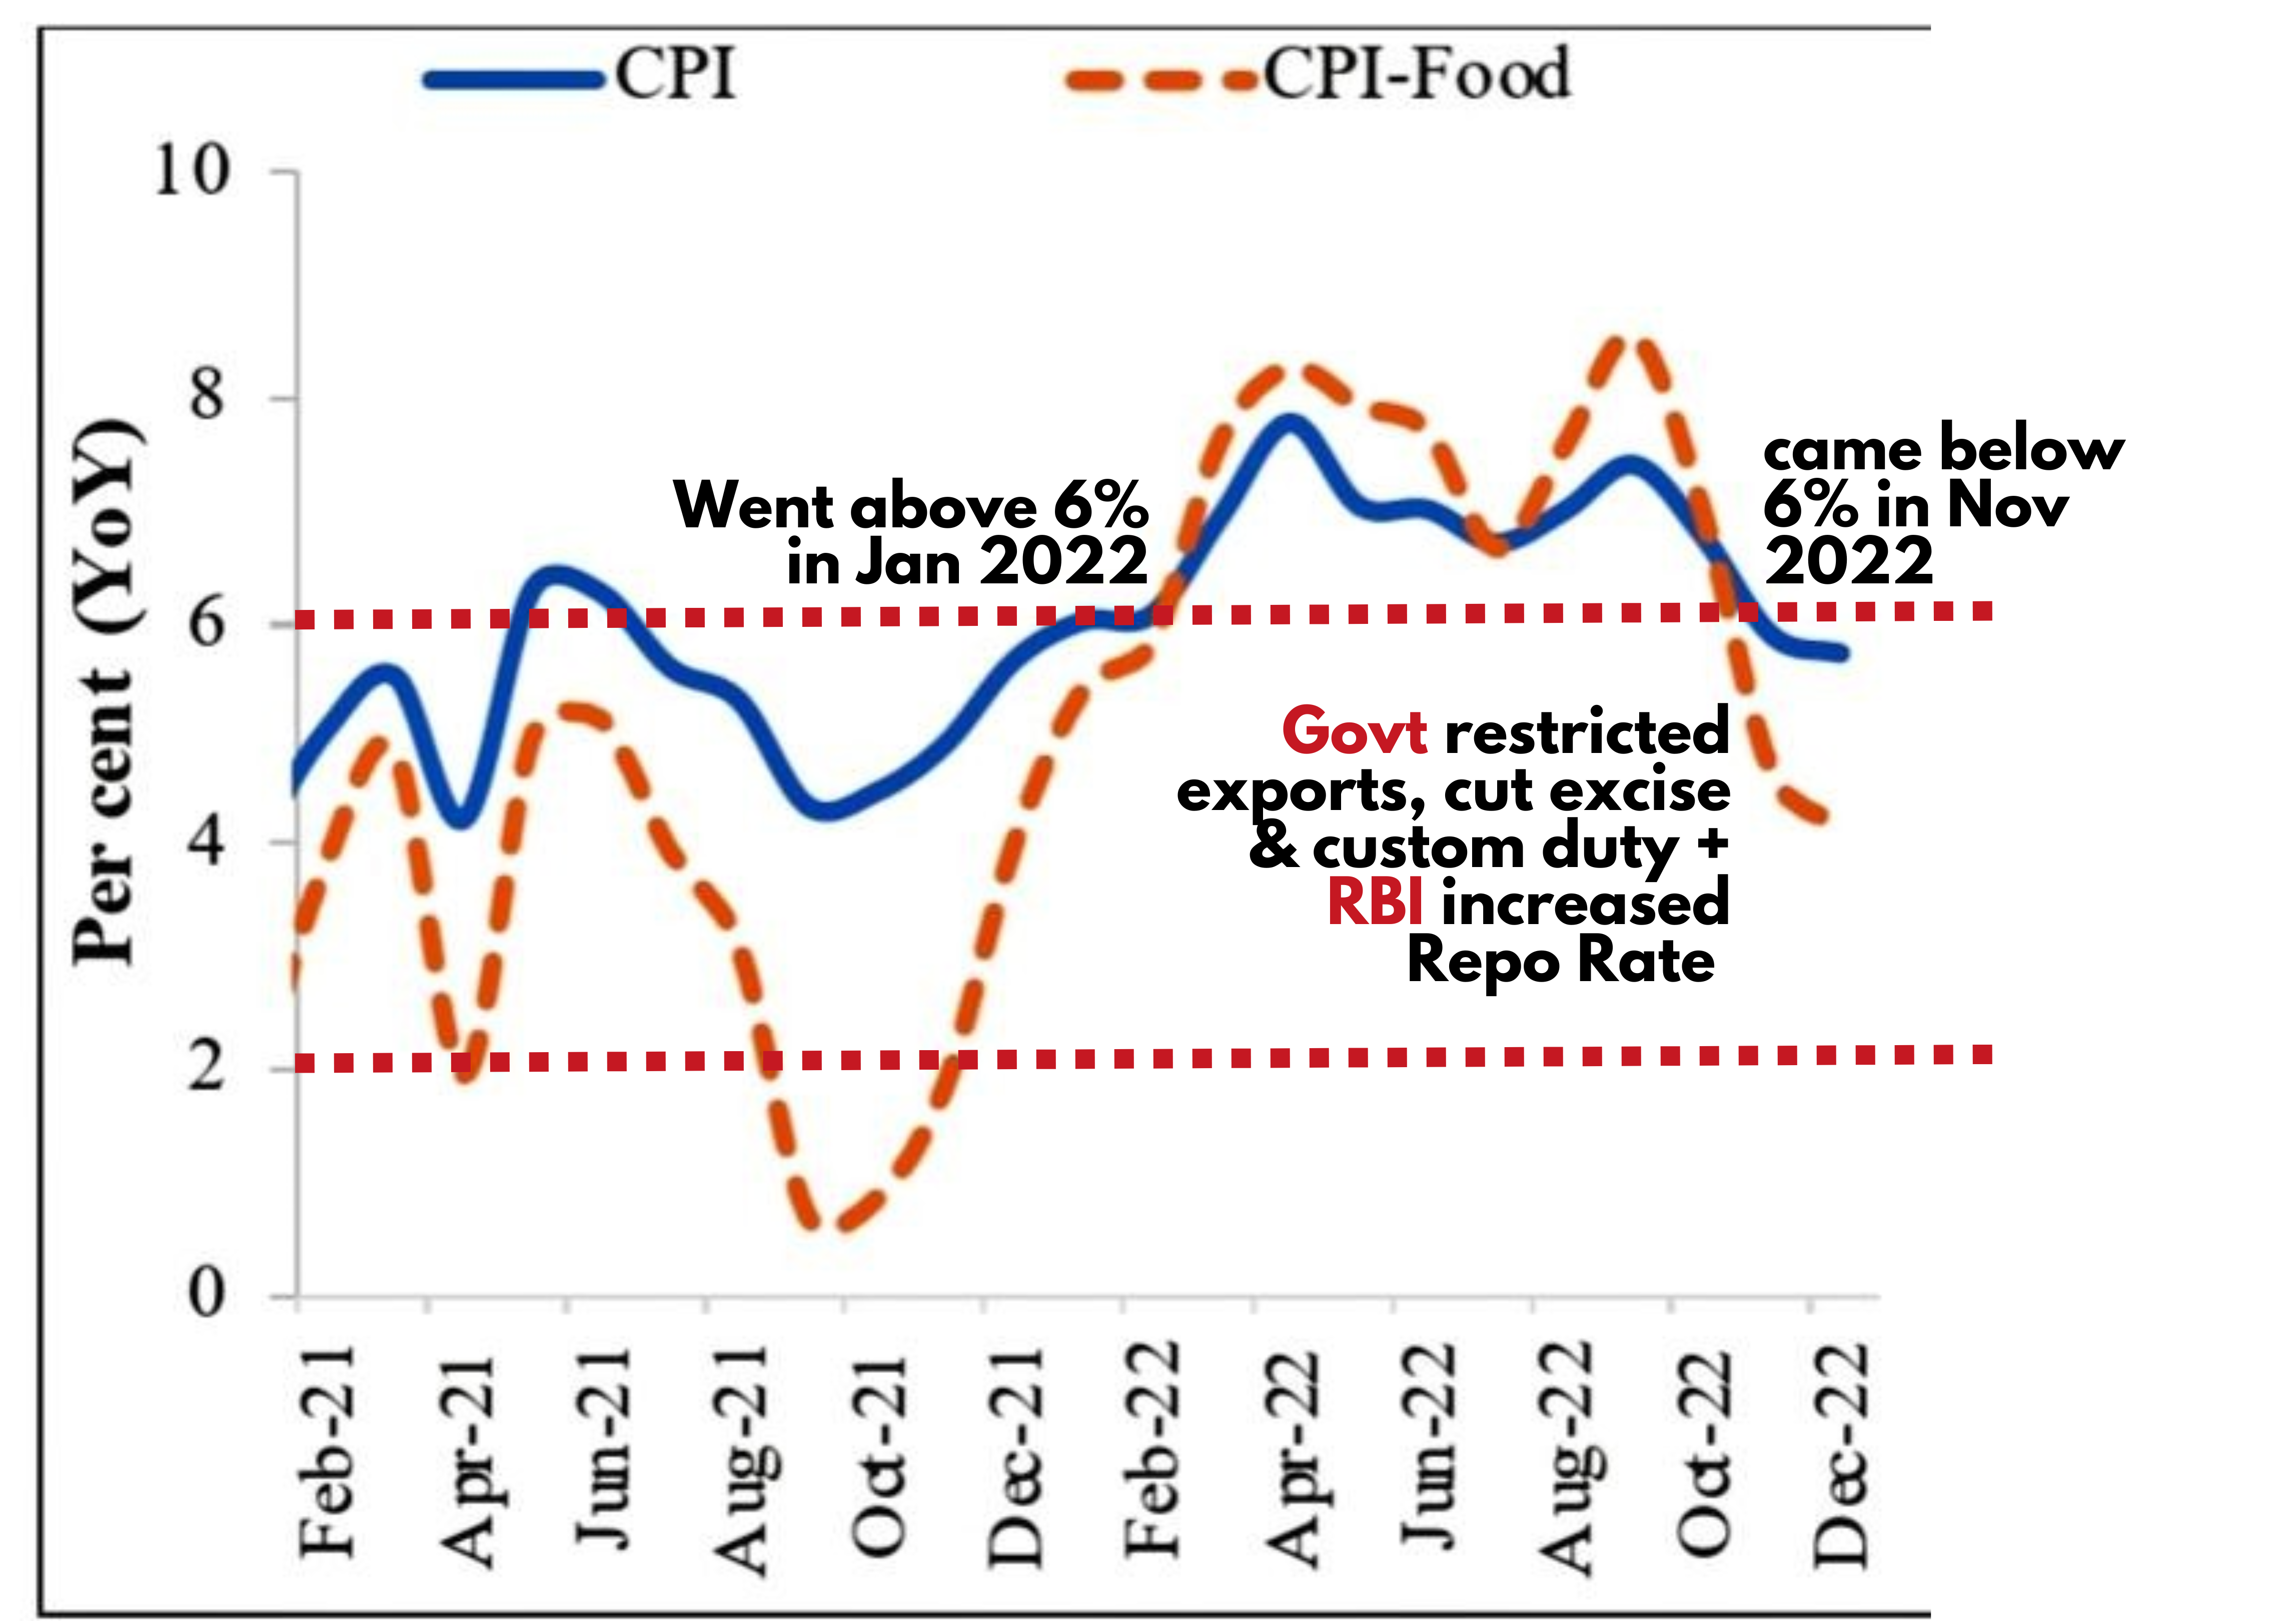
Trends in CPI in recent times
CPI Old Indexes
1 . CPI-IW
It is Consumer Price Index for Industrial Workers.
It is compiled by the Ministry of Labour.
The base year of CPI (IW) is 2016.
The basket of goods includes 370 goods.
Use: It is used as the cost of living index in the organized sector. Dearness Allowance (DA) is calculated using this.
2 . CPI-AL
It is Consumer Price Index for Agricultural Labourers.
It is compiled by the Ministry of Labour.
The base year of CPI (AL) is 1986 (the plan is to change it to 2019).
The basket of goods includes 60 goods.
Use: MNREGA wages are indexed to this.
3 . CPI – RL
It is Consumer Price Index for Rural labourers.
It is compiled by the Ministry of Labour.
The base year of CPI (AL) is 1986 (the plan is to change it to 2019).
Side Topic: Price Stabilization Fund
The government started the Price Stabilization Fund with a corpus of ₹500 Crore in 2015 to fight Food Inflation.
Under this, Union gives interest-free advances to states to buy onion, potatoes, pulses etc., from farmers and maintain their supply in urban areas to stabilize prices.
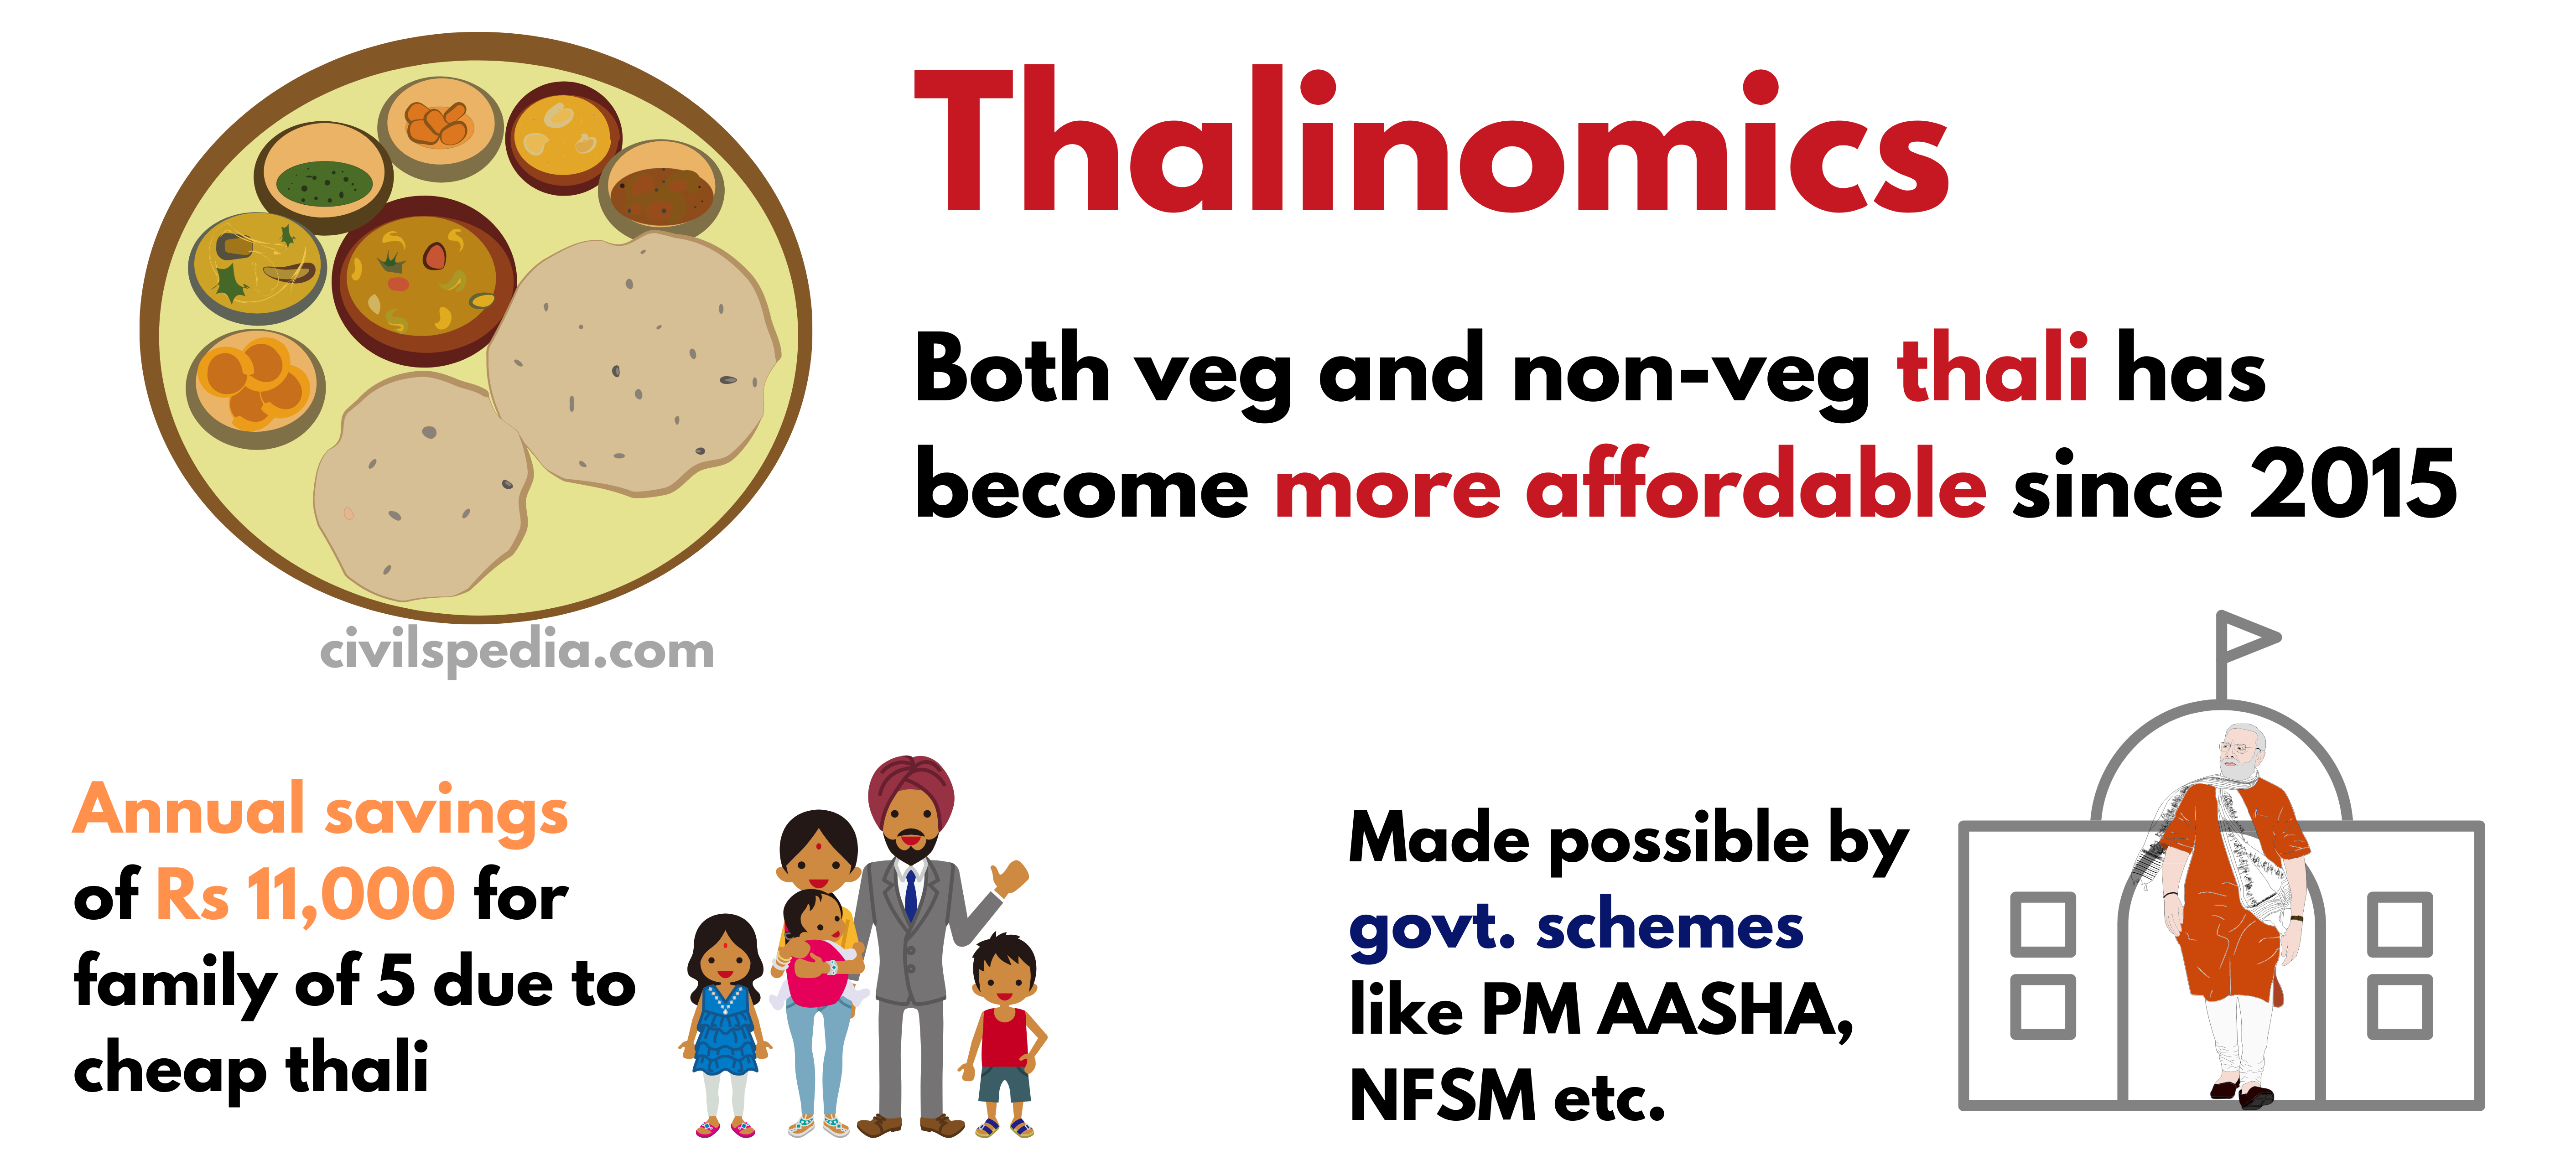
Thalinomics: Economics of a plate of food in India
Thalinomics refers to the economics of a plate of food in India.
According to Economic Survey (2020), the price of Thali has reduced across all regions for both vegetarian and non-vegetarian thalis from 2015 to 2018. Hence, Thali’s affordability has increased for low-income families. The average yearly gain to the household of 5 individuals due to reduced prices is around Rs. 11,000.
The affordability of Thalis vis-à-vis a day’s worker’s pay has improved over time, indicating improved welfare of the ordinary person.
The decrease in the price is due to various reform measures taken in 2015 and afterwards, such as Pradhan Mantri Annadata Aay SanraksHan Abhiyan (PM-AASHA), Pradhan Mantri Krishi Sinchai Yojana (PMKSY), Pradhan Mantri Fasal Bima Yojana (PMFBY), Soil Health Card, e-NAM, National Food Security Mission (NFSM) and National Food Security Act (NFSA).
Index 2: Wholesale Price Index
The wholesale Price Index (WPI) is the price of a representative basket of wholesale goods. It reflects changes in the average prices of goods at the wholesale level — commodities sold in bulk and traded between businesses or entities rather than goods bought by consumers.
It is released by Economic Advisor to the Department for Promotion of Industry and Internal Trade (DPIIT) under the Commerce Ministry.
In 2017, the Base year was changed to 2011 (earlier was 2004).
The basket of goods and the weight assigned to them while calculating WPI is as follows
Component
Weightage
Manufactured Products
64.23
Primary Articles
22.62
Fuel and Power
13.15
Earlier, indirect taxes were also counted in price while calculating the price. Other countries ignore indirect tax and transportation while measuring Producers Price Index (PPI). But in India, by including Indirect Taxes, we get inflation wrt wholesale buyers and not producers. In 2017, India fixed this anomaly, and now, while calculating WPI, the price without indirect tax is taken into consideration (although the Cost of Transportation is still there).
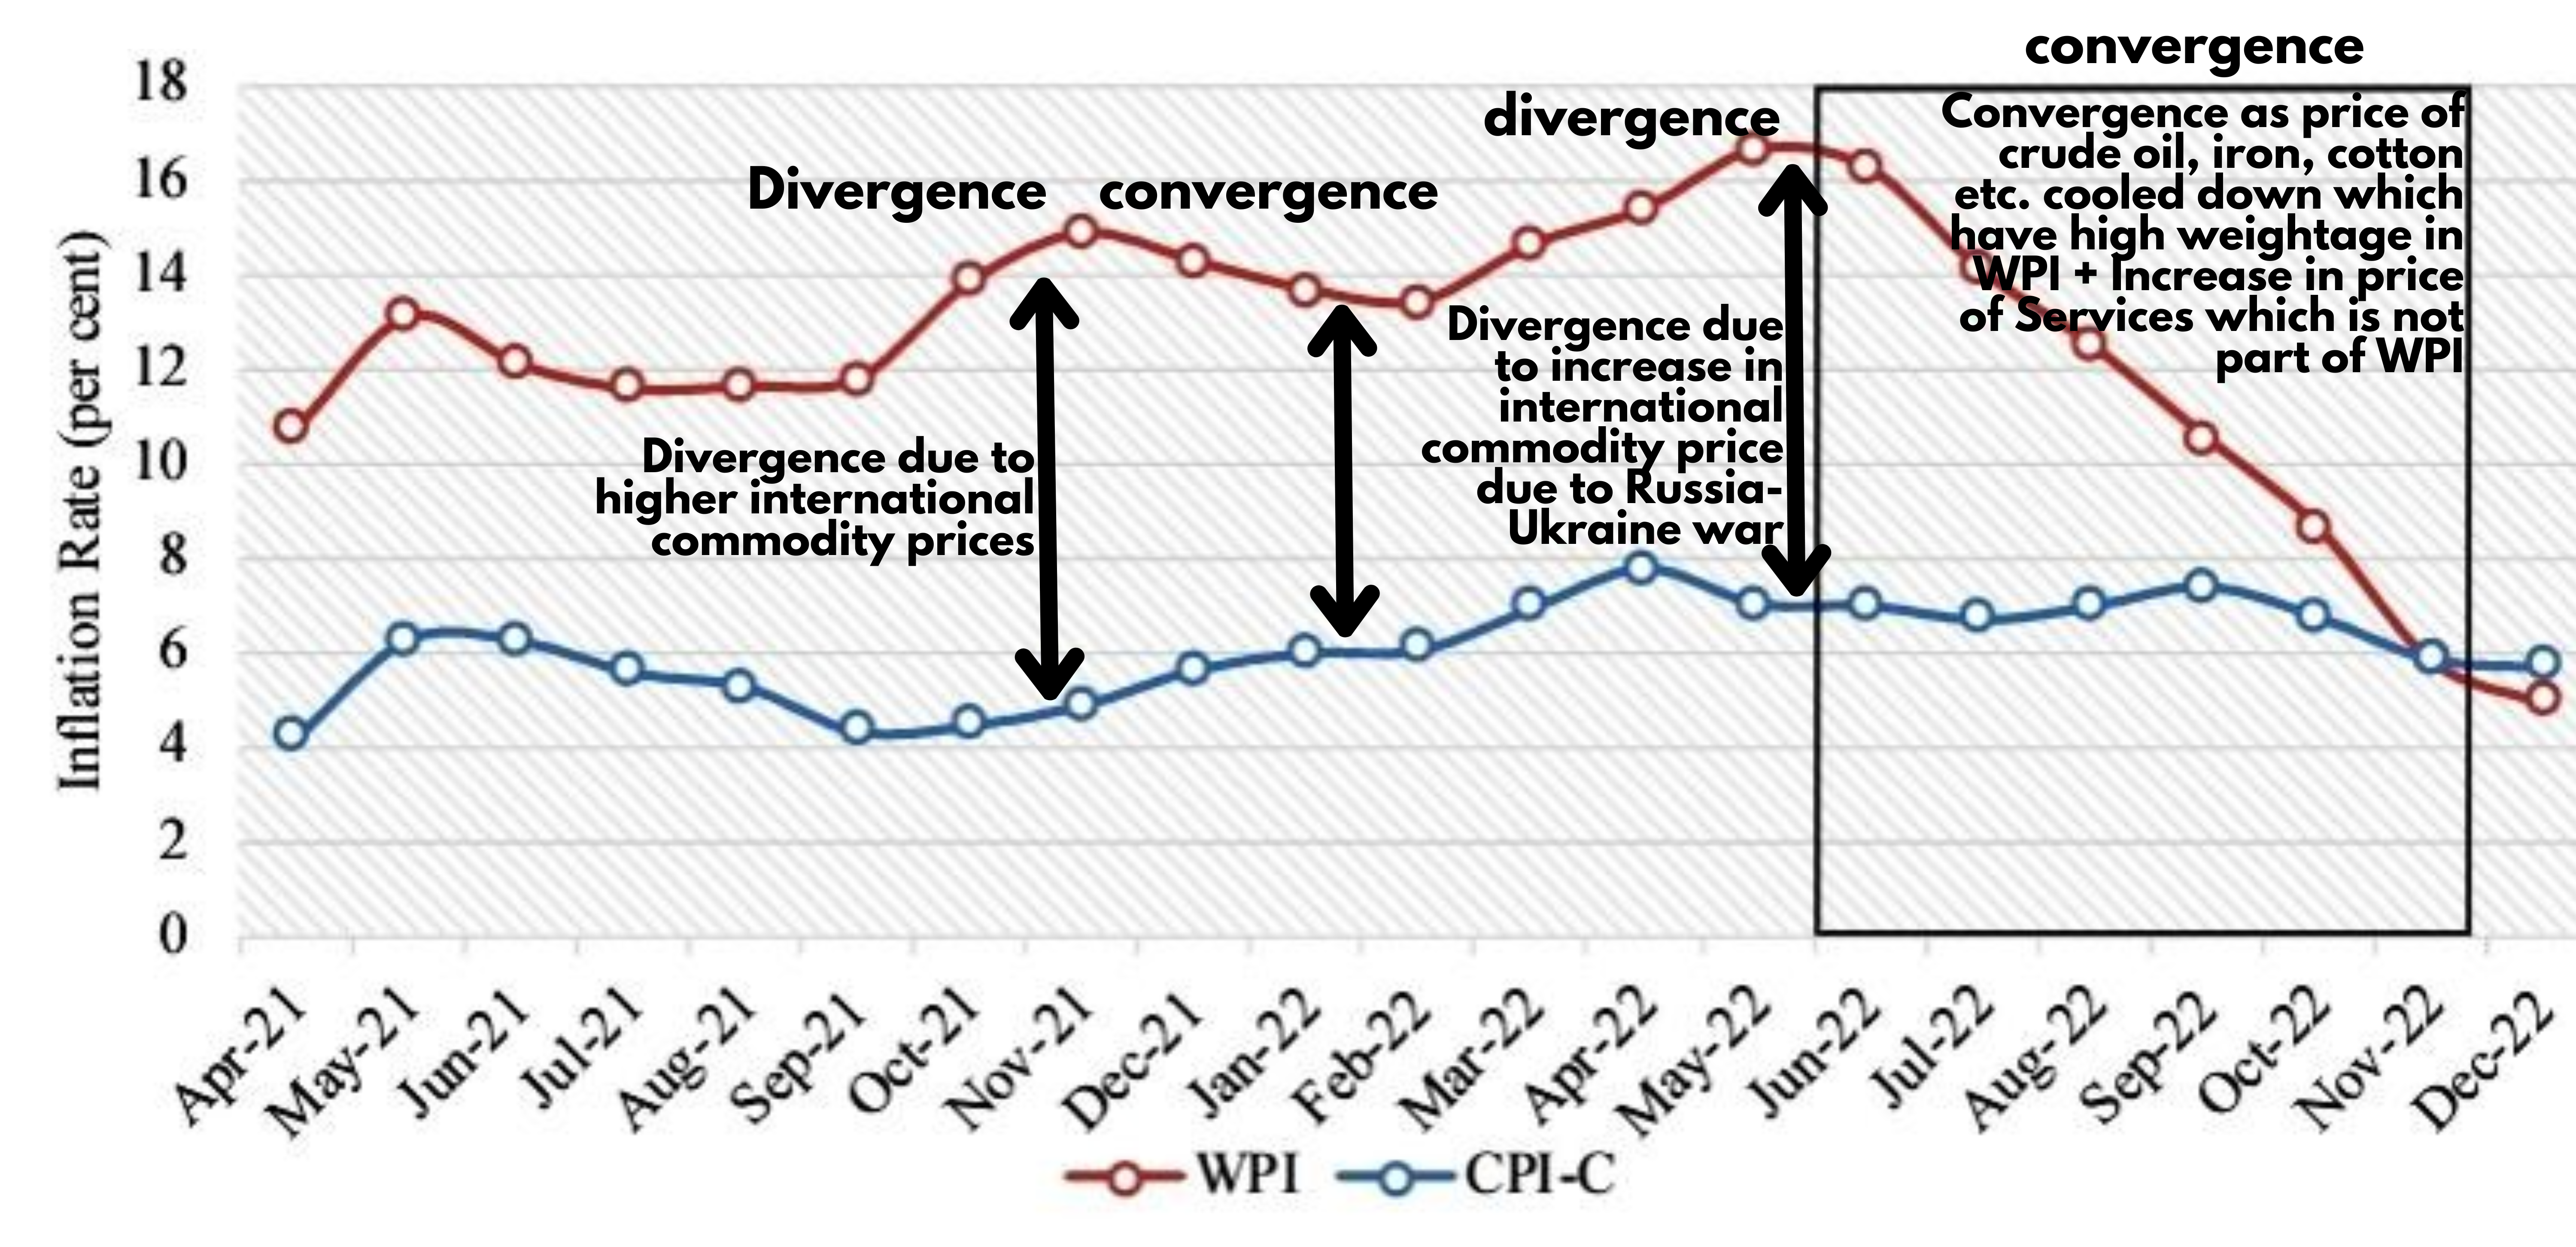
CPI-WPI Divergence and Convergence
It can happen due to the
following reasons
The changes in international prices pass on to Wholesale Prices (reflected in WPI) quickly but impact the retail prices (reflected in CPI) with a lag. Hence, there can be a wedge between both indices.
Secondly, the composition and weight assigned to different commodities differ in both indices.
Index 3: Index of Industrial Production (IIP)
IIP is a monthly index prepared by NSO that tracks manufacturing activity in different sectors of an economy.
Its Base Year is 2011.
Various components and the weight assigned to them are as follows
Manufacturing
78%
Mining
14%
Electricity
8%
Another way in which IIP is
categorised is USE BASED CATEGORISATION. Weightage given to different
categories in this is as follows
Primary goods
34.22%
Intermediate goods
17.22%
Capital goods
8.22%
Infrastructure
goods
12.34%
Consumer durables
12.84%
Consumer
nondurables
15.33%
Index of 8 Core Industries
Within IIP, 8 industries are considered core industries because
they impact all other economic activities.
Eight Core Industries comprise 40.27 % of the weight of items
included in the IIP.
It comprises eight industries as follows
Coal (weight: 10.33%)
Crude Oil (weight: 8.98 %)
Cement (weight: 5.37%)
Fertilizer (weight: 2.63 %)
Electricity (weight: 19.85%),
Refinery Products (weight: 28.04%)
Natural Gas (weight: 6.88 %)
Steel (weight: 17.92%)
Causes of Inflation in recent period
Global Spillover of Inflation: Advanced Economies followed expansionary monetary and fiscal policies during Covid to increase liquidity in the economy, leading to inflation in Advanced economies. In the globalized world, inflation has been exported to India as well.
Geopolitical Conflicts: The price of crude oil, natural gas and wheat has soared globally due to conflicts such as the Russia-Ukraine war.
Fed Tapering: To deal with the high inflation, the Central Bank of the USA and other advanced economies have started hiking the interest rates rapidly. This has led to the flow of capital from Emerging Economies to the US, strengthening the dollar. The strong dollar has made imports expensive, leading to inflation.
Vagaries of Weather: Unseasonal rains and excessive heat have impacted the yield of agricultural produce in India, leading to food inflation.
Pent-up Demand: The demand which was suppressed during Covid has rebounded with power increasing the price of goods and services. E.g., housing, travel and tourism etc.
Other Indexes
1. Producer Price Index
It measures the prices of goods and services as they are sold to the wholesaler by producers.
It is measured from the perspective of the producer, while WPI is measured from the perspective of the wholesaler.
It covers both goods and services. (WPI only covers goods)
It is a better indicator than CPI because CPI includes subsidies provided by the government. Hence, it doesn’t give a clear trajectory of prices of factors of production.
Abhijit Sen Committee has recommended the introduction of PPI in India.
2. Service Performance Indices
Any of the above indexes do not implicitly measure inflation of the service sector.
Chandrasekhar Committee suggested starting Service Performance Indices. As a result, the following indices have been started
Railways SPIs
Measures Inflation in freight and passenger services
Banking SPIs
Measures Inflation in services for which banks charge fees, commissions, brokerage, etc.
Postal SPIs
Measures Inflation in services provided by Department of Posts (private postal services are not taken in account)
Telecom SPIs
Inflation in cellular services on the basis of TRAI report.
3. Residex
Residex is released by the National Housing Bank (NHB).
It has 2017-18 as its base, and data is released on a quarterly basis.
It measures inflation in Housing prices in 26 cities.
4. Baltic Dry Index
Baltic Dry Index is released by London Stock Exchange.
It measures the cost of transporting raw materials by sea.
This article deals with ‘Income Inequalities.’ This is part of our series on ‘Economics’ which is an important pillar of the GS-2 syllabus. For more articles, you can click here.
Introduction
Income inequality is the degree to which income or wealth holding is unevenly distributed throughout the population.
It is measured statistically using Gini Coefficient.
Apart from that, Oxfam also releases a report every year showing the income inequality in the world and India.
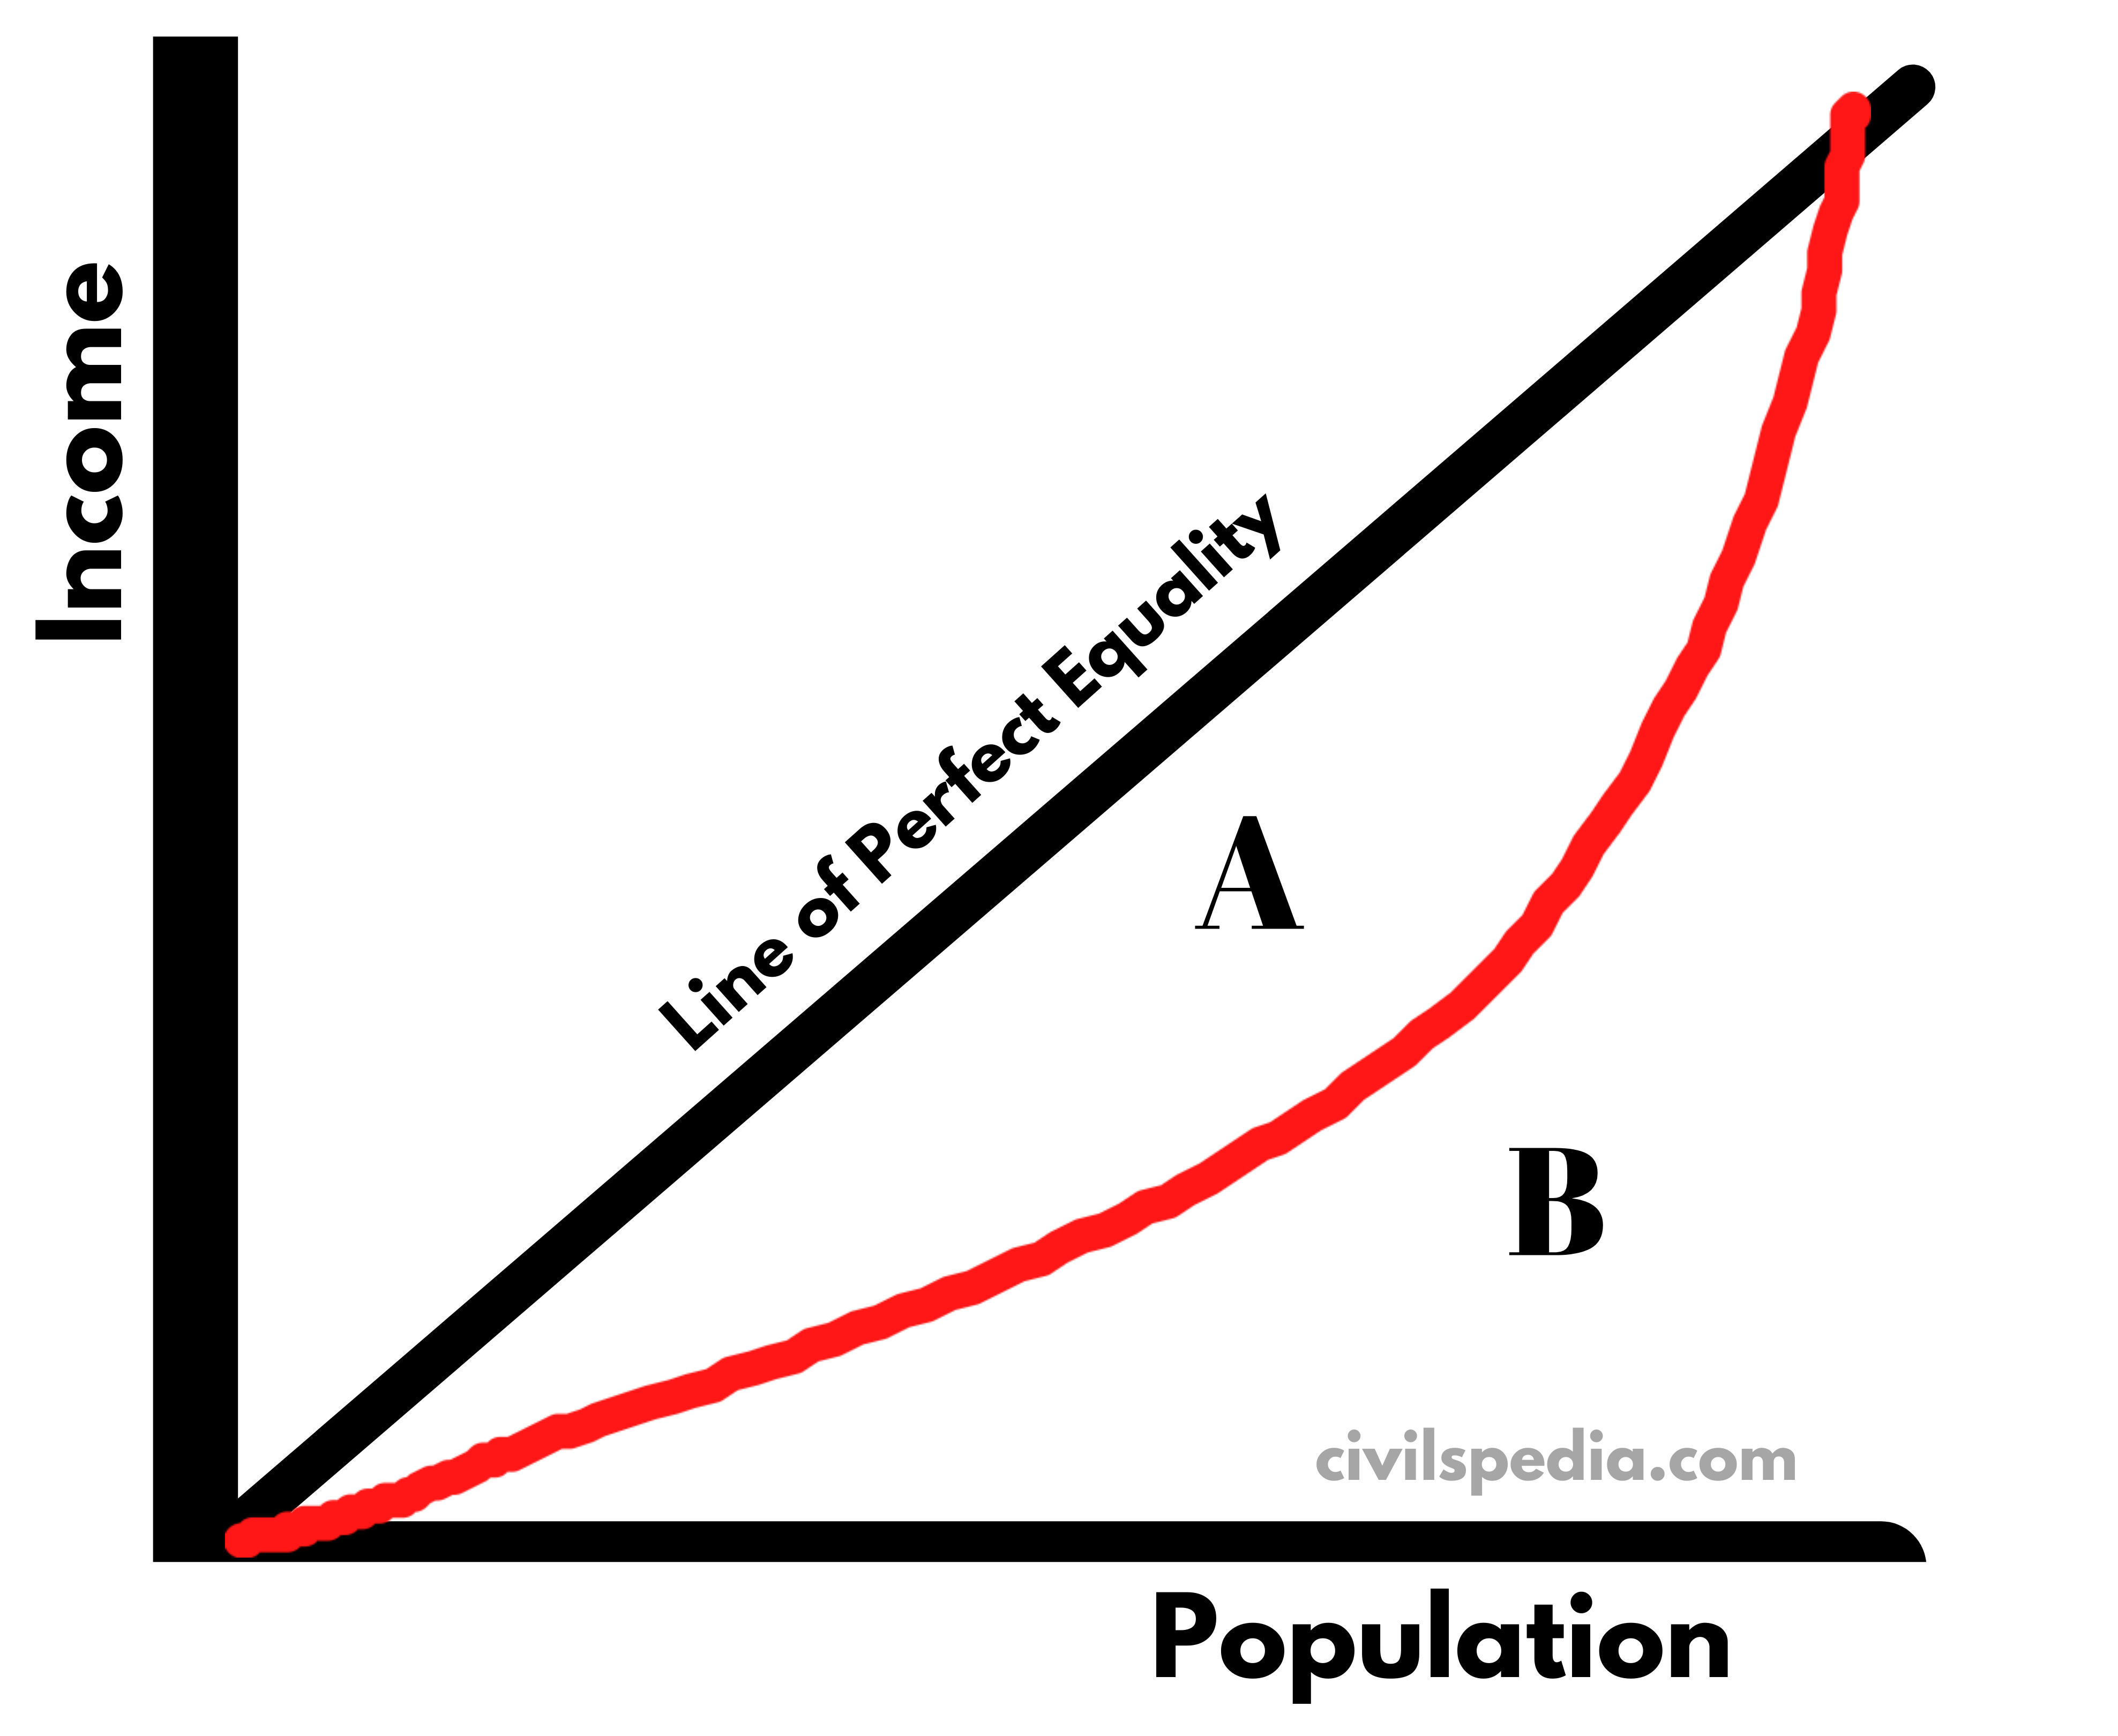
Gini Coefficient
Gini Coefficient is a statistical measure to gauge income inequality or wealth divide.
Its value varies between 0 to 1, 0 indicating perfect inequality and 1 indicating perfect equality.
An increase in value of the Gini Coefficient means that inequality in an economy is increasing, and government policies are not inclusive and benefitting richer.
Calculation of Gini Coefficient
Gini Coefficient = A / (A+B)
In the graph shown above
The horizontal axis on this chart represents cumulative shares of the population.
The vertical axis is cumulative shares of income.
A+ B is constant, and if
A is higher; inequality is higher.
A is smaller; inequality is lower.
If A = 0, then no income inequality.
Hence, Gini Coefficient is measured from 0 to 1, and the lower value means low inequality and higher means more inequality.
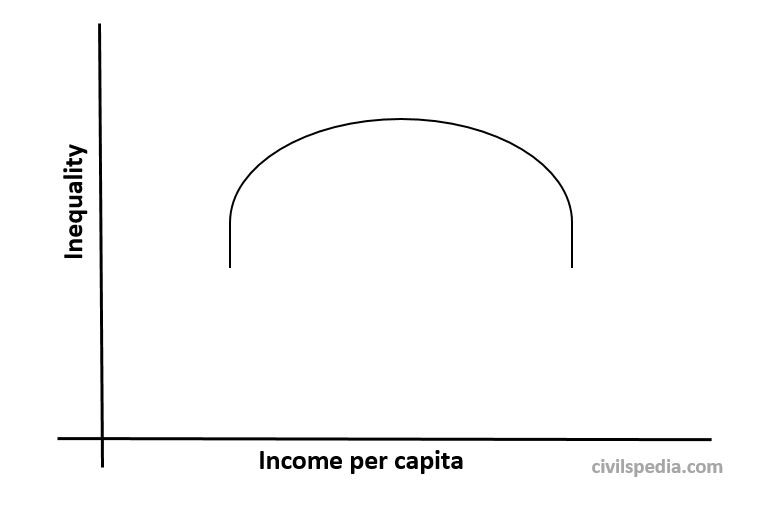
Famous US Economist Simon Kuznet showed that market forces would first increase inequality and then decrease inequality among people as an economy develops.
It happens because the initial phase of economic growth boosts the income of workers and investors who participate in the first wave of innovation. But this inequality is temporary as other workers and investors soon catch up, resulting in improvement of their incomes as well.
Palma Ratio
It is the ratio of the percentage of income earned by the richest 10% with the percentage of income earned by the poorest 40%.
For India, this ratio is approximately 1.5.
Quintile Ratio
It is the ratio of income of the richest 10% and poorest 10% in an economy.
In the case of India, the income of the richest 20% is 45% of total income, and the poorest 20% is 8% of total income. Hence, the Quintile Ratio of India is 5.6.
India and Income Inequality
Piketty, the world-famous economist, has cautioned India for rising levels of Income inequalities and their consequences. In countries like India, where other forms of inequalities are present, like the caste system, income inequalities exacerbate the situation.
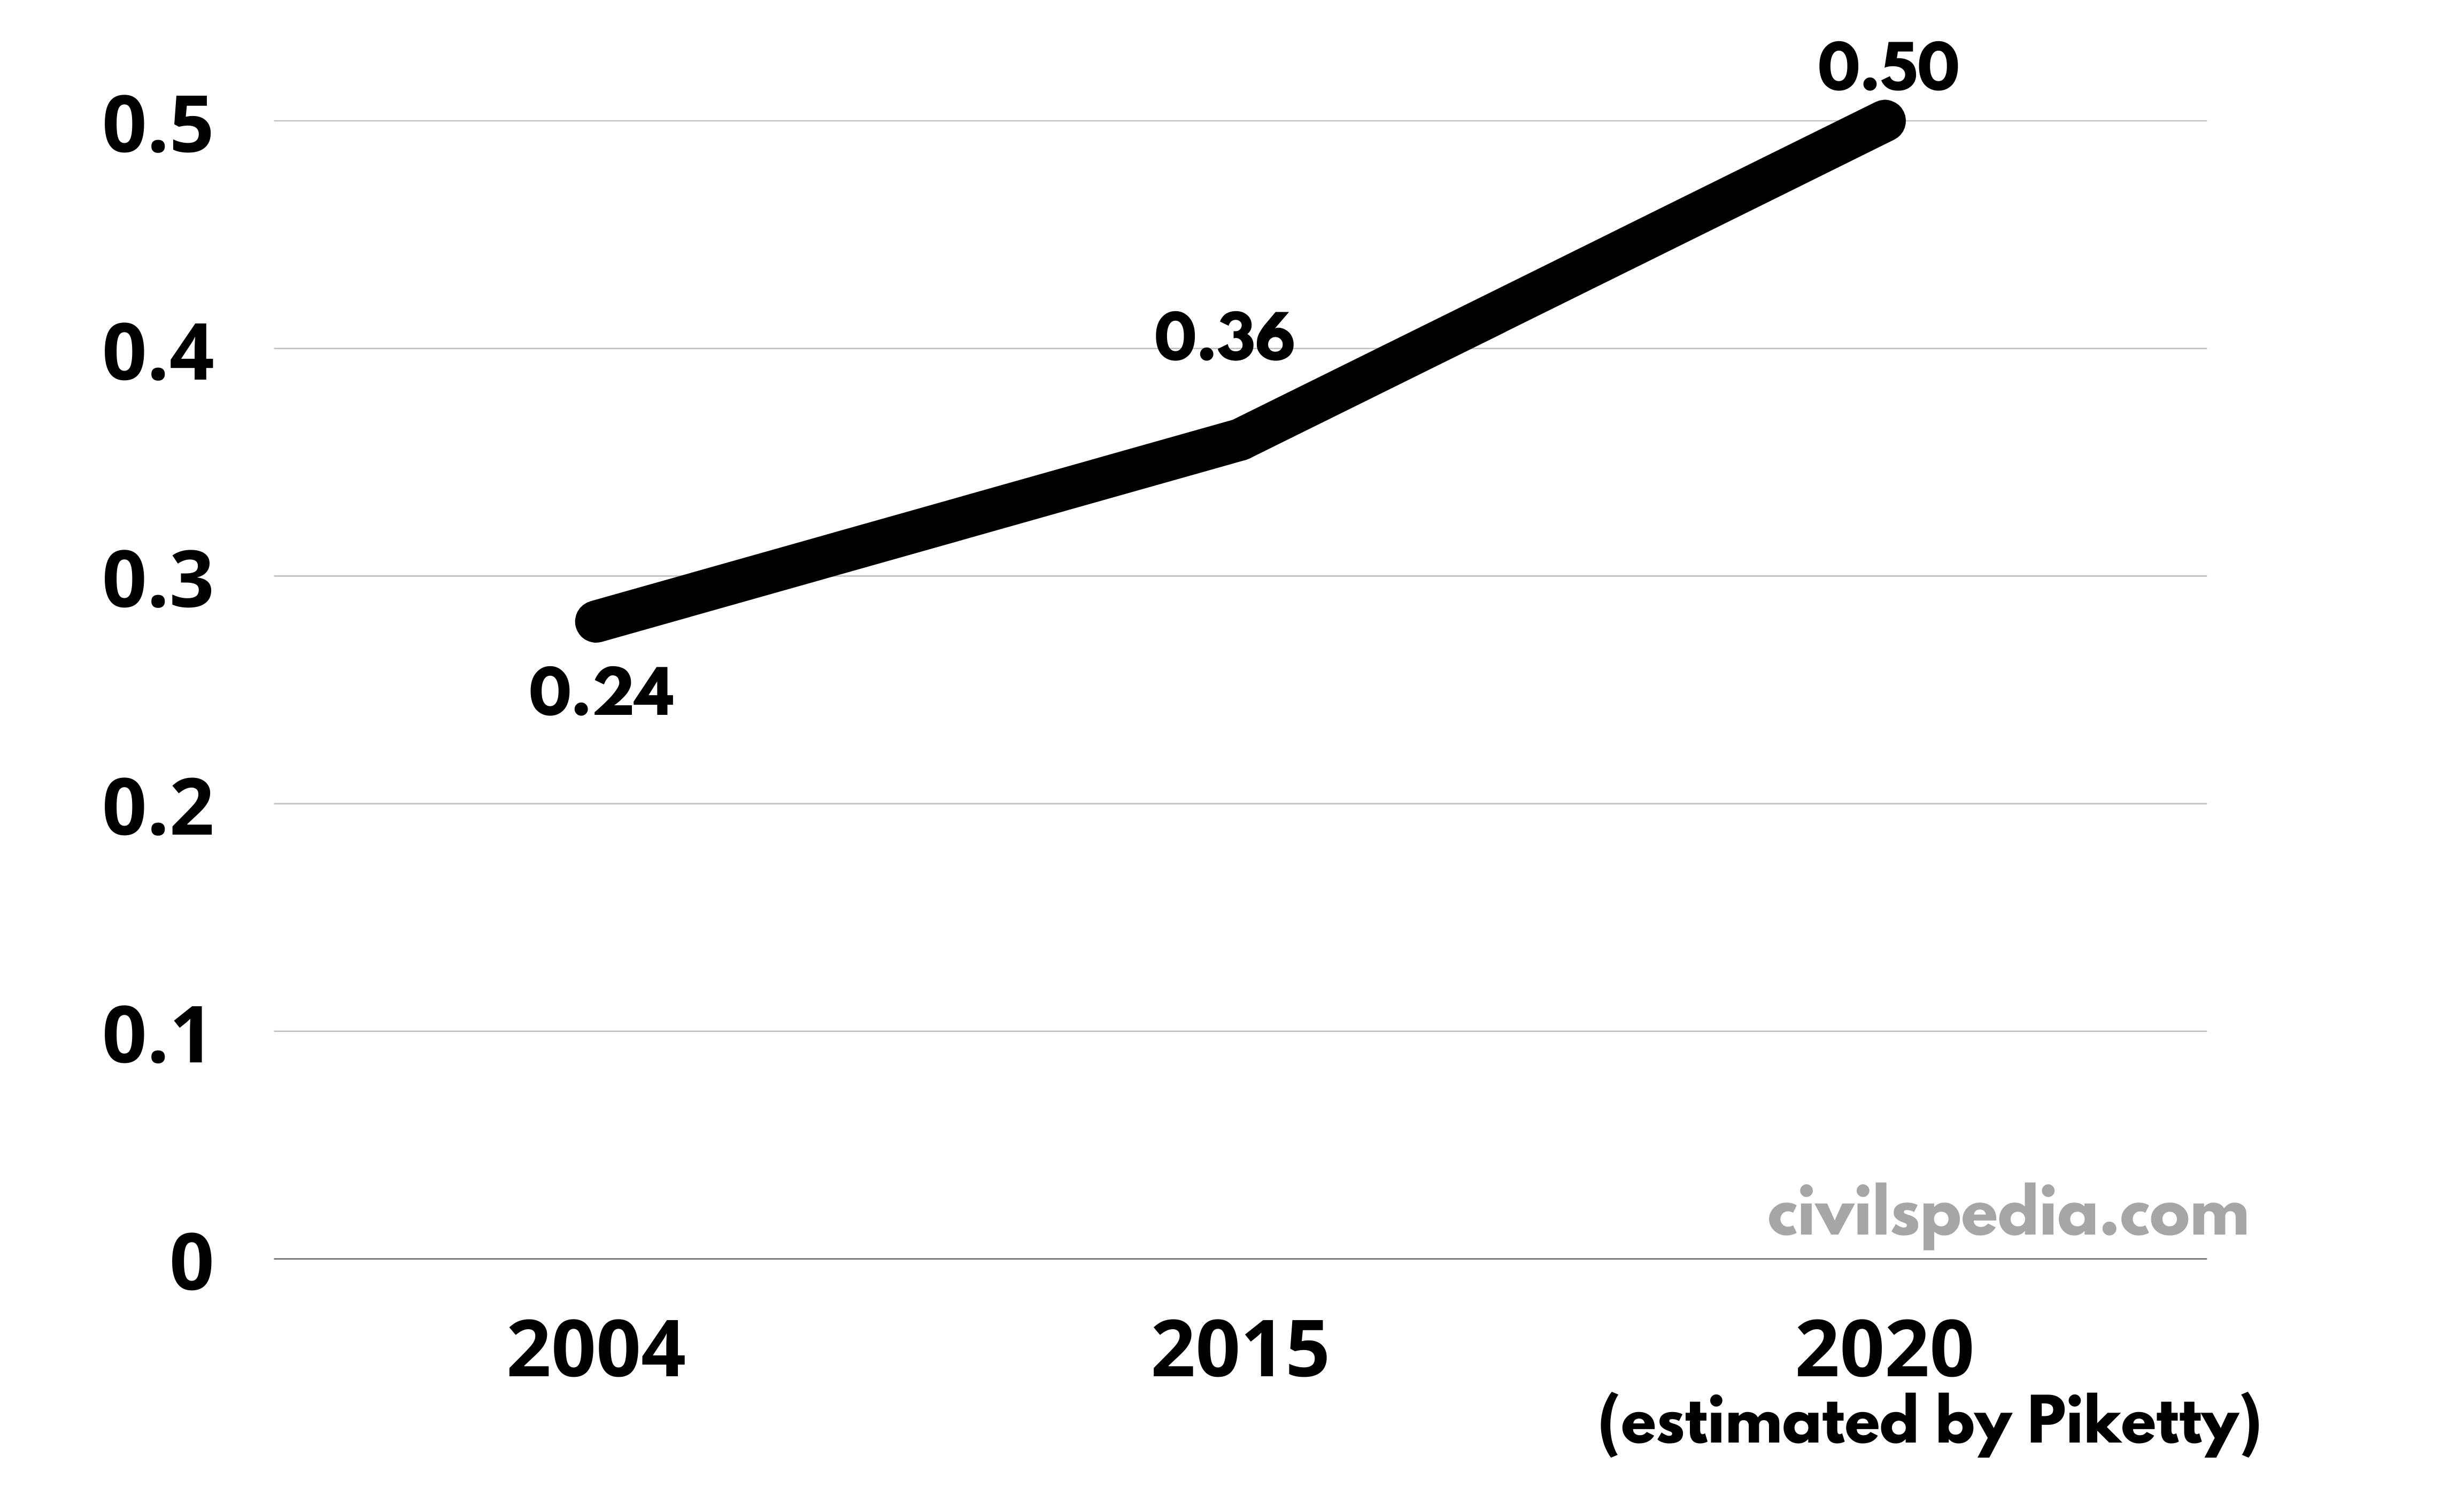
India grew at an average rate of 7.5% since 2011, but growth is not equally distributed (the rich are growing more). Gini Coefficient shows that income inequality is continuously increasing in India. The following data about India’s Gini Coefficient corroborates this.
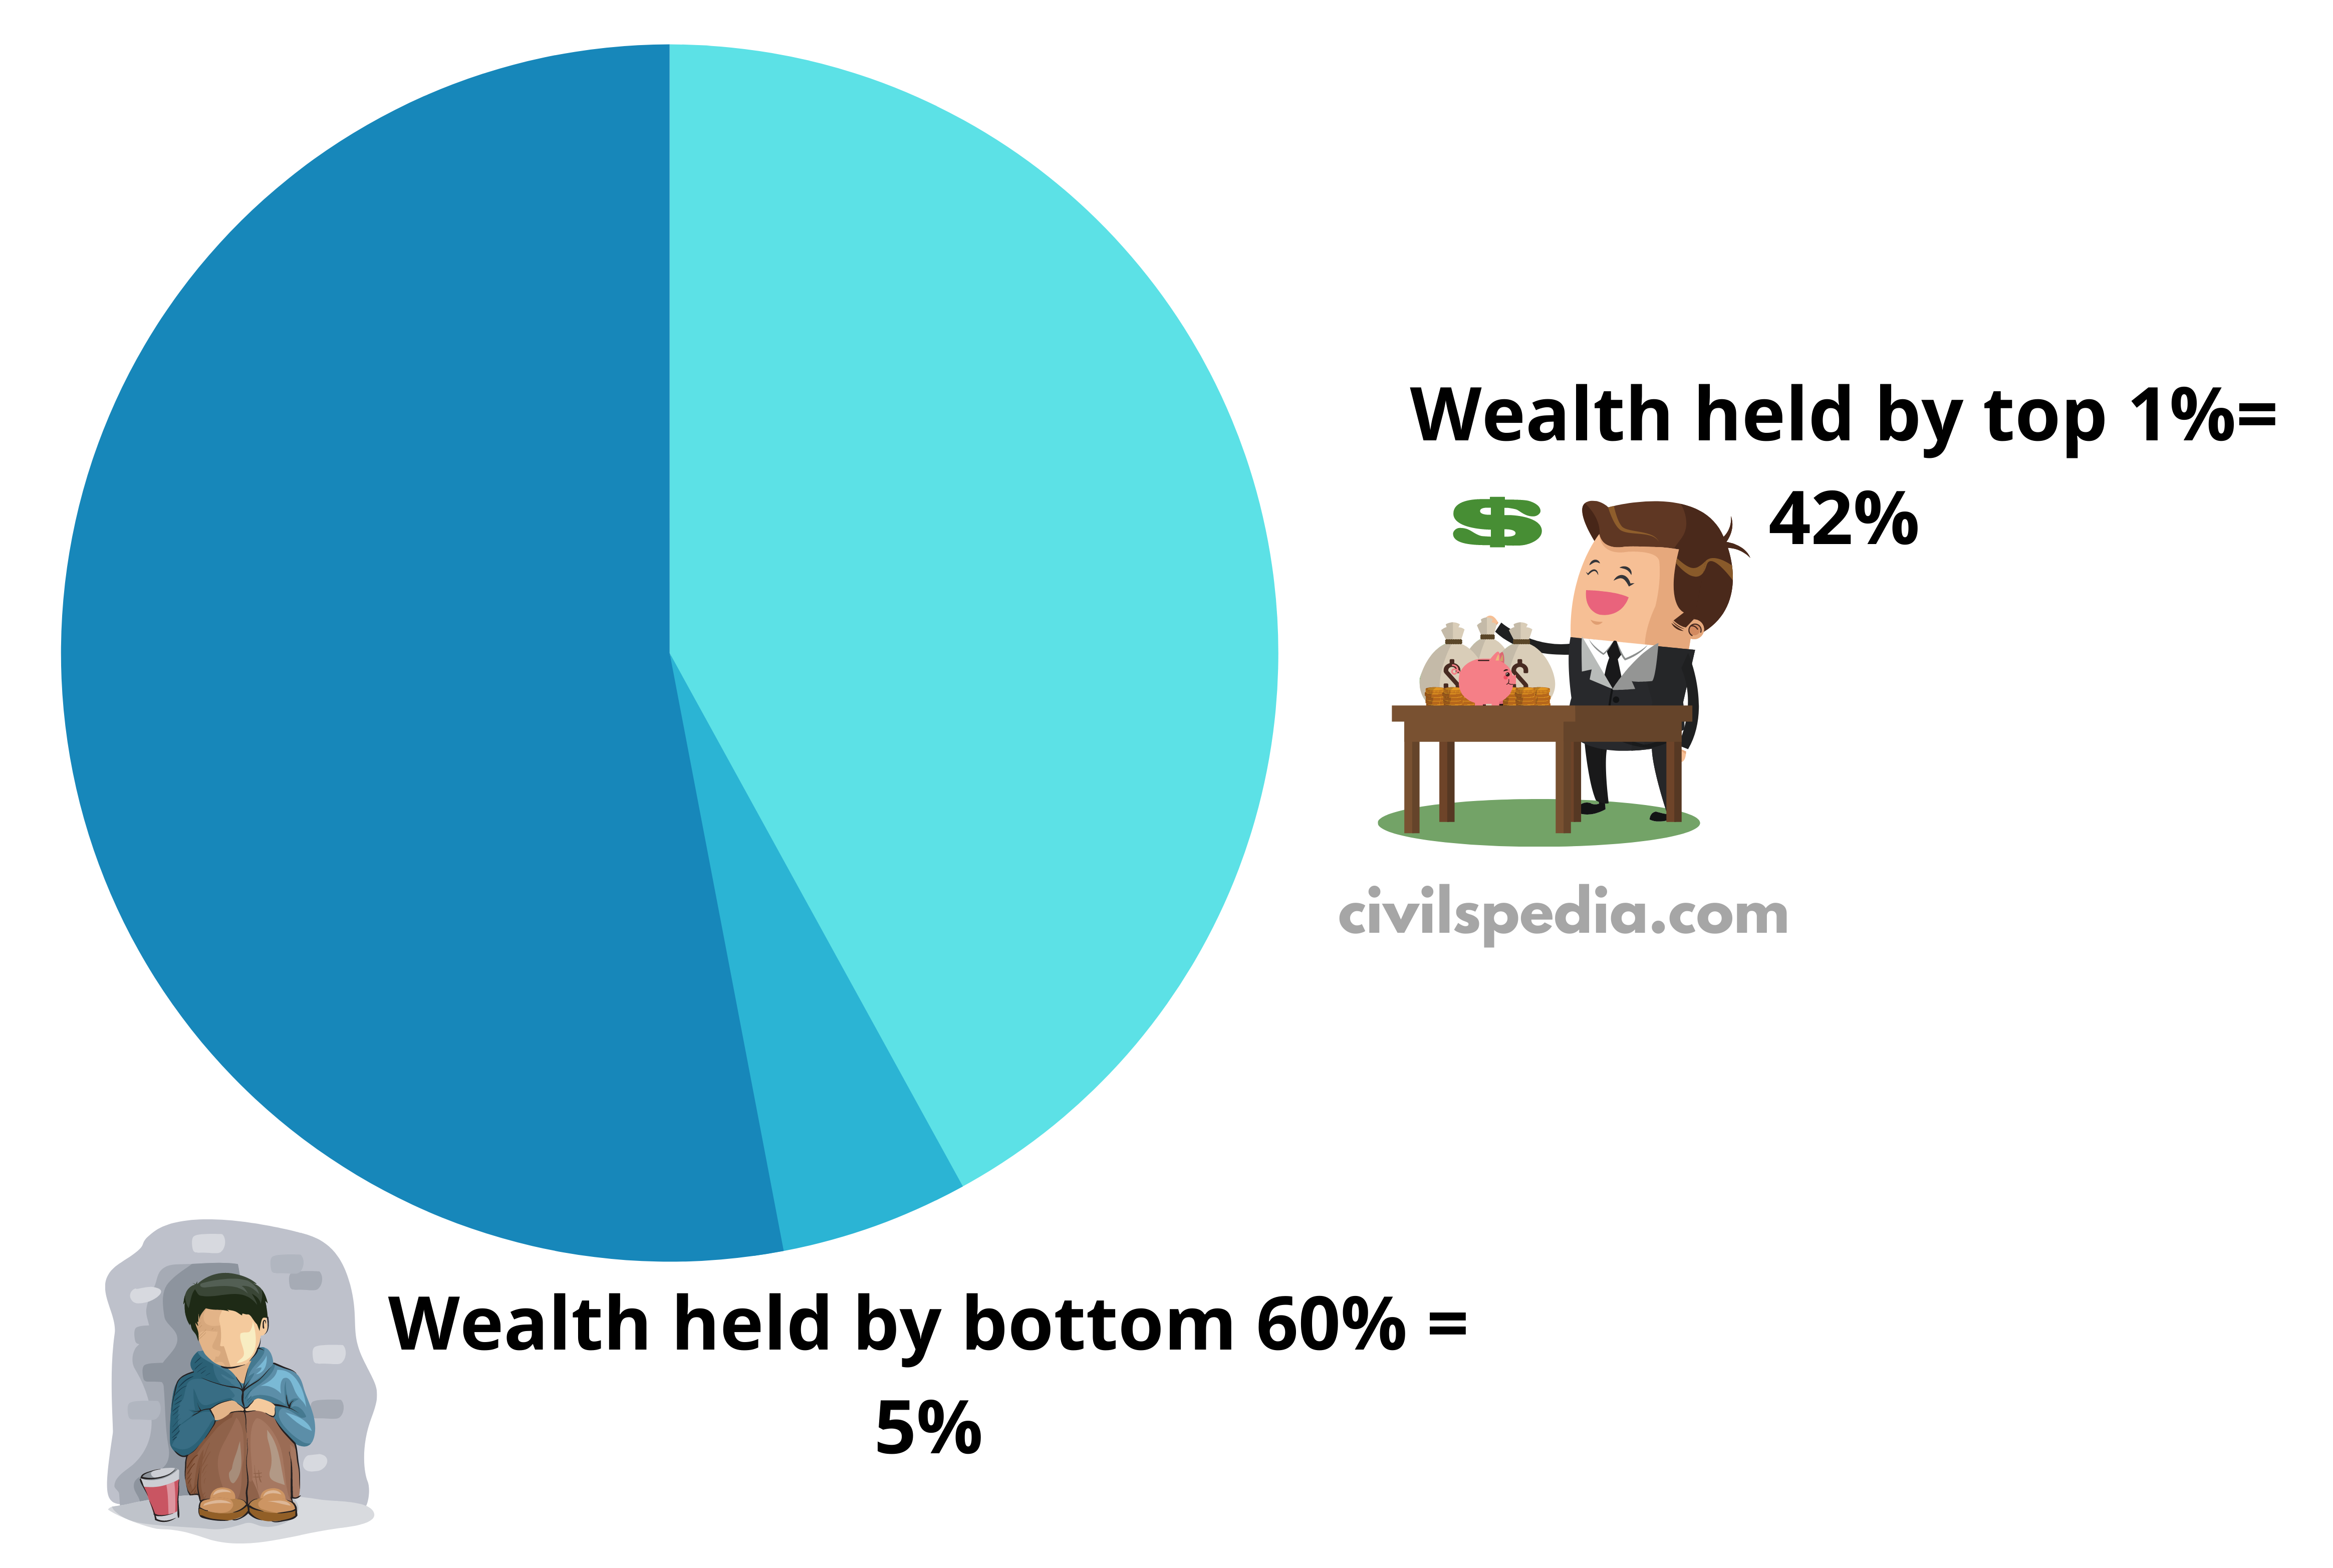
According to Oxfam Report
(2020), India’s top 1% wealthy people hold 42% of the
National Wealth while the bottom 60% own less than 5%.
According to Oxfam head, it is morally outrageous that a few wealthy individuals are collecting a growing share of India’s wealth while the poor struggle to find their next meal. If this obscene inequality continues, it will lead to a complete collapse of the country’s social and democratic structure.
According to the World Inequality Report (2022) released by the World Inequality Lab of the Paris School of Economics
It termed India as a ‘poor and very unequal country, with an affluent elite’.
The top 10% of the Indian population holds 57% of national income, including 22% held by the top 1%
The bottom 50% of the Indian population holds just 13% of national income.
The report has suggested levying a modest progressive wealth tax on multimillionaires.
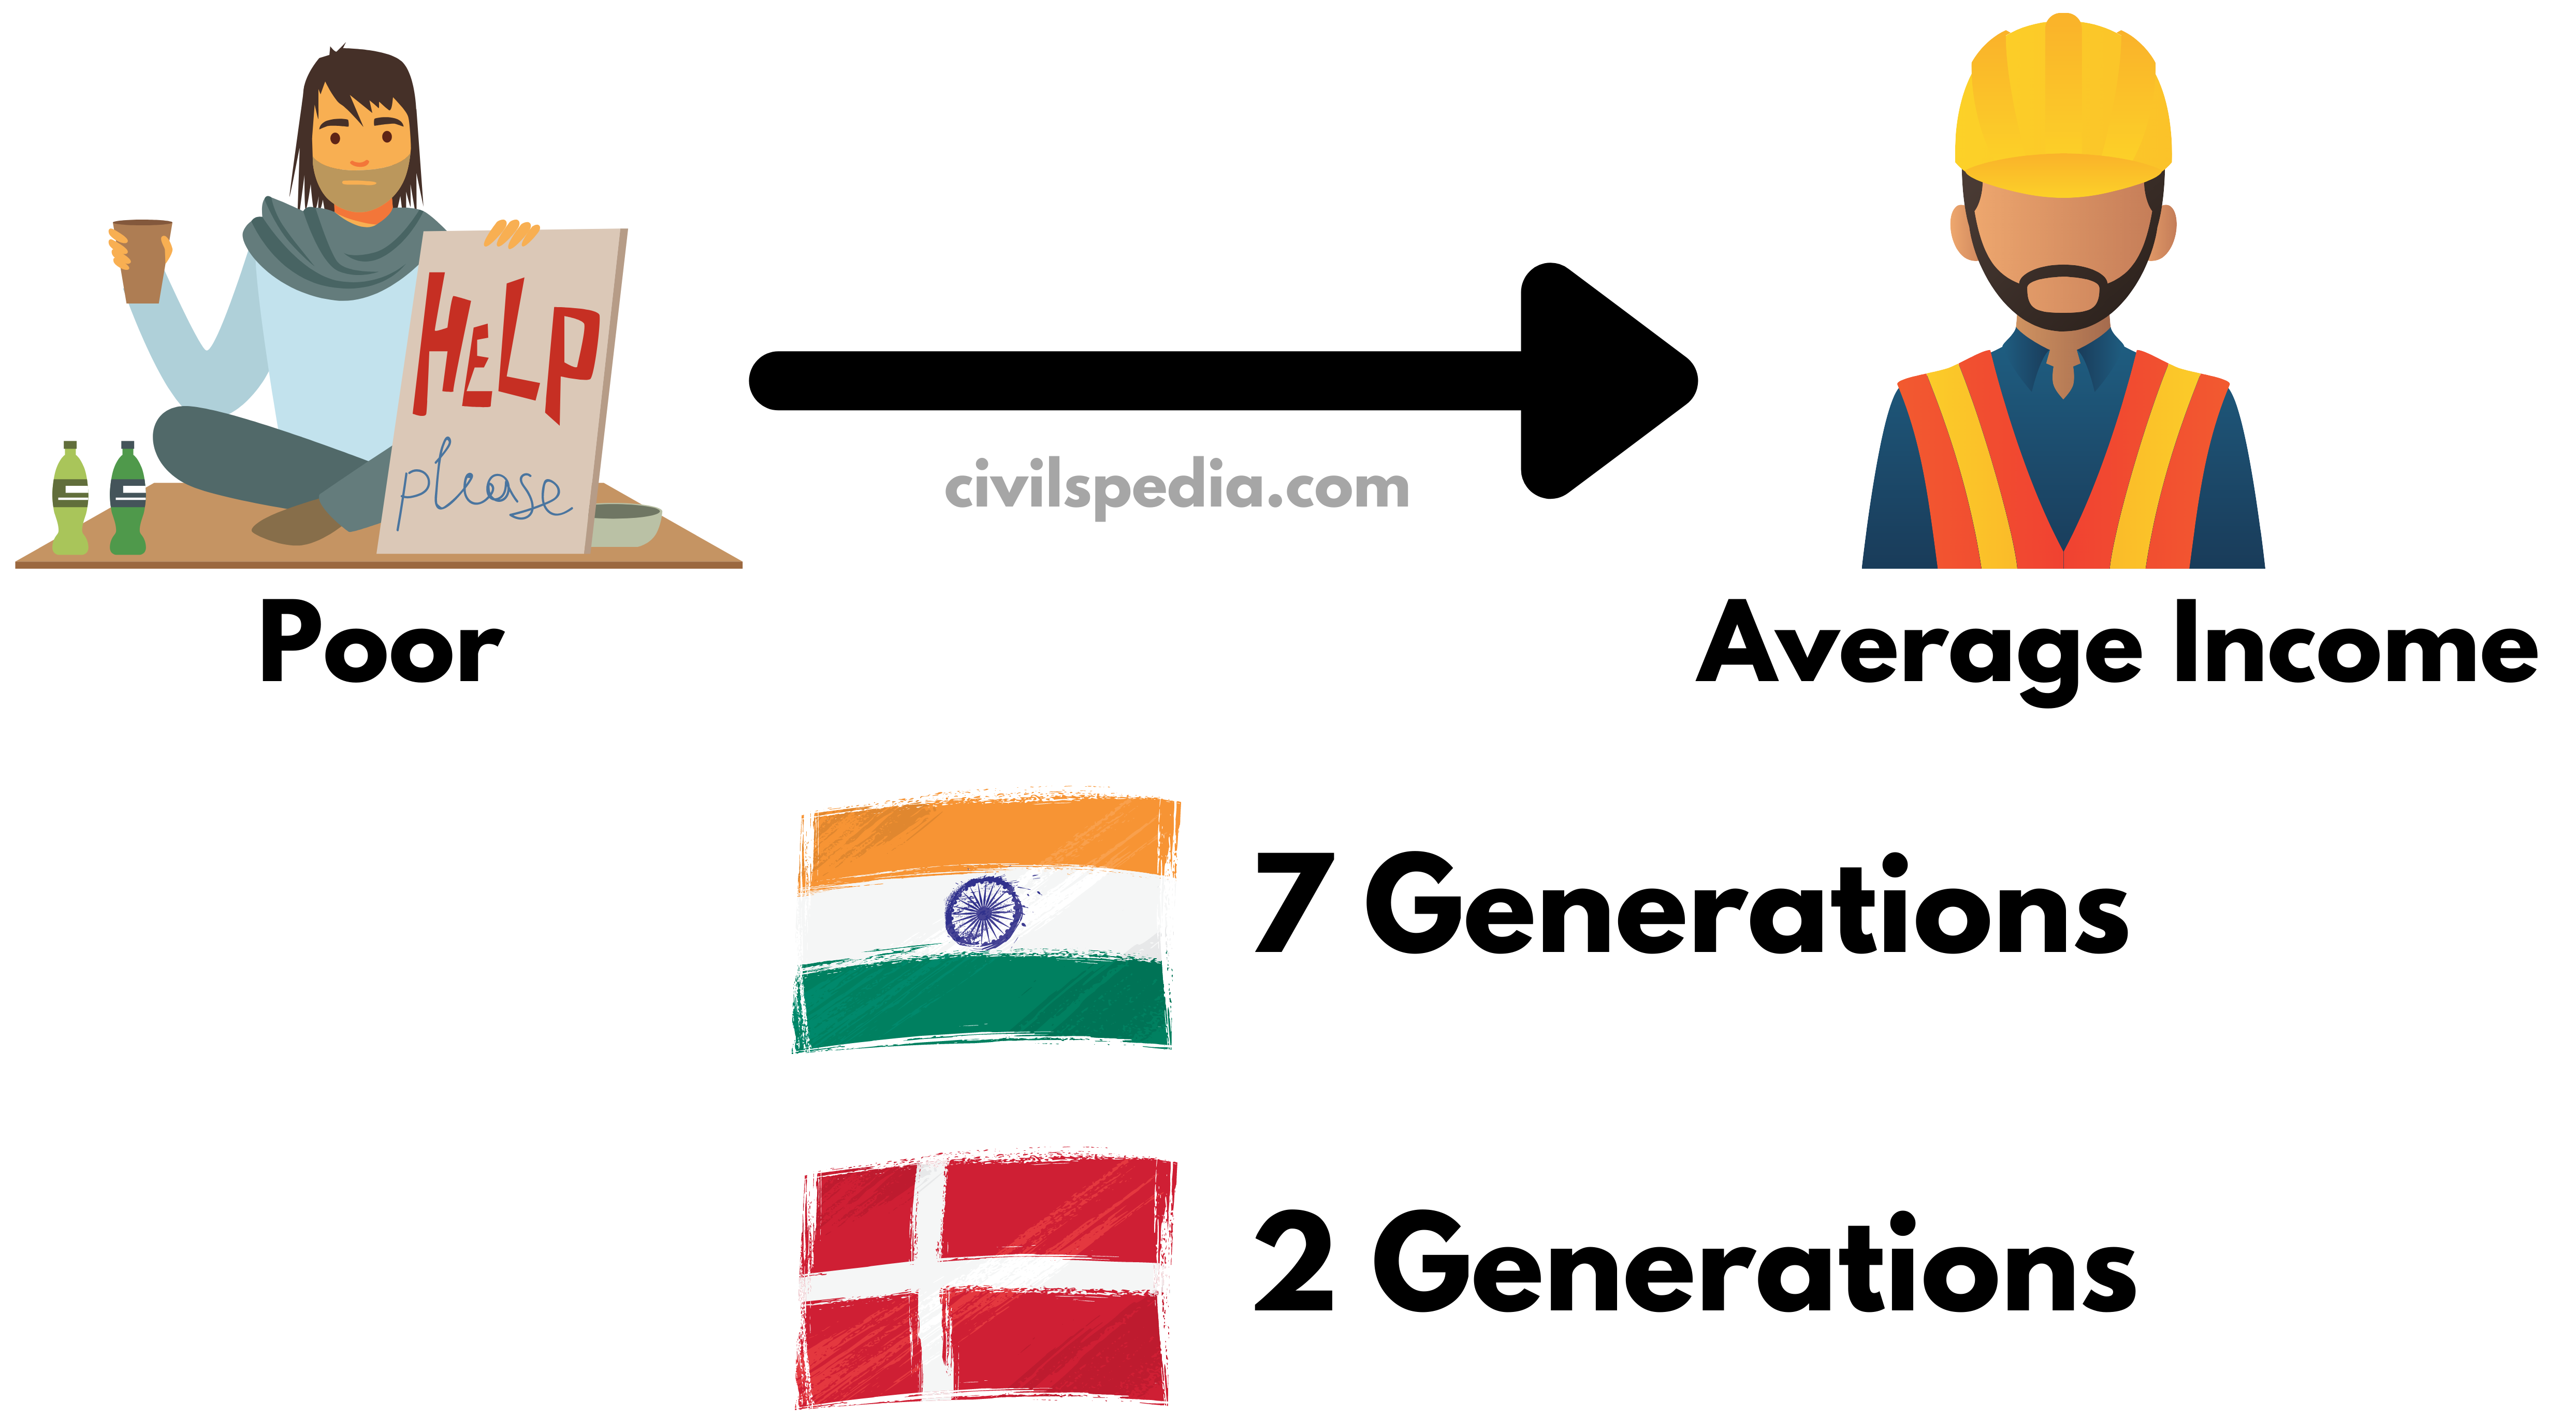
According to the Global Social Mobility report released by the World Economic Forum, the poor in India are more likely to remain poor. It would take 7 generations in India while 2 generations in Denmark for the poor to reach average income.
Further, the Covid pandemic has deepened inequalities of wealth, education, and gender as shown by Oxfam’s report.
Causes of Income Inequality
1. Historical Causes
Caste System: Due to the exclusion of lower caste from ownership of land and education, people belonging to lower caste are poor.
2. Social Causes
Due to the patriarchal and patrilineal nature of Indian society, women don’t own factors of production in India.
3. Frequent Global Economic Crisis
Economic crises like that of 2008 accentuate income inequality by making richer rich and poorer poor. (How= Central Bank cant allow big houses to fall. Due to this, business houses get significant cuts. Currency devaluates, and the loans that companies have to pay decrease in reality. On the other hand, households who deposit their money lose the value of their money).
4. Faulty Taxation System
In India, there is more reliance on Indirect Tax, which is regressive in nature.
Inheritance tax, which is levied when wealth is inherited from one generation to another, is almost negligible in India.
5. Cantillon Effect
The Cantillon Effect is a concept that describes ways in which changes in the money supply can affect different groups of people and economic sectors unequally.
Imagine a situation where the
government decides to print additional money and put it into circulation.
The first people or institutions to receive this new money, such as banks or wealthy individuals, have an advantage because they can spend it before prices rise.
Later, when the money flow increases in the whole economy, it leads to inflation. People who receive the new money later, such as workers or those on fixed incomes, may find that their purchasing power has decreased.
So, the Cantillon Effect
suggests that those who are closer to the source of new money creation benefit
the most, while those further away experience the negative consequences of
inflation. This can result in wealth redistribution and income inequality.
6. India relied on Trickle-Down Approach
India relied on the ‘Trickle Down Approach’, which benefitted the industrial houses and rich businessmen. Instead, in order to reduce inequality, India should have followed the redistributive justice principles of John Rawls, Gandhian trusteeship principles or Amartya Sen’s capability approach.
7. Technological Change
Rapid technological changes are leading to the automation of industries. As a result, few people with high skills are getting high packages while many workers are losing their jobs.
8. Capture of power by elites
Due to Crony Capitalism, political leaders and government work as agents of elites. Policies of government are made to benefit elite sections of society.
Consequences of Inequalities
1. Conflicts and Insurgency
Arab Spring of 2011 in the Middle East was the result of high inequalities in that region.
Earlier in India, Naxalbari Movement was the result of inequality (in landholding).
2. Divides Society
It divides society between haves and have-nots. For India, with an already fractured society over religion, region, gender, or caste, inequality adds another fracture point.
The work of Piketty reveals that when inequalities increase intolerably, governments divide to rule, and persecution of minorities increases with the politics of national identities.
3. Increase in Crimes
It has been observed that unequal societies have higher crime rates. Poverty force people to earn via illegal means.
4. Political Impacts
In case of higher inequalities, political democracy and government lose their legitimacy.
5. Effects on Growth
Income distribution matters for growth. If income is more equally distributed, more potential buyers of goods create bigger markets.
Steps Taken by India
1. Land Reforms
The government introduced the land reforms and abolished the Zamindari System for equitable distribution of the land in the country.
2. Tax Reforms
Piketty has suggested India should improve its Tax: GDP, which is abysmally low. The Indian government is taking steps to bring more people into the tax net.
Apart from that, India has a progressive system of taxation. Progressive Taxation system helps in ‘redistribution of money’ from richer to less well off.
3. Skill Development
Improving education quality, eliminating financial barriers to higher education, and supporting apprenticeship programmes.
4. Social Security
The high cost of healthcare and medicines drives a hundred million people into poverty every year. There must be a universal and permanent safety net for the poorest and most vulnerable. The government has taken various measures like starting the Ayushman Bharat Scheme.
5. Various steps against Black money
The government has taken steps like demonetisation to control black money.
Way Ahead
Universal Basic Income: Introduce universal basic income (as recommended by Economic Survey 2016-17) and raise the minimum income of the common public. These measures can reduce the income gap and result in equal distribution of earnings in the labour market.
Urban Employment Guarantee Schemes: Urban counterpart of MGNREGS, which is demand-based and offers guaranteed employment, should be introduced to rehabilitate surplus labour.
Equitable access to education: Enhance the budgetary allocation for education to 6% of GDP, as committed in the National Education Policy, and the creation of more jobs with long-term growth are vital for triggering upward mobility among people experiencing poverty.
Rationalization of Subsidies: Better targeting of beneficiaries through alternatives like direct benefit transfers over existing inefficient mechanisms
Case Study: Wealth Redistribution Council
In 2021, Japanese PM Kishinev announced the creation of the ‘Wealth Redistribution Council‘ to tackle rising wealth inequalities and redistribute the wealth among households.
Japan aims to pass on wealth from corporations to the households to double the household incomes and rebuild a broader middle class. It will also help in recovering the Japanese economy post-Covid pandemic.
This article deals with ‘National Incomes.’ This is part of our series on ‘Economics’ which is important pillar of GS-2 syllabus . For more articles , you can click here .
Introduction
Income level is the most commonly used tool to determine the wellbeing and happiness of nations and their citizens.
GDP, NDP, GNP, and NNP are the four ideas/ways to calculate a nation’s income.
Gross Domestic Product (GDP)
Gross Domestic Product or GDP is the market value of all the final goods and services produced within the boundary of a country during one year period.
In GDP, the
boundary of the country matters and not the citizenship of the person. If the good or service is
produced within the nation’s boundary, then it will be counted in the GDP.
Interpretation
Nominal GDP and Real GDP
GDP at Current Price (Nominal GDP) vs GDP at Constant Price (Real GDP)
After looking at Nominal GDP/ GDP @ Current Price, we can’t say whether the economy has improved or not. E.g., in the example shown in the infographic below, quantity-wise production has decreased, but figures show that GDP has remained constant.
To rectify this problem, economists set a Base Year (2011 for India) & then use the production data of the current year but the price of goods that of the base year. Using this process, GDP at a Constant Price or Real GDP can be calculated.
In FY22-23, the nominal GDP growth is 15.4%. But the real GDP growth is expected to be close to 7%.The difference (8.4%) is the effect of price inflation.
GDP Deflator
The GDP deflator measures the price changes of goods and services. It is calculated in the following way
GDP deflator can also be used to measure inflation in the economy.
GDP at Factor Cost & GDP at Market Price
GDP at Factor Cost
There are four factors of production & each factor will be paid in money in the following way
Land: Rent
Labour: Wage
Capital: Interest
Entrepreneurship: Profit
GDP at factor cost is obtained by adding the value of these factors of production.
GDP at Market Price
But GDP at factor cost will
attract some tax & subsidies, which need to be added and subtracted
respectively to get GDP at market price.
The official GDP of India is GDP AT CONSTANT MARKET PRICE.
Methods to calculate GDP
There are three methods to calculate GDP
In India, we use Income method to calculate GDP.
Method #1: Income Method
In India, we use the Income method to calculate GDP.
In any economy, a person will get wage (w) for his labour, interest (I) on his capital, profit (P) on his entrepreneurship and rent (R) on his land or building. Under this method, GDP (at factor cost) is calculated by adding up all the incomes generated in the course of producing final goods and services.
Subsequently, if we add taxes and subtract subsidies and adjust that for inflation, we will get GDP at constant and market prices.
Method #2: Expenditure Method
An alternative way to calculate the GDP is by looking at the demand side of the products.
All the final goods & services produced in the economy will ultimately be purchased. Hence, if we add the expenditure of all the persons in an economy, we can calculate GDP (at the current market price).
Under this method, the total expenditure incurred by the society in a particular year is added together. .
Precautions
Second-hand goods: The expenditure made on second-hand goods should not be included.
Purchase of shares and bonds: Expenditures on purchasing old shares and bonds in the secondary market should not be included.
Transfer payments: Expenditures towards payments incurred by the government like old age pension should not be included.
Expenditure on intermediate goods: Expenditure on seeds and fertilizers by farmers and cotton and yarn by textile industries are not to be included to avoid double counting.
Method #3: Gross Value Addition or Production Method
The final goods and services are produced by passing through value addition in various stages. GDP can be calculated by adding value-added during each step of the finished product. This method is known as GVA or Production Method.
By doing that, we get GDP at factor cost, which can be easily converted to GDP at constant market price by adding taxes, subtracting subsidies and adjusting it with inflation.
Gross National Product (GNP)
GNP is the monetary value of all the goods and services produced by NORMAL RESIDENTS of a country.
Here, boundary of territory is not important but normal residency is important.
Interpretation
Indian earning in India => His income will be counted in Indian GNP.
Indian earning in Saudi Arabia => His income will be added in Indian GNP.
Earnings of Korean-owned Hyundai car factory in India => It’s earning will not be counted in Indian GNP.
Net National Product (NNP)
NNP is obtained by deducting the value of depreciation from the GNP.
Capital assets get consumed due to wear and tear whenever something is produced. This wear and tear is called depreciation. Naturally, depreciation does not become part of anybody’s income.
Net National Product at Factor Cost
Through the expression given above, we get the value of NNP evaluated at market prices. But market price includes indirect taxes and subsidies as well.
If we add taxes and subtract subsidies from NNP evaluated at market prices, we obtain Net National Product at factor cost.
India’s National Income is NNP at Factor Cost.
Per Capita Income
Per Capita Income is the average income of a person in a country in a particular year.
It is calculated by dividing national income (Net National Product at Factor Cost) by population.
India’s Per Capita Income is ₹ 1,35,000 (2019-20).
Personal Income
Personal income is the total annual income received by all the individuals of a country from all the sources before the payment of direct taxes.
Personal income is calculated by deducting the undistributed corporate profit and employees’ contributions to social security schemes and adding transfer payments to the national income.
Disposable Income
Disposable Income is the individual’s income after the payment of income tax.
Limitations in measuring National Incomes
Illegal Activities not accounted: Income earned through illegal activities such as smuggling, gambling, illicit extraction of liquor, etc., is not included in National Incomes.
Nature of Statistics: Statistics lag behind the actual happening in the economy, thus increasing the time to capture and understand the significant structural change. E.g., In India, the most accurate GDP data, i.e., revised estimates, comes after a lag of almost 3 years.
Many activities in an economy can not be evaluated in monetary terms. For example, the domestic services women perform at home are not paid for. These Non-marketed activities are not accounted in National Incomes.
Barter exchanges which are still prevalent in rural and tribal areas are not accounted in National Incomes.
Externalities refer to the benefits (or harms) a firm or an individual causes to another for which they are not paid (or penalized). Negative externality is also not accounted .
National Incomes doesn’t give any picture of distribution of income and income inequality within the economy. The trickle down of benefits failed in most nation’s with rise in inequalities in almost all major economies. These inequalities are further pushed by the recent pandemic
The deduction of depreciation allowances, accidental damages, repair and replacement charges from the national income is not an easy task. It requires high degree of judgment.
Rise in national incomes and welfare
National Income is considered an indicator of the economic wellbeing of a country. The country’s economic progress is measured in terms of its GDP per Capita and annual growth rate.
But the rise in GDP or per capita income need not always promote economic welfare as
Economic welfare depends upon the composition of goods and services provided. The greater the proportion of capital goods over consumer goods, the lesser will be the improvement in economic welfare.
Higher GDP with greater environmental hazards such as air, water and soil pollution will be little economic welfare.
Production of war goods will show an increase in national output but not welfare.
An increase in national output can also result from the exploitation of labour. This exploitation doesn’t lead to the welfare of people.
Indian GDP Trends and Analysis
The base year for India is 2011. (there is news of changing it to 2018, but as of now, it is 2011)
In the recent years, GDP growth rate (at constant price) trends was as follows:-
Note regarding above graph: When we say that the Indian economy grew by 10 per cent in a particular year, what it essentially means is that the total GDP of the country in that year was 10 per cent more than the total GDP produced a year ago. Similarly, when we say the economy contracted by 8 per cent this year, we mean that the total output of the economy (as calculated by GDP) is 8 per cent less than the total output of the preceding year. This is called the year-on-year (YoY) method of arriving at the growth rate.
India is the fifth largest economy of the world considering GDP at current prices in US dollars. The top 5 economies are as
follows .
Global Shocks and impact on India’s GDP
Global Financial Crisis of the
past had a limited impact on India. This
was due to following reasons
Prior to 1991, Indian economy had limited integration with the world economy. Hence, it was insulated from the crisis the economic crisis happening in other countries.
There was significant gaps in the global economic crisis and they didn’t happen one after another. For example, Oil Price Shock of 1973, East Asian Crisis of 1997 and Financial Crisis of 2007-08.
But now the situation is
different. Indian economy is very well connected with the world economy.
Moreover, global economy is facing ‘Triple Shocks’ one after another
Covid-19 Pandemic: It slowed down the global economy as world was virtually shut down.
Russia-Ukraine Crisis: It led to supply chain disruptions and massive increase in price of fuel, food and fertilizers.
Rate Hike by Advanced Economies: The Easy Money Policy followed by Advanced Economies during Covid led to massive inflation in advanced economies. To control the situation, Central Banks of Advanced Economies started to increase their Repo Rates which led to FPI outflows from emerging economies (like India), depreciation of currency and increase in the yield of government bonds.
But inspite of that, the impact
of these shocks can be withstood by the Indian Economy
Side Topic: K Shaped Recovery
The Economic Survey (2021) predicted the ‘V-Shaped Recovery’ of the Indian economy post-Covid pandemic. It was hoped that the GDP growth rate would bounce back quickly owing opening up of economic activities. Historically, a similar trend was observed in the Spanish Flu of 1918-20. But other economists tend to differ and present various scenarios like
U-Shaped Recovery: GDP growth will remain low for a longer time before bouncing back.
W-Shaped Recovery: GDP growth will bounce back, then dip and bounce back again.
K-Shaped Recovery: Some sectors of the economy (like e-education, e-commerce etc.) will see massive growth while other sectors (like tourism, restaurants etc.) will continue to shrink or suffer losses.
But, India has witnessed a K-shaped recovery. In simple terms, while some sectors/ sections of the economy have registered a speedy recovery, many are still struggling. The entities that have done well are firms already in the formal sector and had the financial wherewithal to survive the repeated lockdowns and disruptions. Many big firms in the formal economy have increased their market share during the Covid-19 pandemic and this has come at the cost of smaller, weaker firms that were mostly in the informal sector.