Last Updated: June 2023 (Inflation)
Table of Contents
Inflation
This article deals with ‘Inflation.’ This is part of our series on ‘Economics’ which is an important pillar of the GS-3 syllabus. For more articles, you can click here.
Introduction
- Inflation can be defined as the persistent rise in the general level of prices of goods and services in an economy over a period of time.
- If the price of one good has gone up, it is not Inflation; it is Inflation only if the prices of most goods have gone up.
Why does Inflation occur?
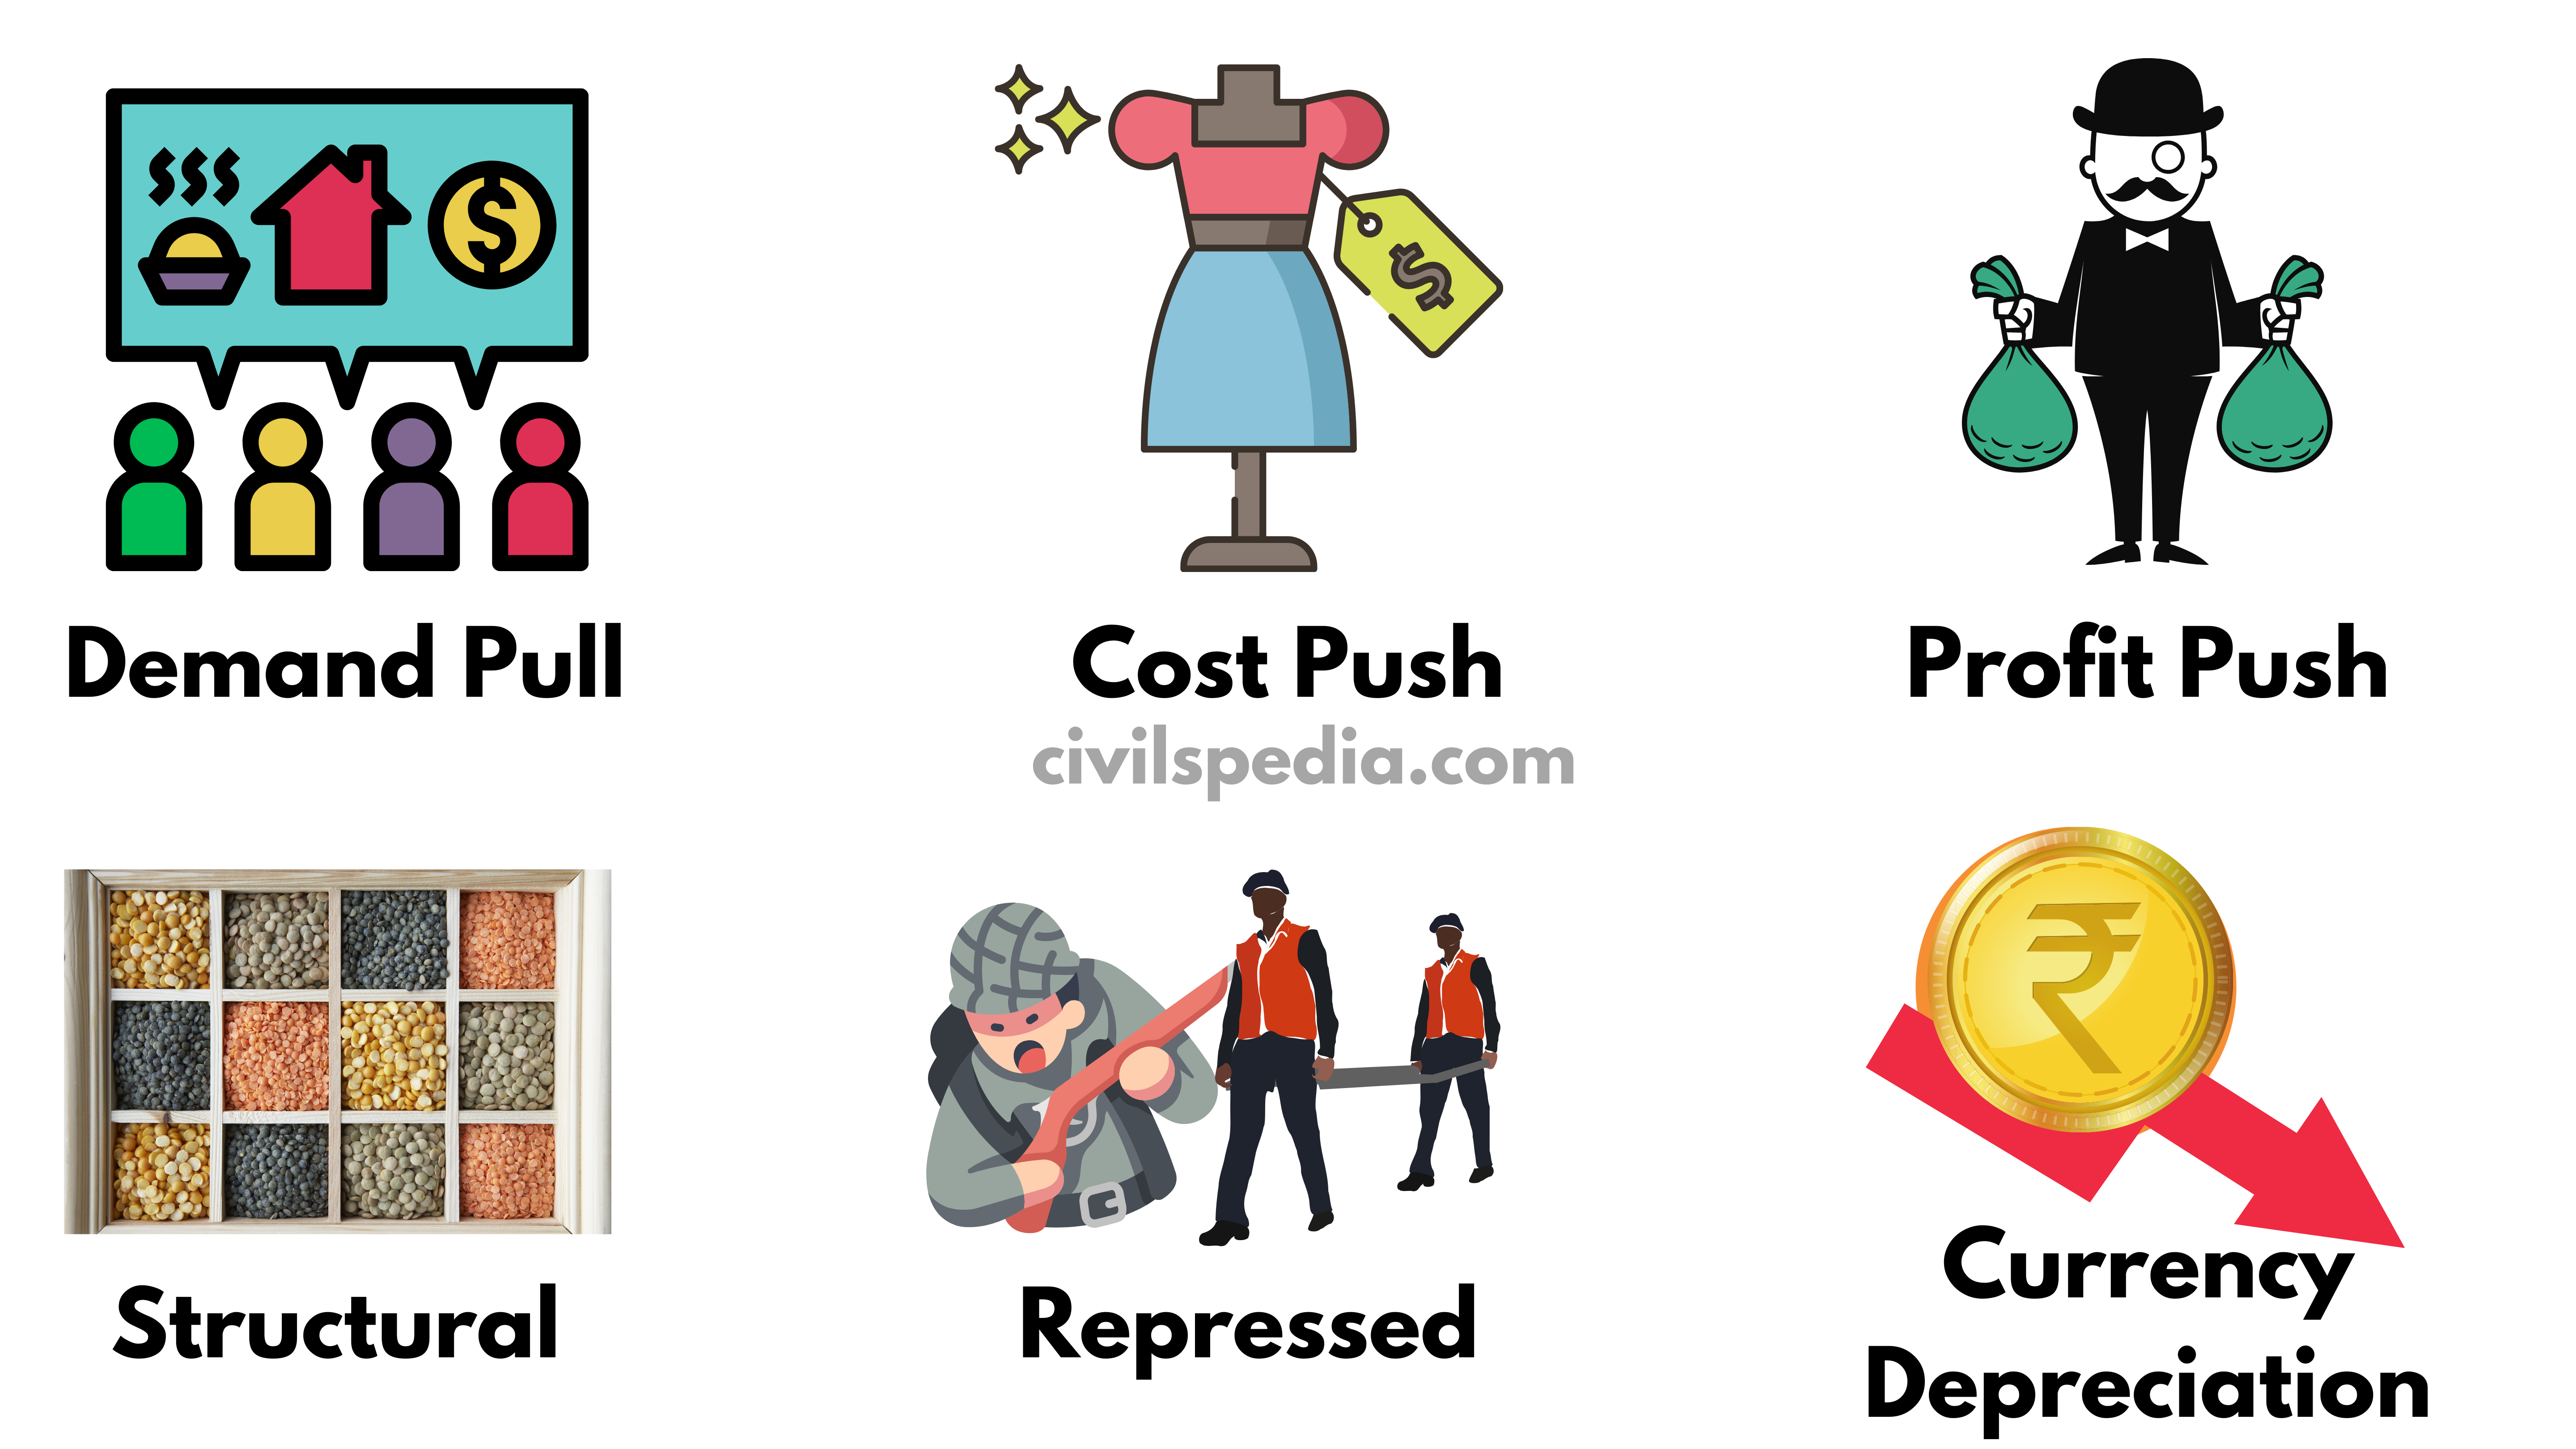
1. Demand-pull Inflation
- In his book “General Theory on employment, interest, money”, British Economist J.M. Keynes (1883) said, “when the economy is functioning at full employment, aggregate supply will match aggregate demand.” The economy will have a ‘General Price’ level at this equilibrium.
- Demand-pull Inflation happens when aggregate demand exceeds aggregate supply.
- It can happen (i.e. demand can exceed supply) in the following situations
- Increase in money supply due to RBI’s expansionary or easy money policy.
- Increase in the propensity to consume.
- Increase in investment expenditure.
- Increase in the fiscal deficit of the governments.
- Increase in net exports.
- To tackle such Inflation, the government can
- Reduce money supply by increasing interest on loans.
- Induce people to save rather than consume by giving attractive investment options.
- Follow Fiscal Consolidation and keep fiscal deficit in check.
- Import goods in short supply.
2. Cost-push Inflation
- It is also known as supply shock inflation.
- When supply is reduced due to an increase in the price of raw materials, leading to a higher cost of production.
3. Profit-push Inflation
- When Cartels, Monopolists, or Oligopolists deliberately cut their supply or hoard their produce or hike the price in greed of more profit.
- E.g., OPEC increases the price of Petroleum or greedy Indian Merchant hoard onion so that their price increases.
4. Structural Inflation
- It is caused by deficiencies in certain conditions in the economy when it cannot respond to people’s increased demand for certain specific things or a lack of infra to make commodities available to consumers.
5. Repressed Inflation
- During wars or natural disasters, governments impose price controls and rationing measures to keep prices in check. But after the controls are withdrawn at the end of war or disaster, prices will rise rapidly as traders try to cover up their earlier losses, leading to inflation.
6. Other causes
- The depreciation of Rupees makes the import of goods expensive.
Post Covid-19 Case Study
After the Covid-19 pandemic, high inflation was observed because
- Demand-push inflation was observed as most countries were following easy money policy and providing loans at low rates.
- Repressed inflation was observed due to the pent-up demand of the customers.
- Cost-push inflation was observed due to an increase in the price of raw materials owing to supply chain disruptions.
- Profit-push inflation was observed in petroleum products because OPEC+ didn’t increase the supply of crude oil commensurate with the increase in demand.
Types of Inflation based on speed
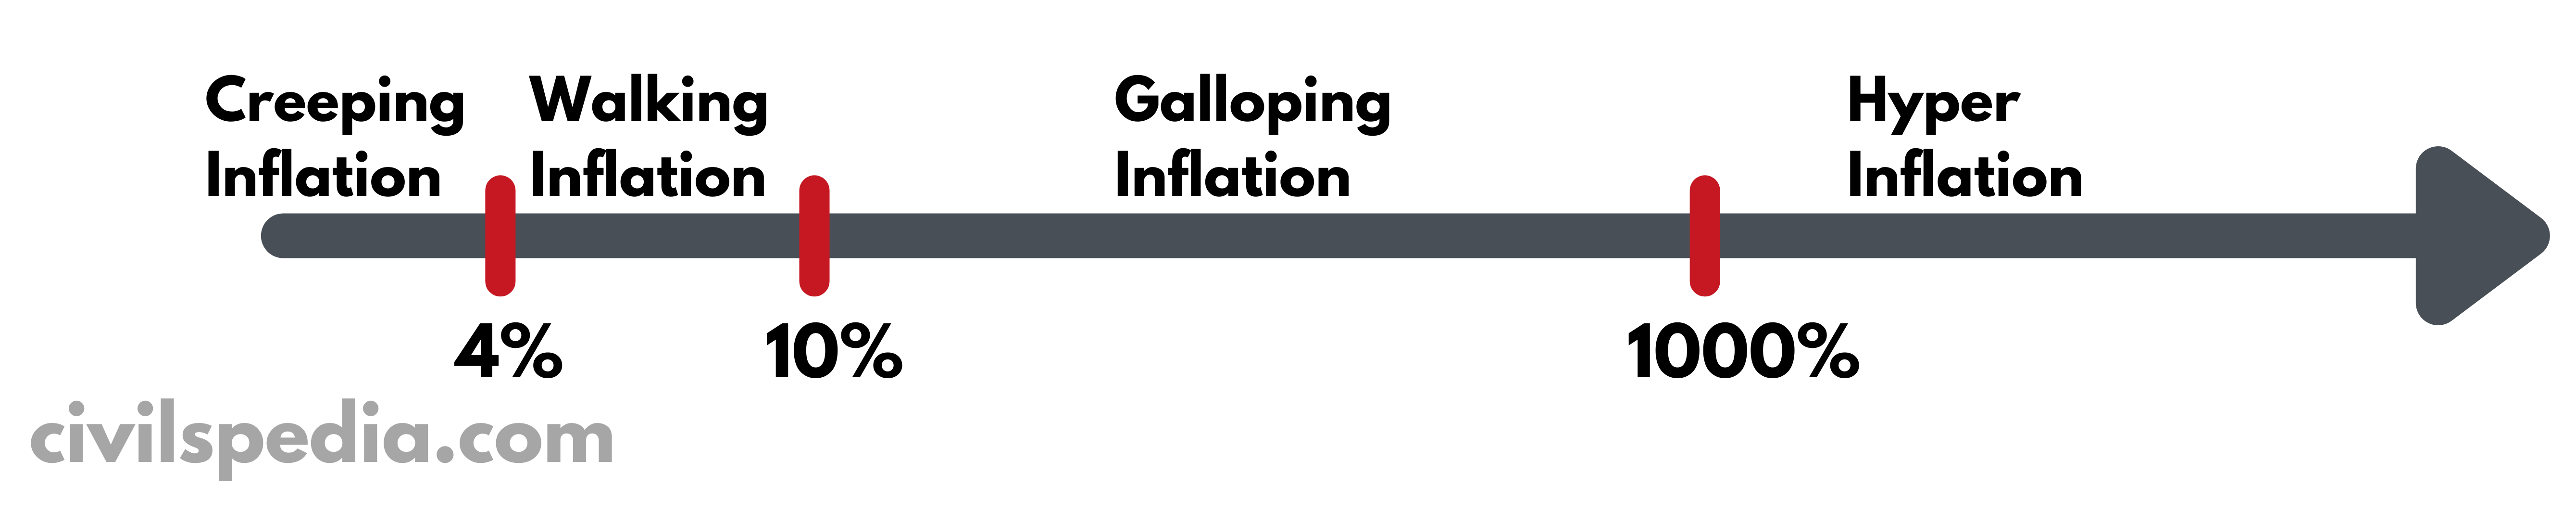
1. Creeping Inflation
- Inflation of up to 4% (for the Indian economy).
- It is regarded as safe and essential for job creation and economic growth.
2 . Walking
- Inflation of more than 4% but limited to single-digit only.
3 . Galloping Inflation
- Very high inflation in the range of double-digit or triple-digits.
- Examples :
- In the 1970s and 1980s, Latin American countries such as Argentina, Chile and Brazil faced Galloping Inflation in the range of 50 to 700 per cent.
- After the disintegration of the ex-USSR in the early 1990s, the Russian economy faced such inflation.
4 . Hyperinflation Inflation
- In Hyperinflation, annual inflation rates are in the million or even trillion. Prices of goods shoot up overnight.
- Examples
- Germany during Great Depression when Deutsche Mark became worthless.
- In recent times, Zimbabwe and Venezuela faced Hyperinflation.
Some definitions
1. Deflation
- Persistent fall in the level of prices of goods and services.
2. Disinflation
- Reduction in rate of inflation.
3. Stagflation
- Stagflation is the combination of inflation & unemployment due to recession.
- Stagflation is the economic construct developed post the first oil shock of the early seventies when US inflation had soared to 11.5 per cent, even as the unemployment rate spiked to 9 per cent.
4. Reflation
- Attempt to raise the price to counteract deflationary pressures.
5. Skewflation
- Episodic price rises in one or a small group of commodities while inflation in the remaining goods and services remains the same.
- E.g., the episodic rise in the price of onions, tomatoes, or pulses.
Impacts of Inflation
Inflation hurts the following groups
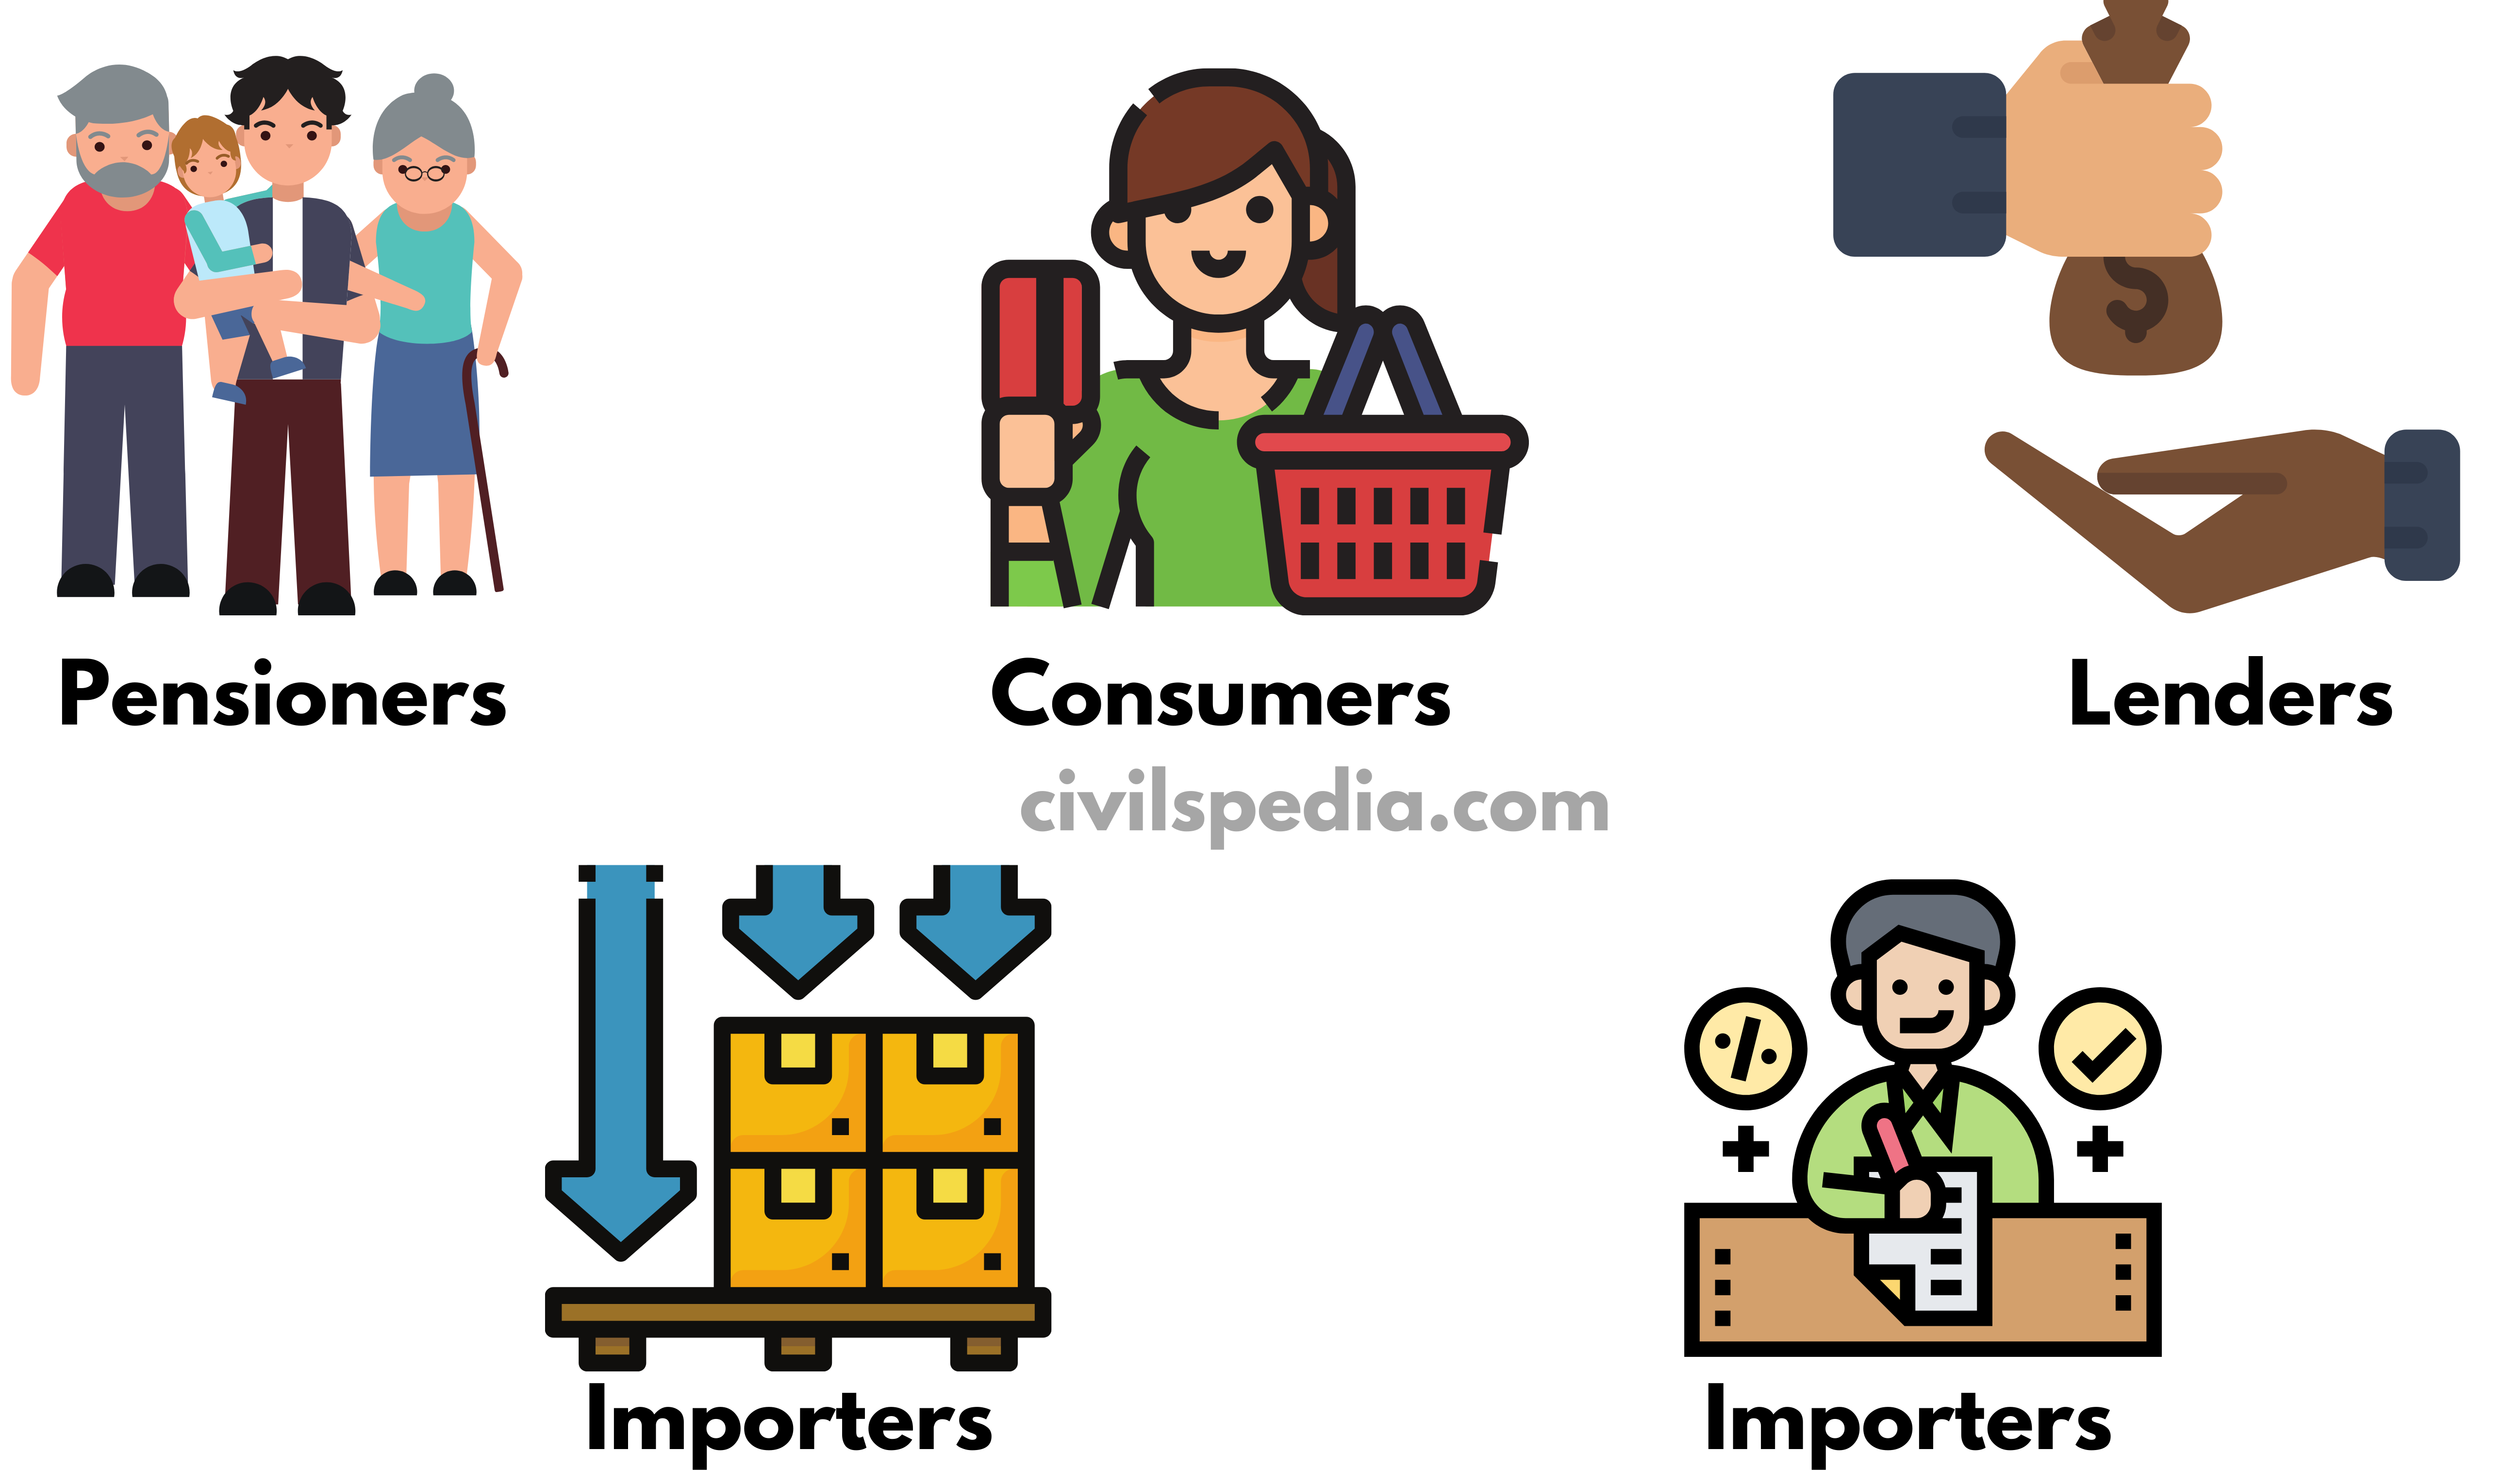
- People on a fixed income, pensioners and bondholders suffer because their income remains fixed while money’s purchasing power is reduced due to inflation.
- Consumers suffer because a price rise means more money being paid by consumers for what they buy.
- Lenders suffer because the money they will get back will have less purchasing power. (Note – Inflation favours the Debtors over the Lenders).
- Importers suffer because inflation leads to currency depreciation, increasing the cost of imports.
- Taxpayers suffer as they have to pay more direct and indirect taxes. As indirect taxes are imposed ad valorem (on value), increased prices of goods make taxpayers pay increased indirect taxes. Similarly, the direct tax increases due to inflation as the taxpayer’s gross income moves to the upward slabs of tax brackets.
Additionally, Inflation has the following negative impacts
- Reduction in overall demand: Due to a decrease in the purchasing power of people, the overall demand in the economy decreases.
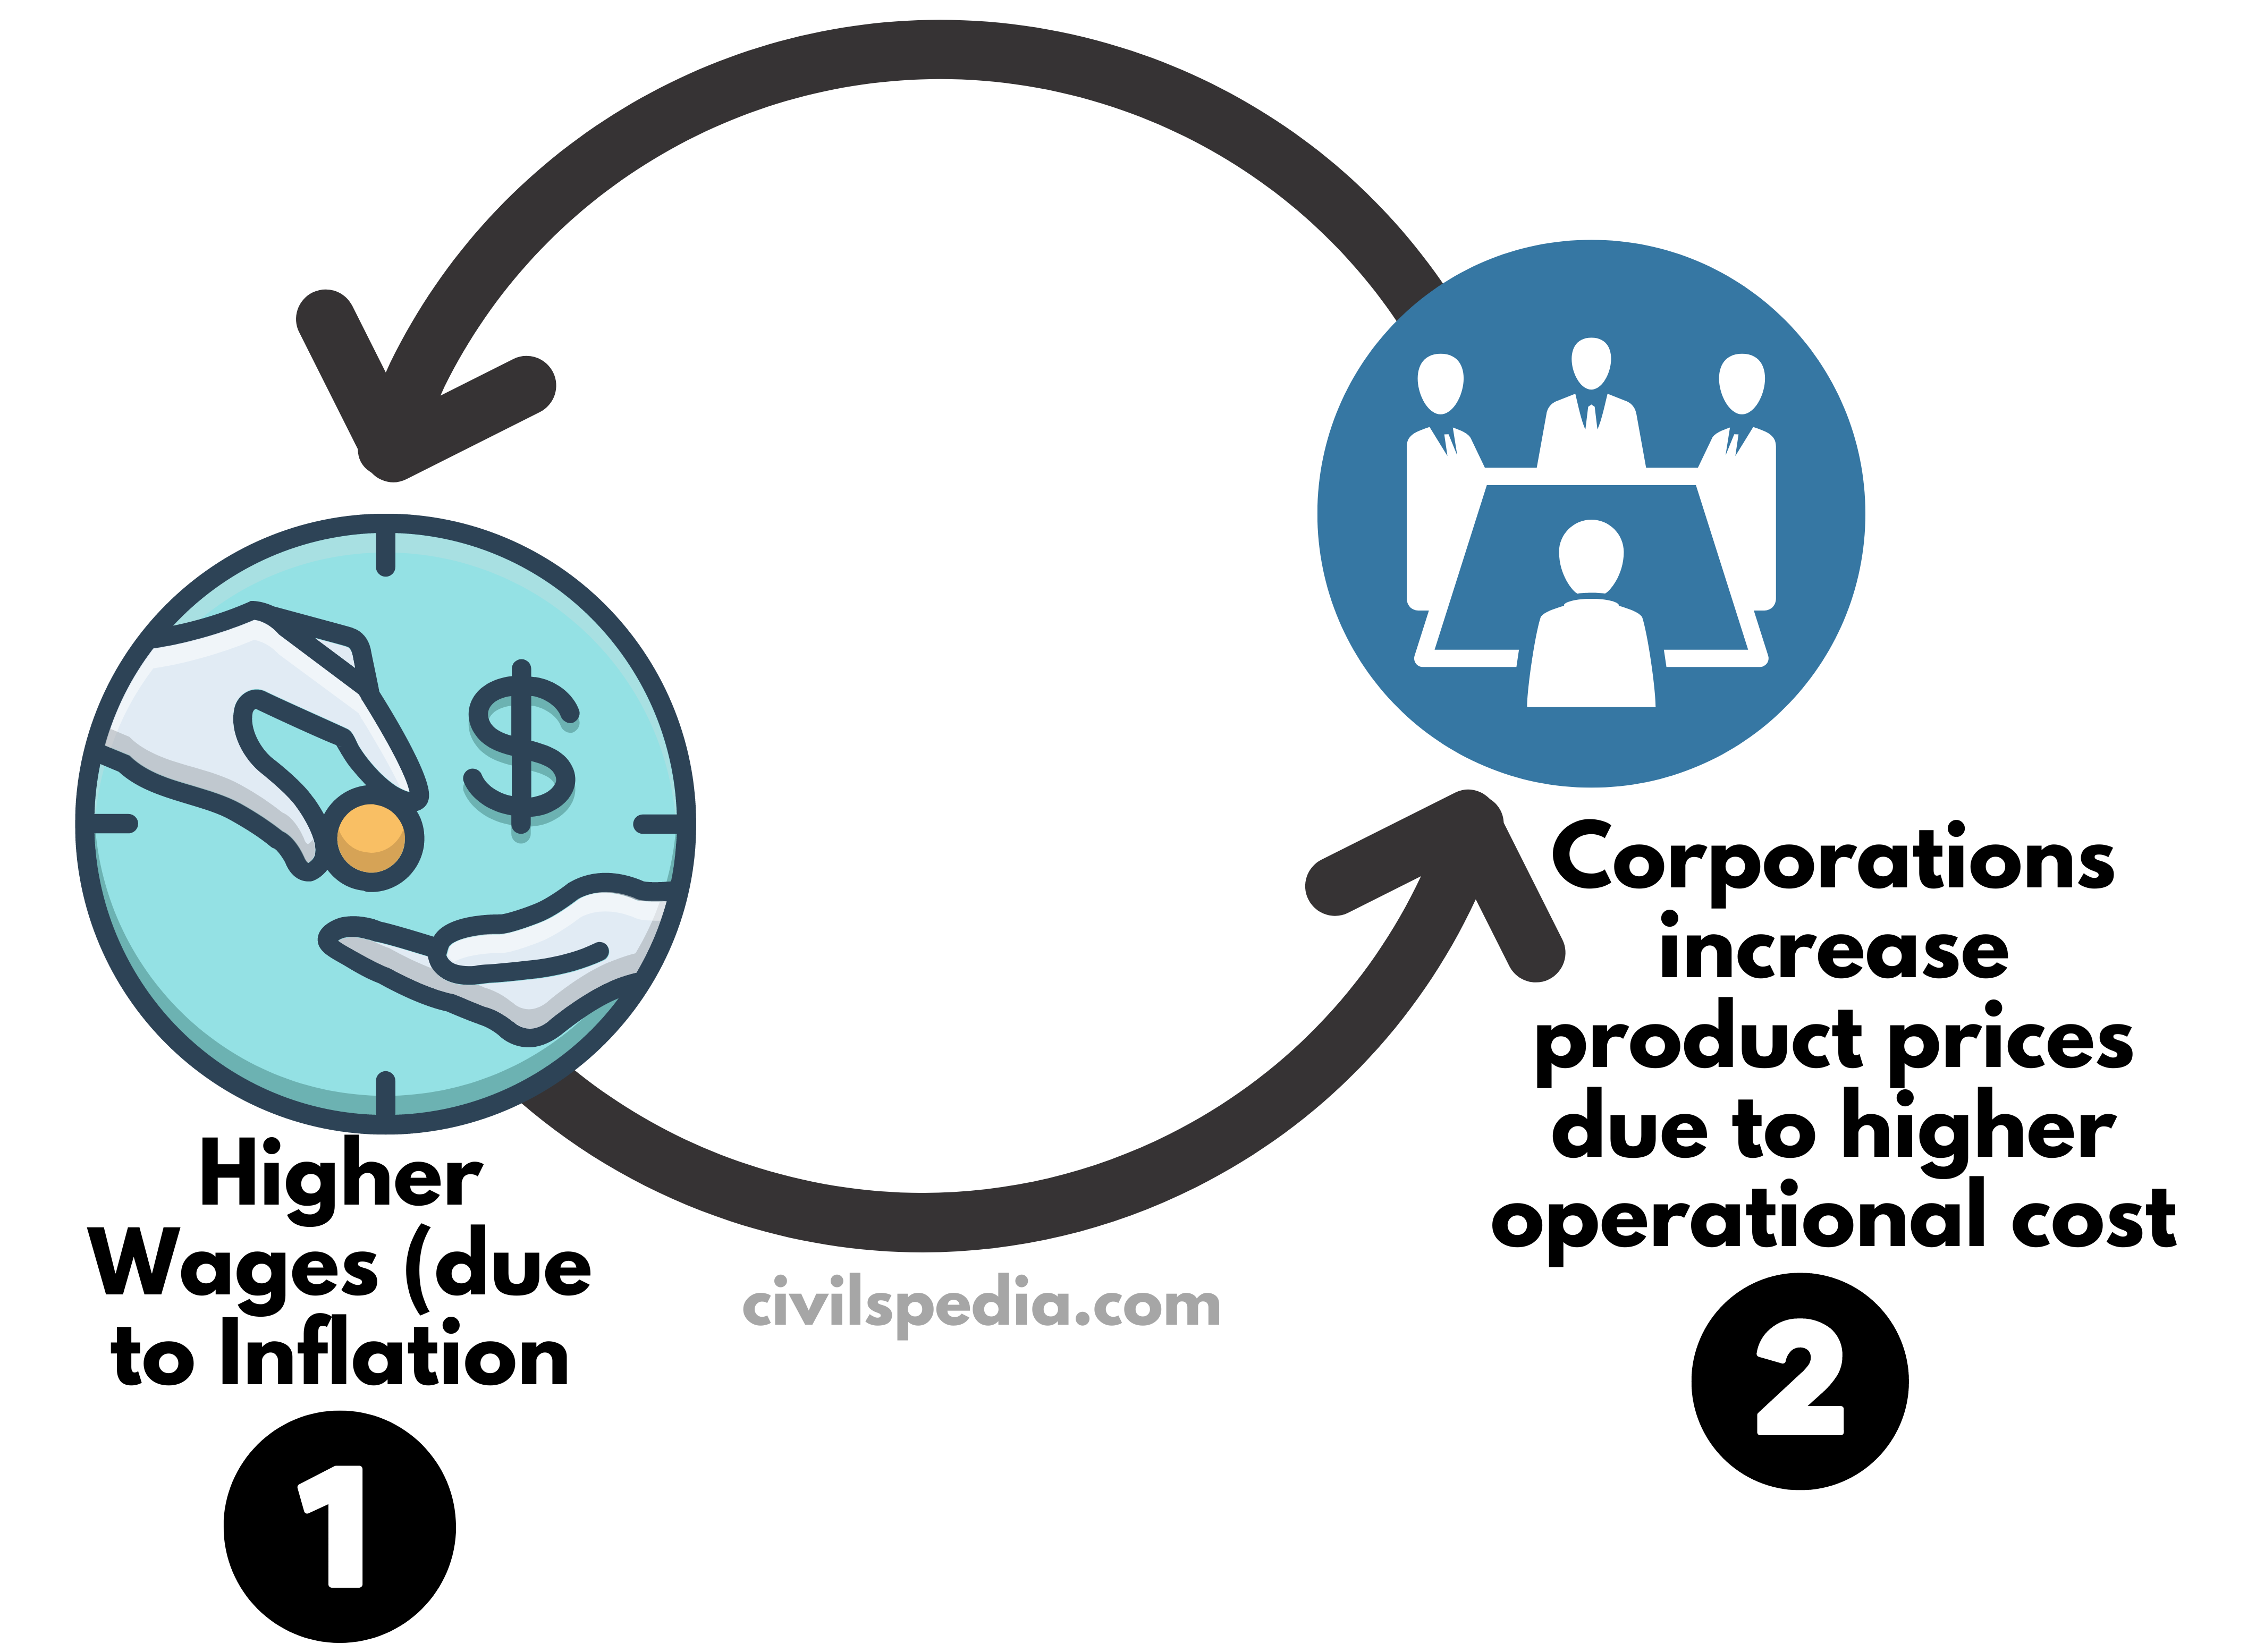
- Wage-Inflation Spiral: Persistent inflation impacts the psychology of people who, in turn, demand higher wages. It starts the Wage-Inflation spiral. The companies further increase the price as the cost of their operations increases due to higher wages.
Inflation benefits the following groups
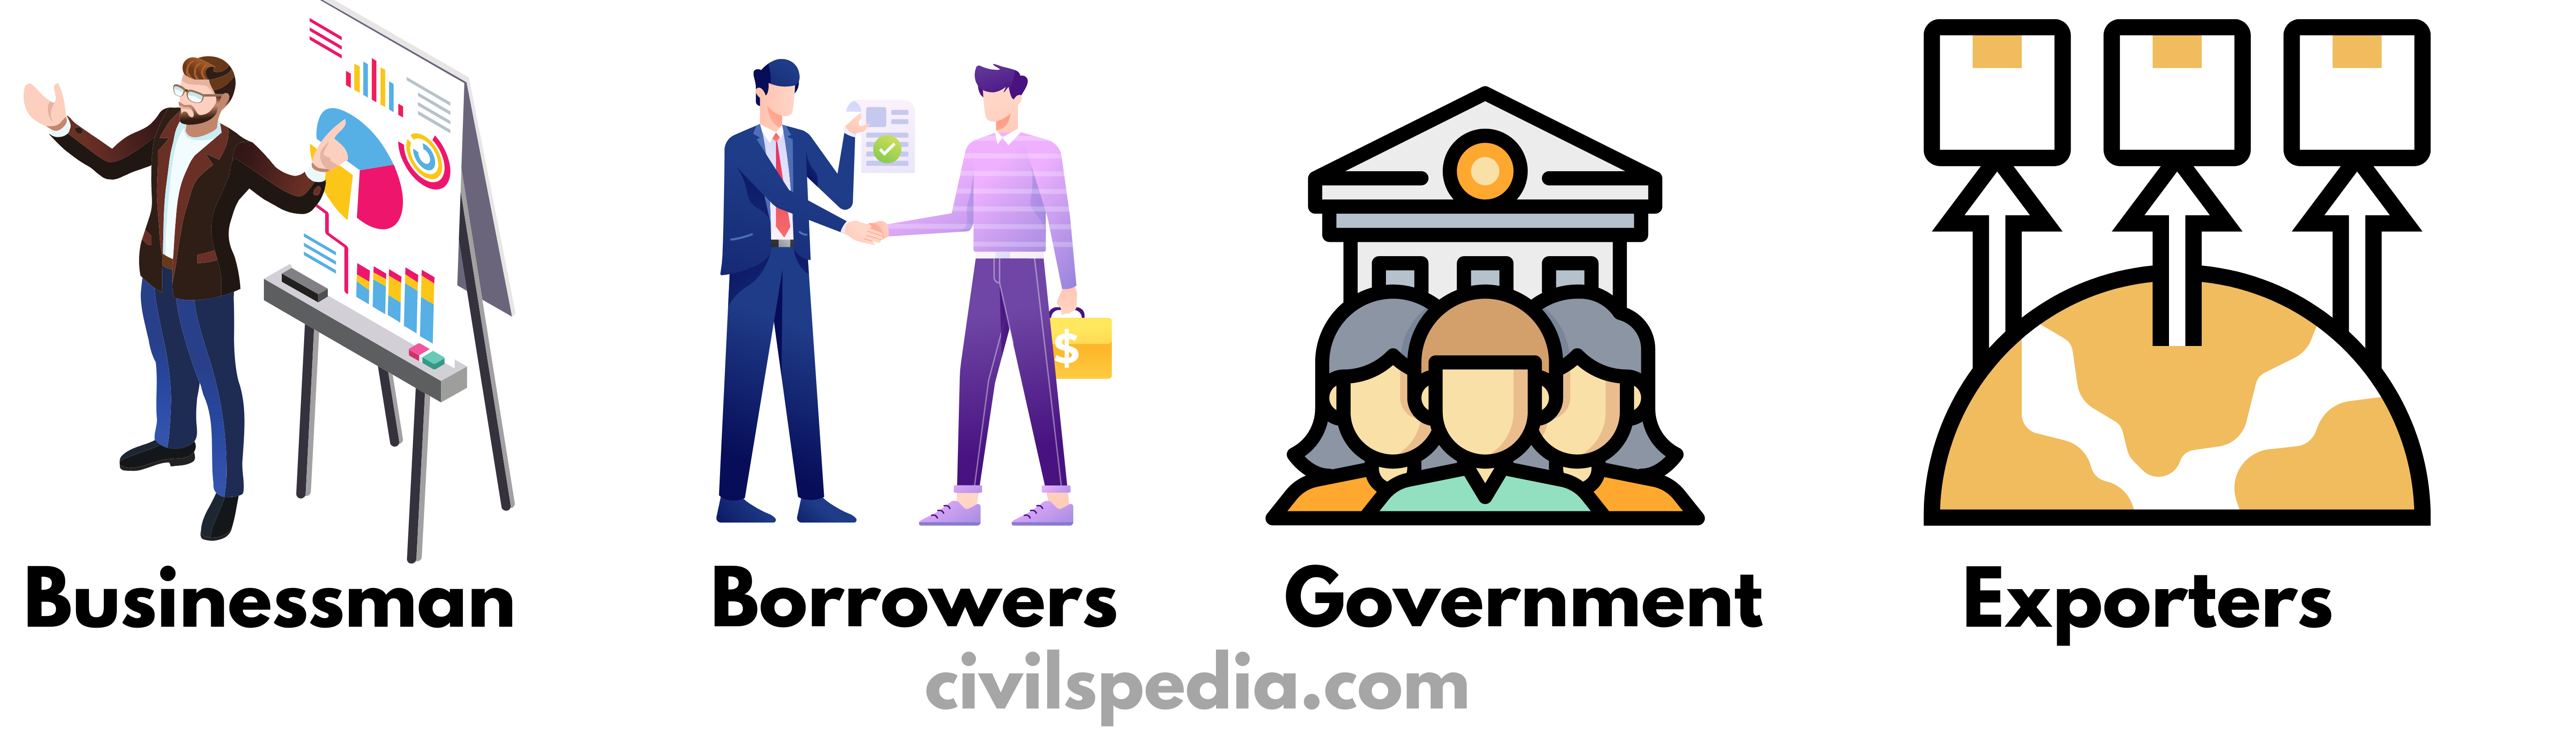
- Businessmen make huge profits because the final product price rises faster than the price of raw materials.
- Borrowers benefit as they have to return the same money, but it has less purchasing power.
- Government is the biggest beneficiary as it is the biggest borrower. Due to inflation, they have to pay back lesser in real terms.
- Exporters benefit because the depreciation of currency leads to cheaper exports.
Is inflation good or bad?
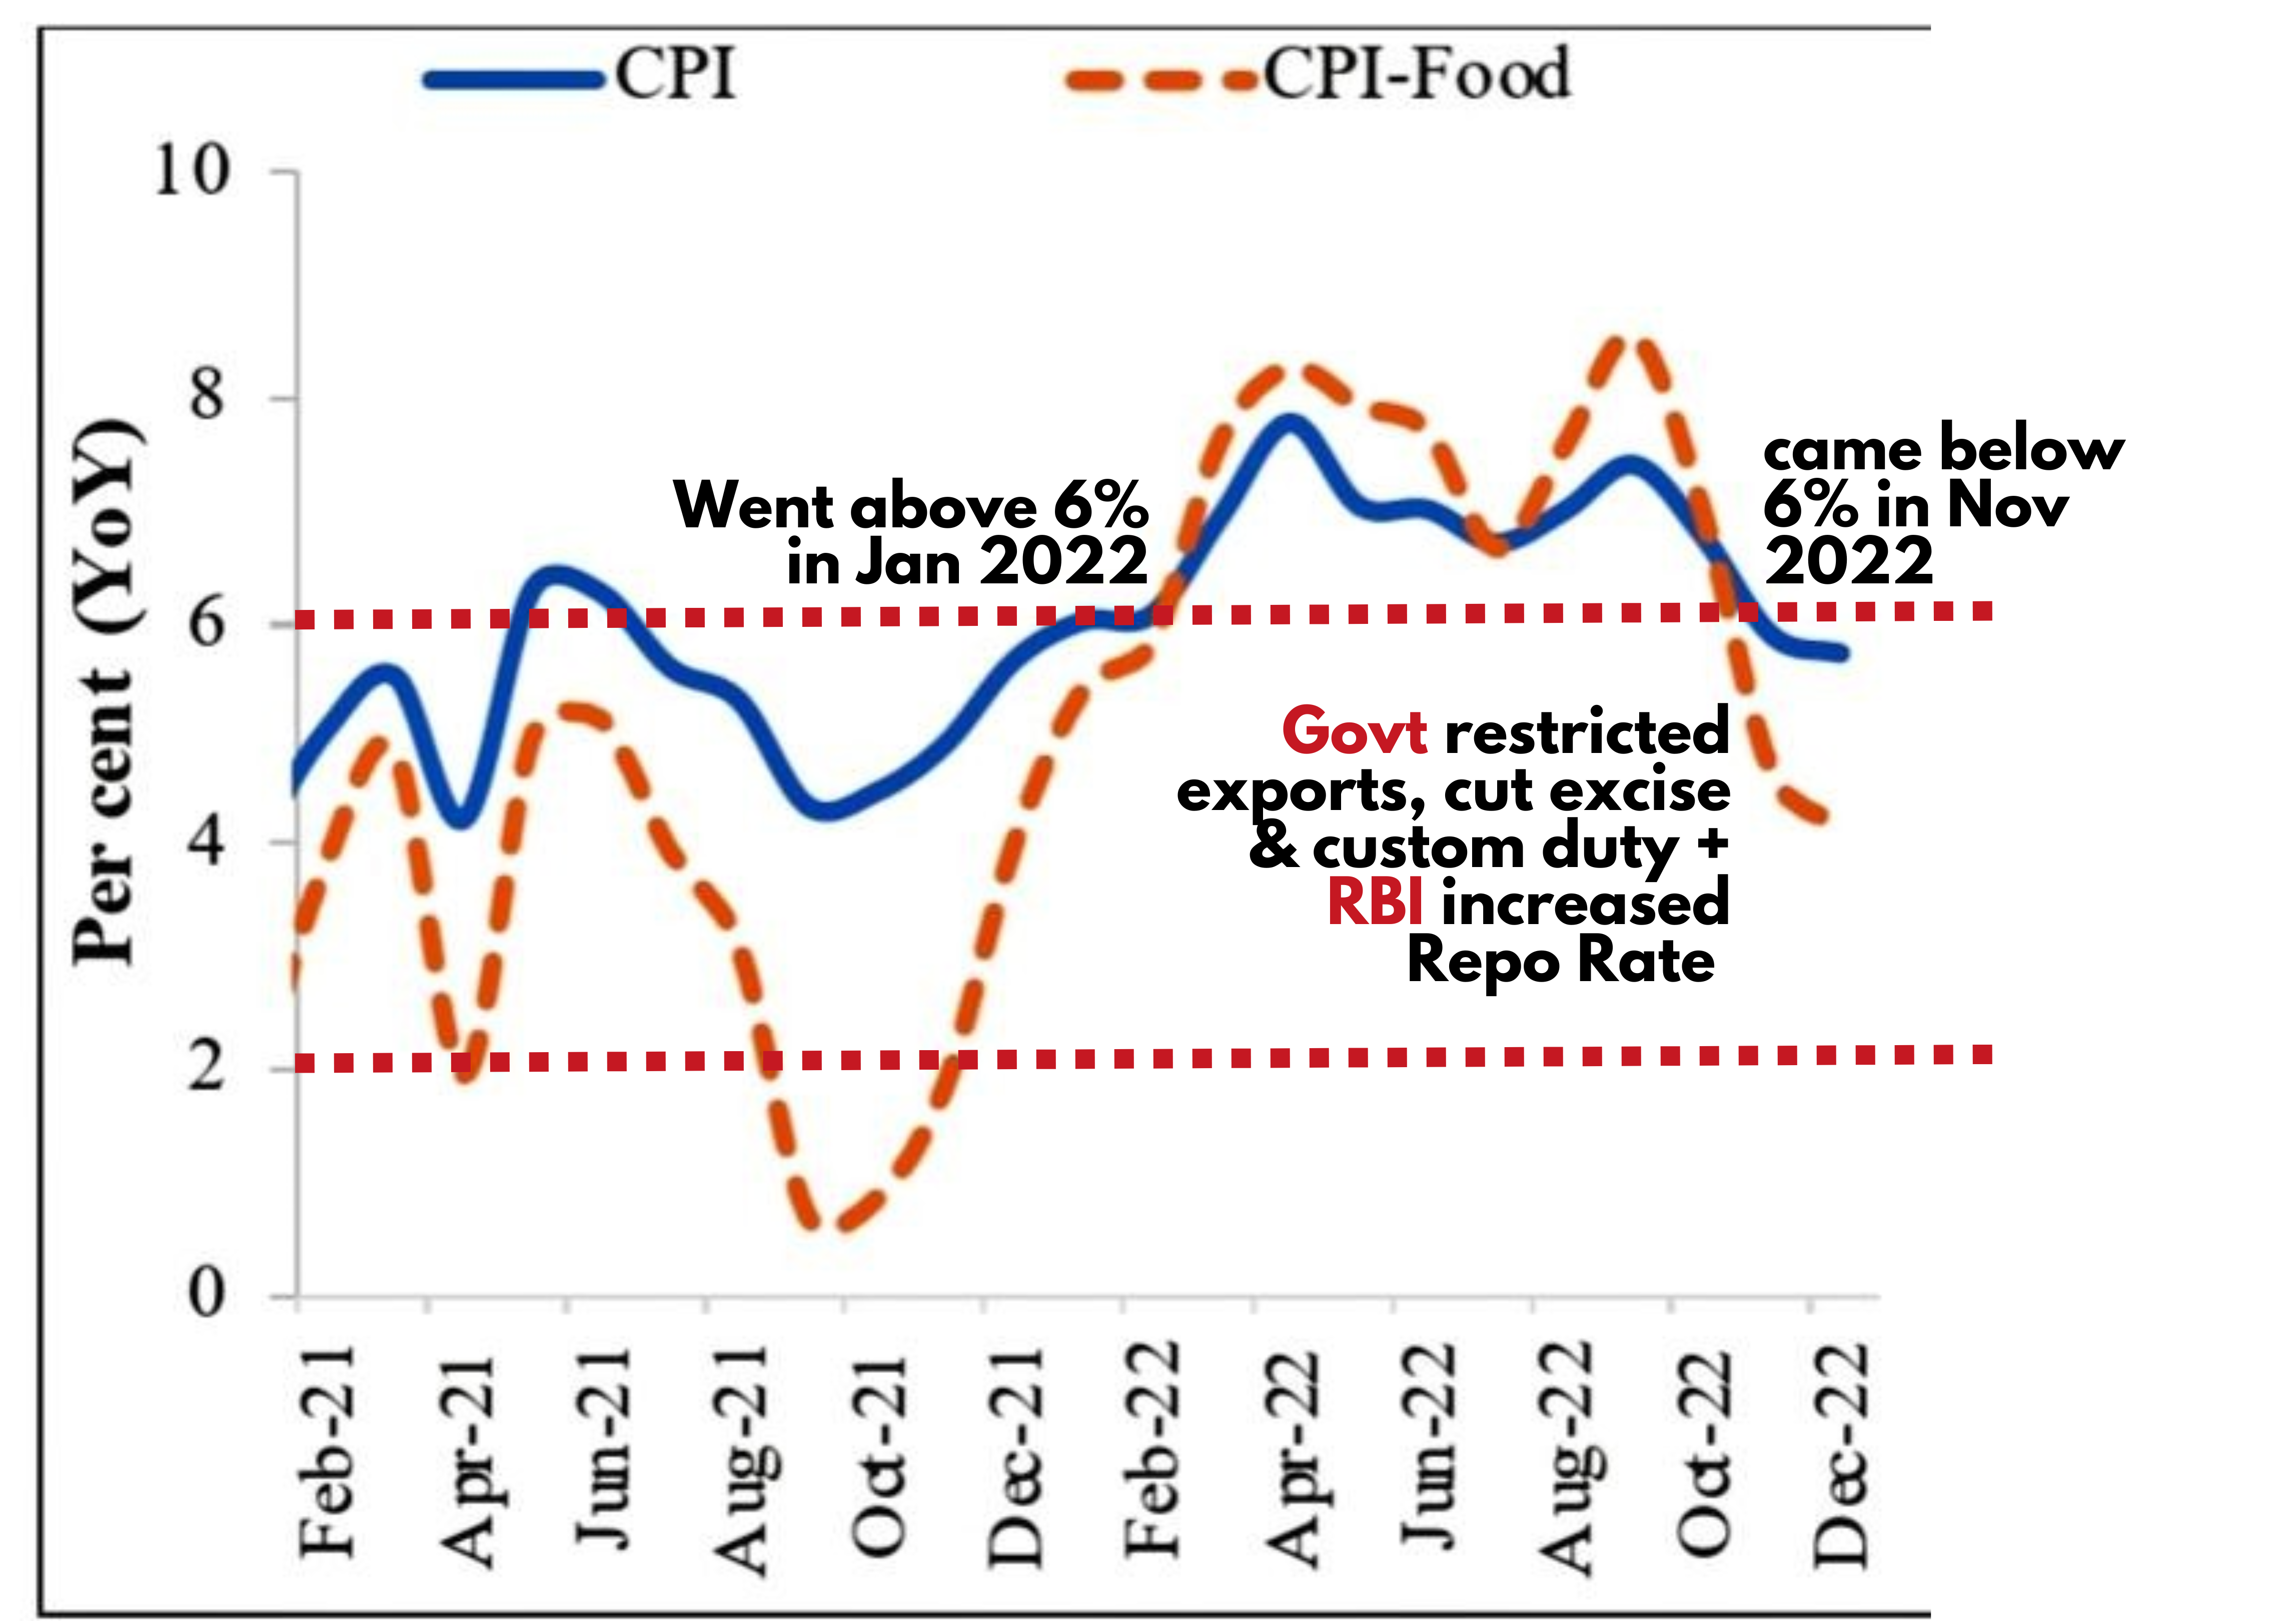
Controlled inflation (between 2 to 6% for India) is desirable & good for the economy. This is because producers & traders make reasonable profits encouraging them to invest. But inflation above safe levels, i.e. 6% for India, hurt the economy negatively.
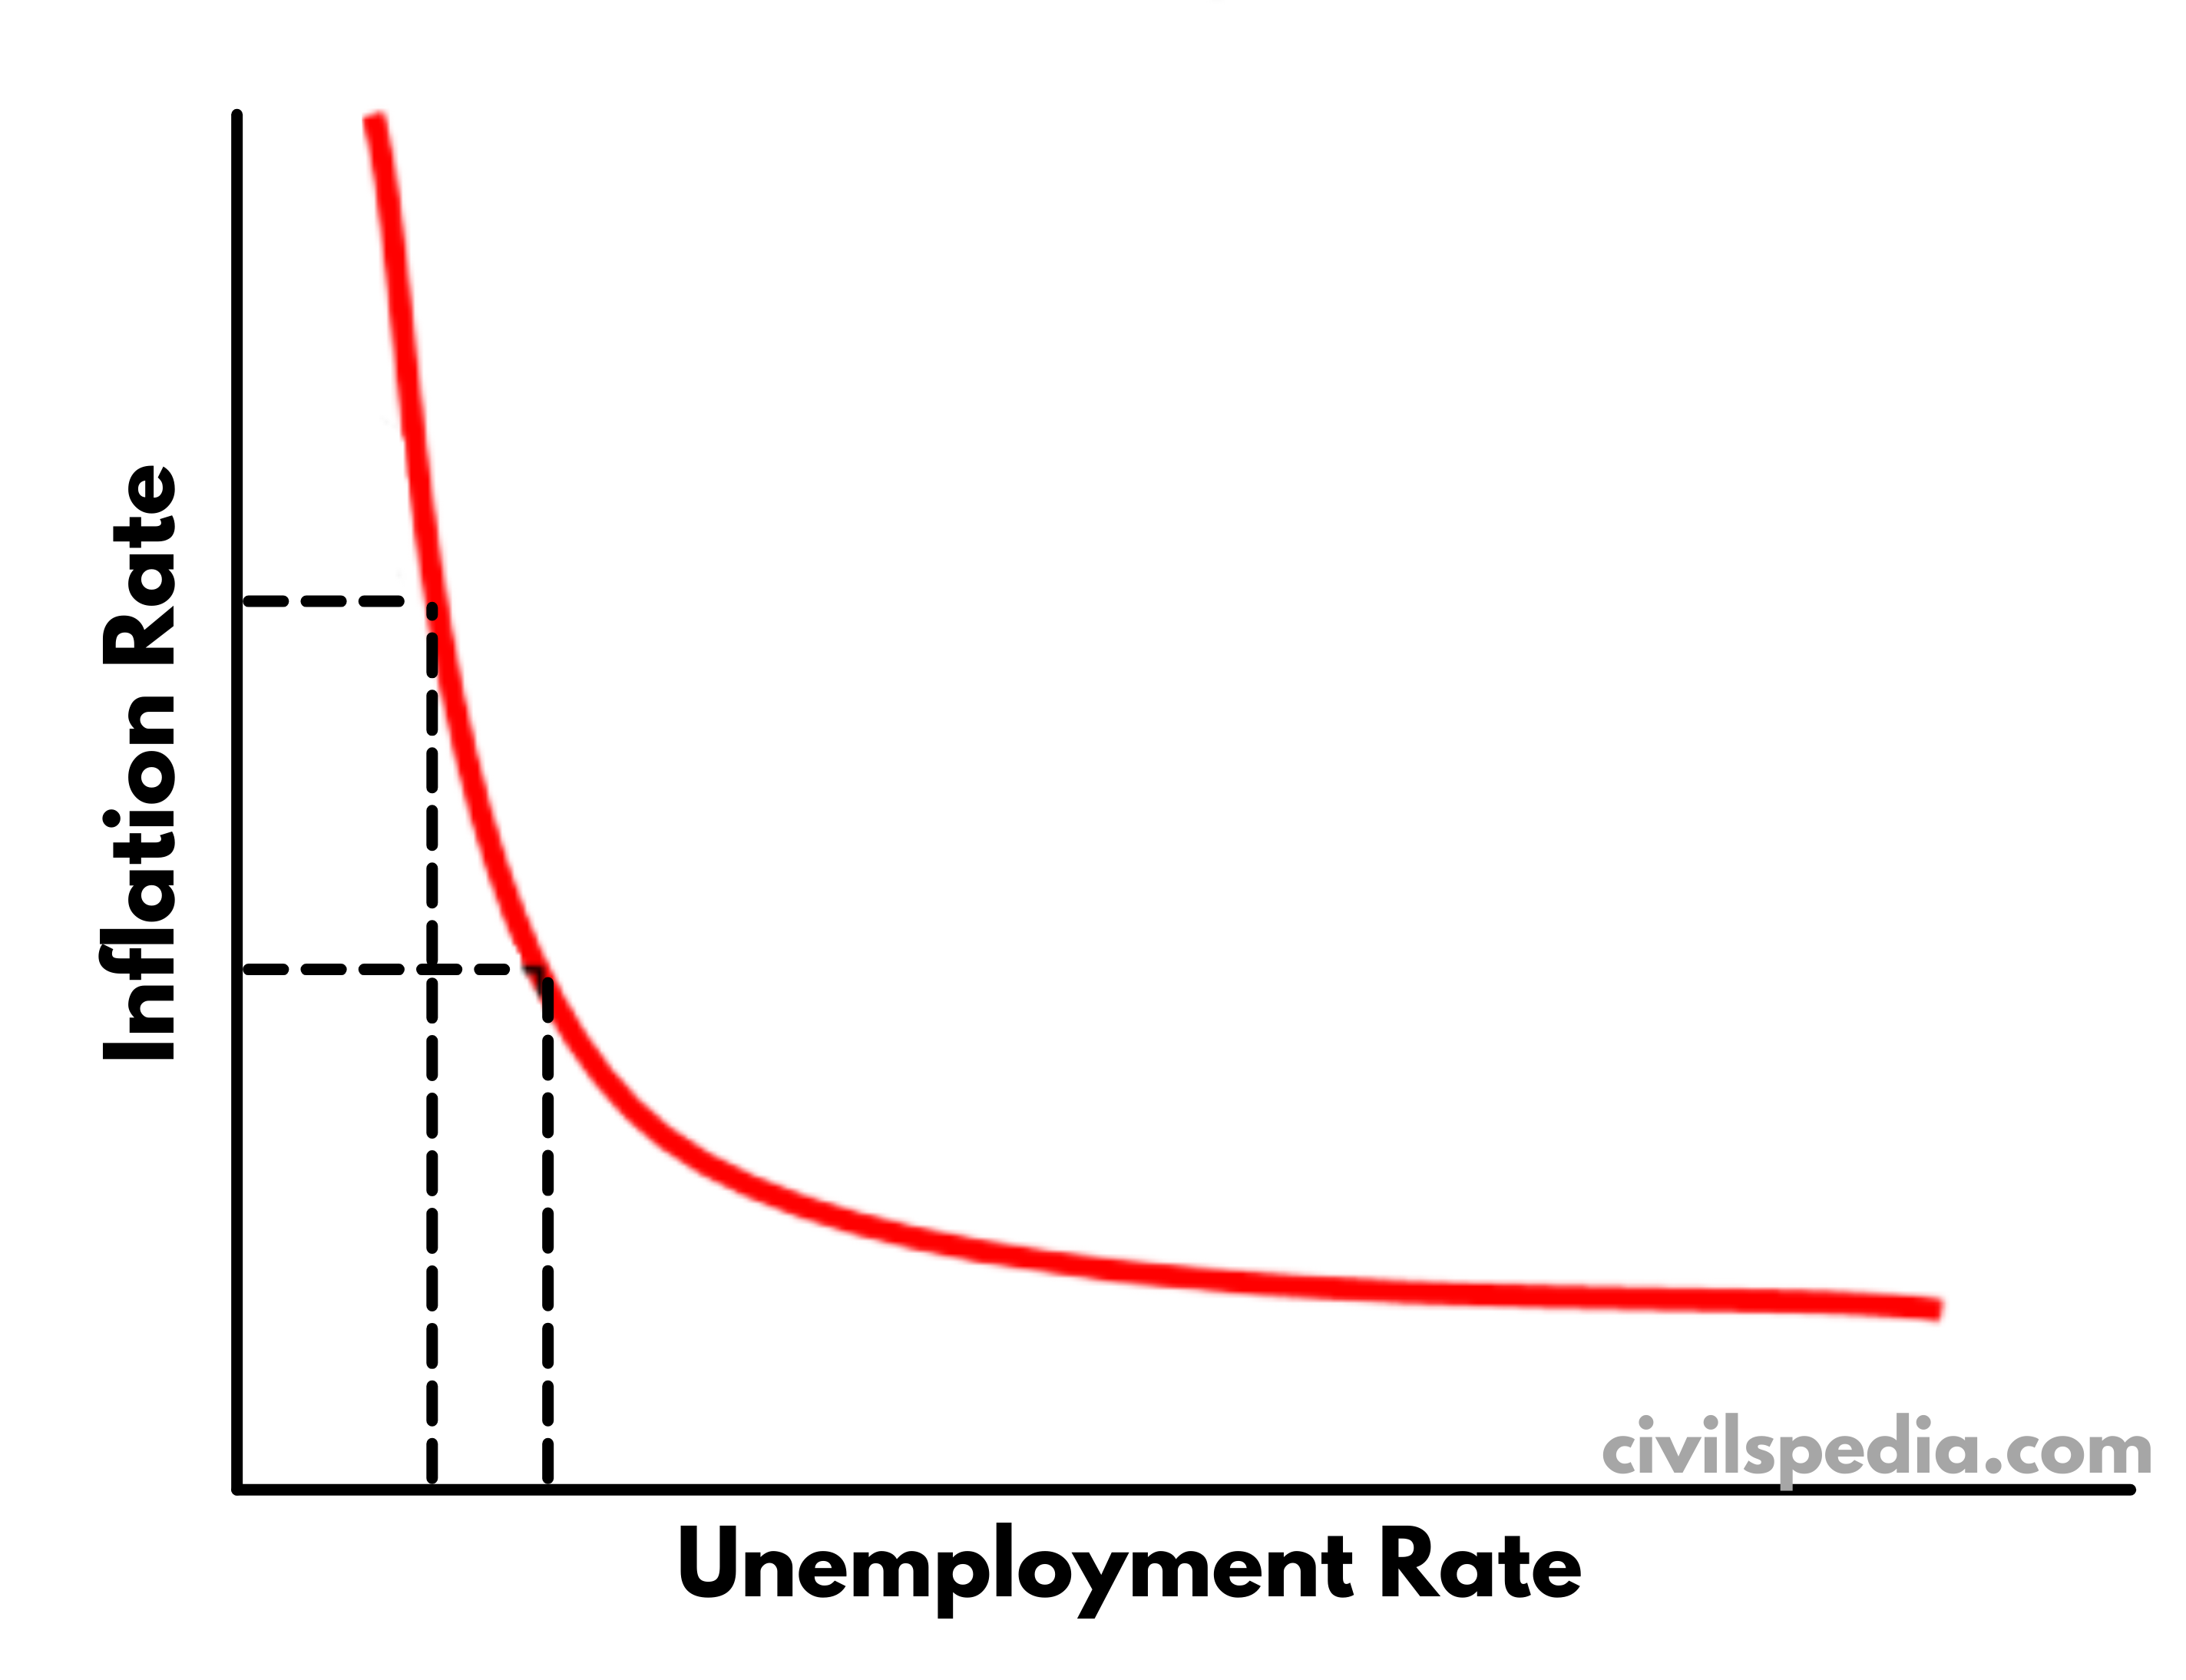
Philip’s Curve
- It is a graphic curve showing a relationship between inflation and unemployment.
- Economist William Philips said there is a ‘trade-off’ between inflation and unemployment.
- When inflation increases correspondingly, unemployment decreases (because firms, enticed by higher prices, try to ramp up production by recruiting more people.)
- When inflation decreases, unemployment increases.
- This idea became popular in the early 1960s when economists started to argue that unemployment could be checked forever at the cost of slightly higher inflation. Central Banks around the world began to make monetary policies accordingly.
- But in the 1970s, this idea was challenged because countries that followed the above policies suffered high inflation as well as unemployment in the long run. American economists Milton Friedman and Edmund Phelps argued that the trade-off between inflation and unemployment was only short-term. Once people expect higher inflation, they start to demand higher wages, and thus unemployment will rise back to its ‘natural rate’.
Index Theory
- Inflation means a general rise in the price of goods and services. But rise against what? There should be some Base Year for that against which increases in prices of goods and services are measured.

- The relative importance of all the goods and services is not the same. We cant equate rice and onion with shoes. Shoes are bought occasionally, but eatables are bought frequently, and their price rise hurts more. Hence, weight has to be assigned to all goods and services according to their relative importance.
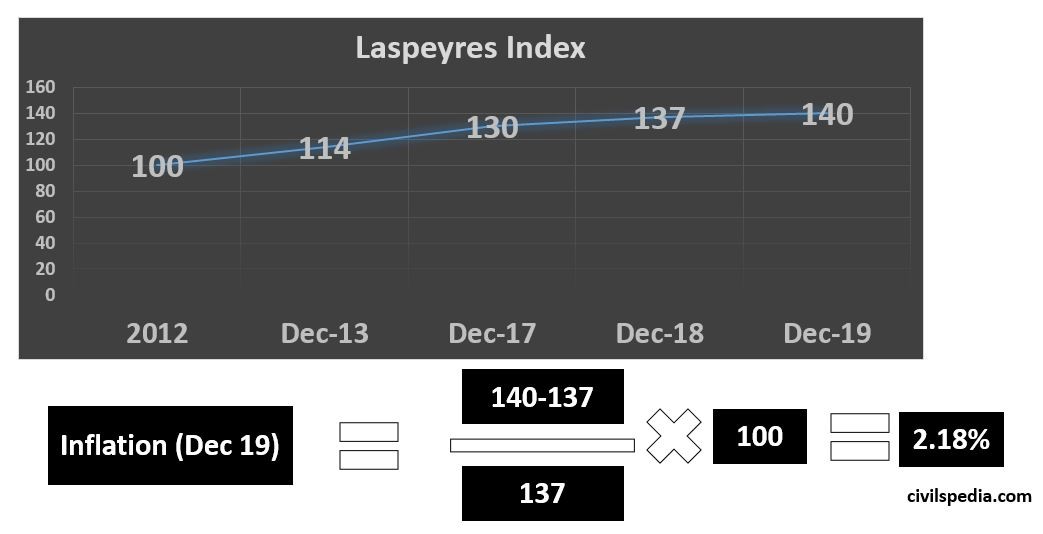
- Hence, the Laspeyres formula is used to calculate WPI, CPI and IIP index, which is a weighted arithmetic mean of a basket of commodities that tracks price/production level against the base year.
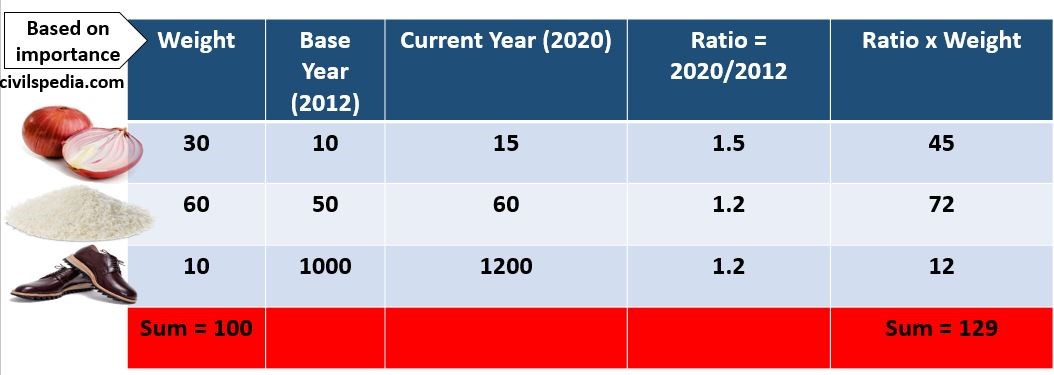
- The inflation rate is calculated using a change in Laspeyres Index in a particular month of the year compared to that of the same month of the previous year.
Base Years
Base Years for different Indexes are different
| Base Year | Who | |
| CPI | 2012 | NSO (under MoSPI) |
| WPI | 2011 | Economic Advisor, DPIIT |
| IIP | 2011 | NSO |
| Side Note: GDP | 2011 | NSO |
Index 1: Consumer Price Index (CPI)
- CPI measures inflation using the weighted average of prices of a basket of consumer goods and services, such as transportation, food, and medical care.
- There are different types of CPIs released by various agencies, as given below.
| Released by | Base Year | |
| CPI (1) Rural 2) Urban 3) All India) | NSO | 2012 |
| Consumer Food Price Index (CFPI) | NSO | 2012 |
| CPI (Industrial Worker) | Labour Ministry | 2016 |
| CPI (Agricultural Labourer) | Labour Ministry | 1986 |
| CPI (Rural Labourer) | Labour Ministry | 1986 |
CPI (All India)
- CPI (All India) is released by NSO with the base year of 2012.
- It is the headline CPI inflation of India.
- Monetary Policy Committee uses CPI (All India) under its Inflation Targeting Mechanism.
CPI (Rural) and CPI (Urban)
- Since the basket of goods used by people living in rural and urban areas differ, NSO also releases CPI (Rural) and CPI (Urban) to show the inflation in these areas separately.
- These are also released by NSO, with 2012 as the base year. But, weightage assigned to different goods varies in accordance with the relative importance of goods used in these areas.
Basket of Goods and Weightage assigned
| Component | CPI (All India) weight | CPI (Rural) weight | CPI (Urban) weight |
| Food and beverages | 45.86 | 34.18 | 36.29 |
| Pan, tobacco and intoxicants | 2.35 | 3.26 | 1.36 |
| Clothing and Footwear | 6.53 | 7.36 | 5.57 |
| Housing | 10.07 | —- | 21.67 |
| Fuel and Light | 6.84 | 7.94 | 5.50 |
| Miscellaneous | 28.32 | 27.26 | 29.53 |
| Total | 100 | 100 | 100 |
Consumer Food Price Index (CFPI)
- If only the Food Component is seen, we get Consumer Food Price Index (CFPI).
Core Inflation
- CPI minus Food and Fuel component is called Core Inflation.
Trends in CPI in recent times
CPI Old Indexes
1 . CPI-IW
- It is Consumer Price Index for Industrial Workers.
- It is compiled by the Ministry of Labour.
- The base year of CPI (IW) is 2016.
- The basket of goods includes 370 goods.
- Use: It is used as the cost of living index in the organized sector. Dearness Allowance (DA) is calculated using this.
2 . CPI-AL
- It is Consumer Price Index for Agricultural Labourers.
- It is compiled by the Ministry of Labour.
- The base year of CPI (AL) is 1986 (the plan is to change it to 2019).
- The basket of goods includes 60 goods.
- Use: MNREGA wages are indexed to this.
3 . CPI – RL
- It is Consumer Price Index for Rural labourers.
- It is compiled by the Ministry of Labour.
- The base year of CPI (AL) is 1986 (the plan is to change it to 2019).
Side Topic: Price Stabilization Fund
- The government started the Price Stabilization Fund with a corpus of ₹500 Crore in 2015 to fight Food Inflation.
- Under this, Union gives interest-free advances to states to buy onion, potatoes, pulses etc., from farmers and maintain their supply in urban areas to stabilize prices.
Thalinomics: Economics of a plate of food in India
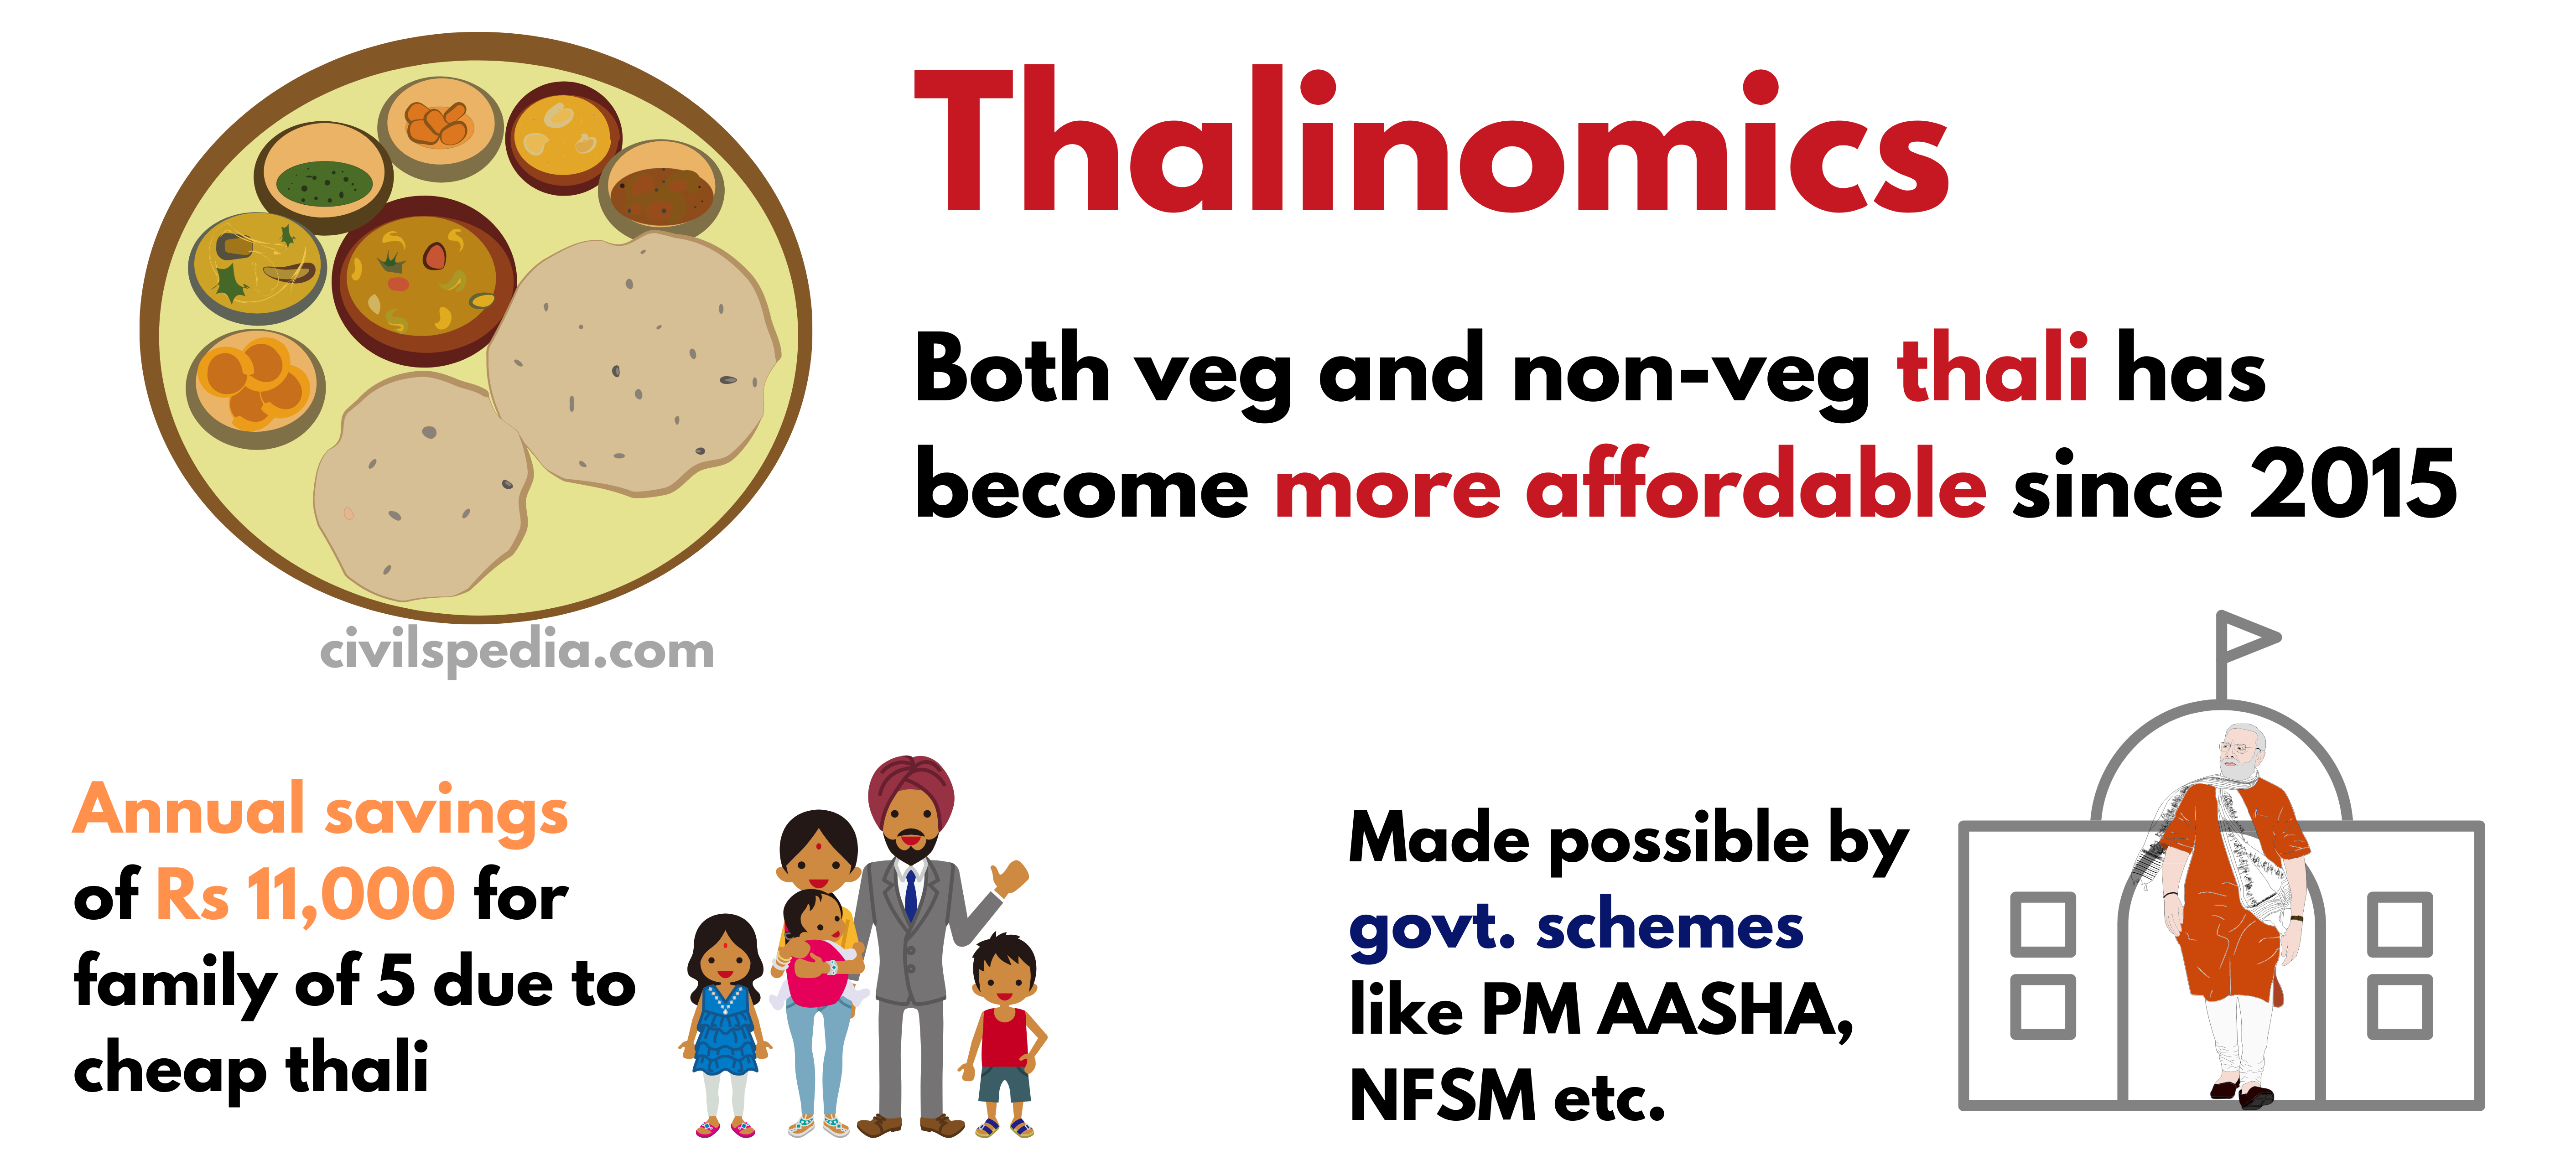
- Thalinomics refers to the economics of a plate of food in India.
- According to Economic Survey (2020), the price of Thali has reduced across all regions for both vegetarian and non-vegetarian thalis from 2015 to 2018. Hence, Thali’s affordability has increased for low-income families. The average yearly gain to the household of 5 individuals due to reduced prices is around Rs. 11,000.
- The affordability of Thalis vis-à-vis a day’s worker’s pay has improved over time, indicating improved welfare of the ordinary person.
- The decrease in the price is due to various reform measures taken in 2015 and afterwards, such as Pradhan Mantri Annadata Aay SanraksHan Abhiyan (PM-AASHA), Pradhan Mantri Krishi Sinchai Yojana (PMKSY), Pradhan Mantri Fasal Bima Yojana (PMFBY), Soil Health Card, e-NAM, National Food Security Mission (NFSM) and National Food Security Act (NFSA).
Index 2: Wholesale Price Index
- The wholesale Price Index (WPI) is the price of a representative basket of wholesale goods. It reflects changes in the average prices of goods at the wholesale level — commodities sold in bulk and traded between businesses or entities rather than goods bought by consumers.
- It is released by Economic Advisor to the Department for Promotion of Industry and Internal Trade (DPIIT) under the Commerce Ministry.
- In 2017, the Base year was changed to 2011 (earlier was 2004).
- The basket of goods and the weight assigned to them while calculating WPI is as follows
| Component | Weightage |
| Manufactured Products | 64.23 |
| Primary Articles | 22.62 |
| Fuel and Power | 13.15 |
- Earlier, indirect taxes were also counted in price while calculating the price. Other countries ignore indirect tax and transportation while measuring Producers Price Index (PPI). But in India, by including Indirect Taxes, we get inflation wrt wholesale buyers and not producers. In 2017, India fixed this anomaly, and now, while calculating WPI, the price without indirect tax is taken into consideration (although the Cost of Transportation is still there).
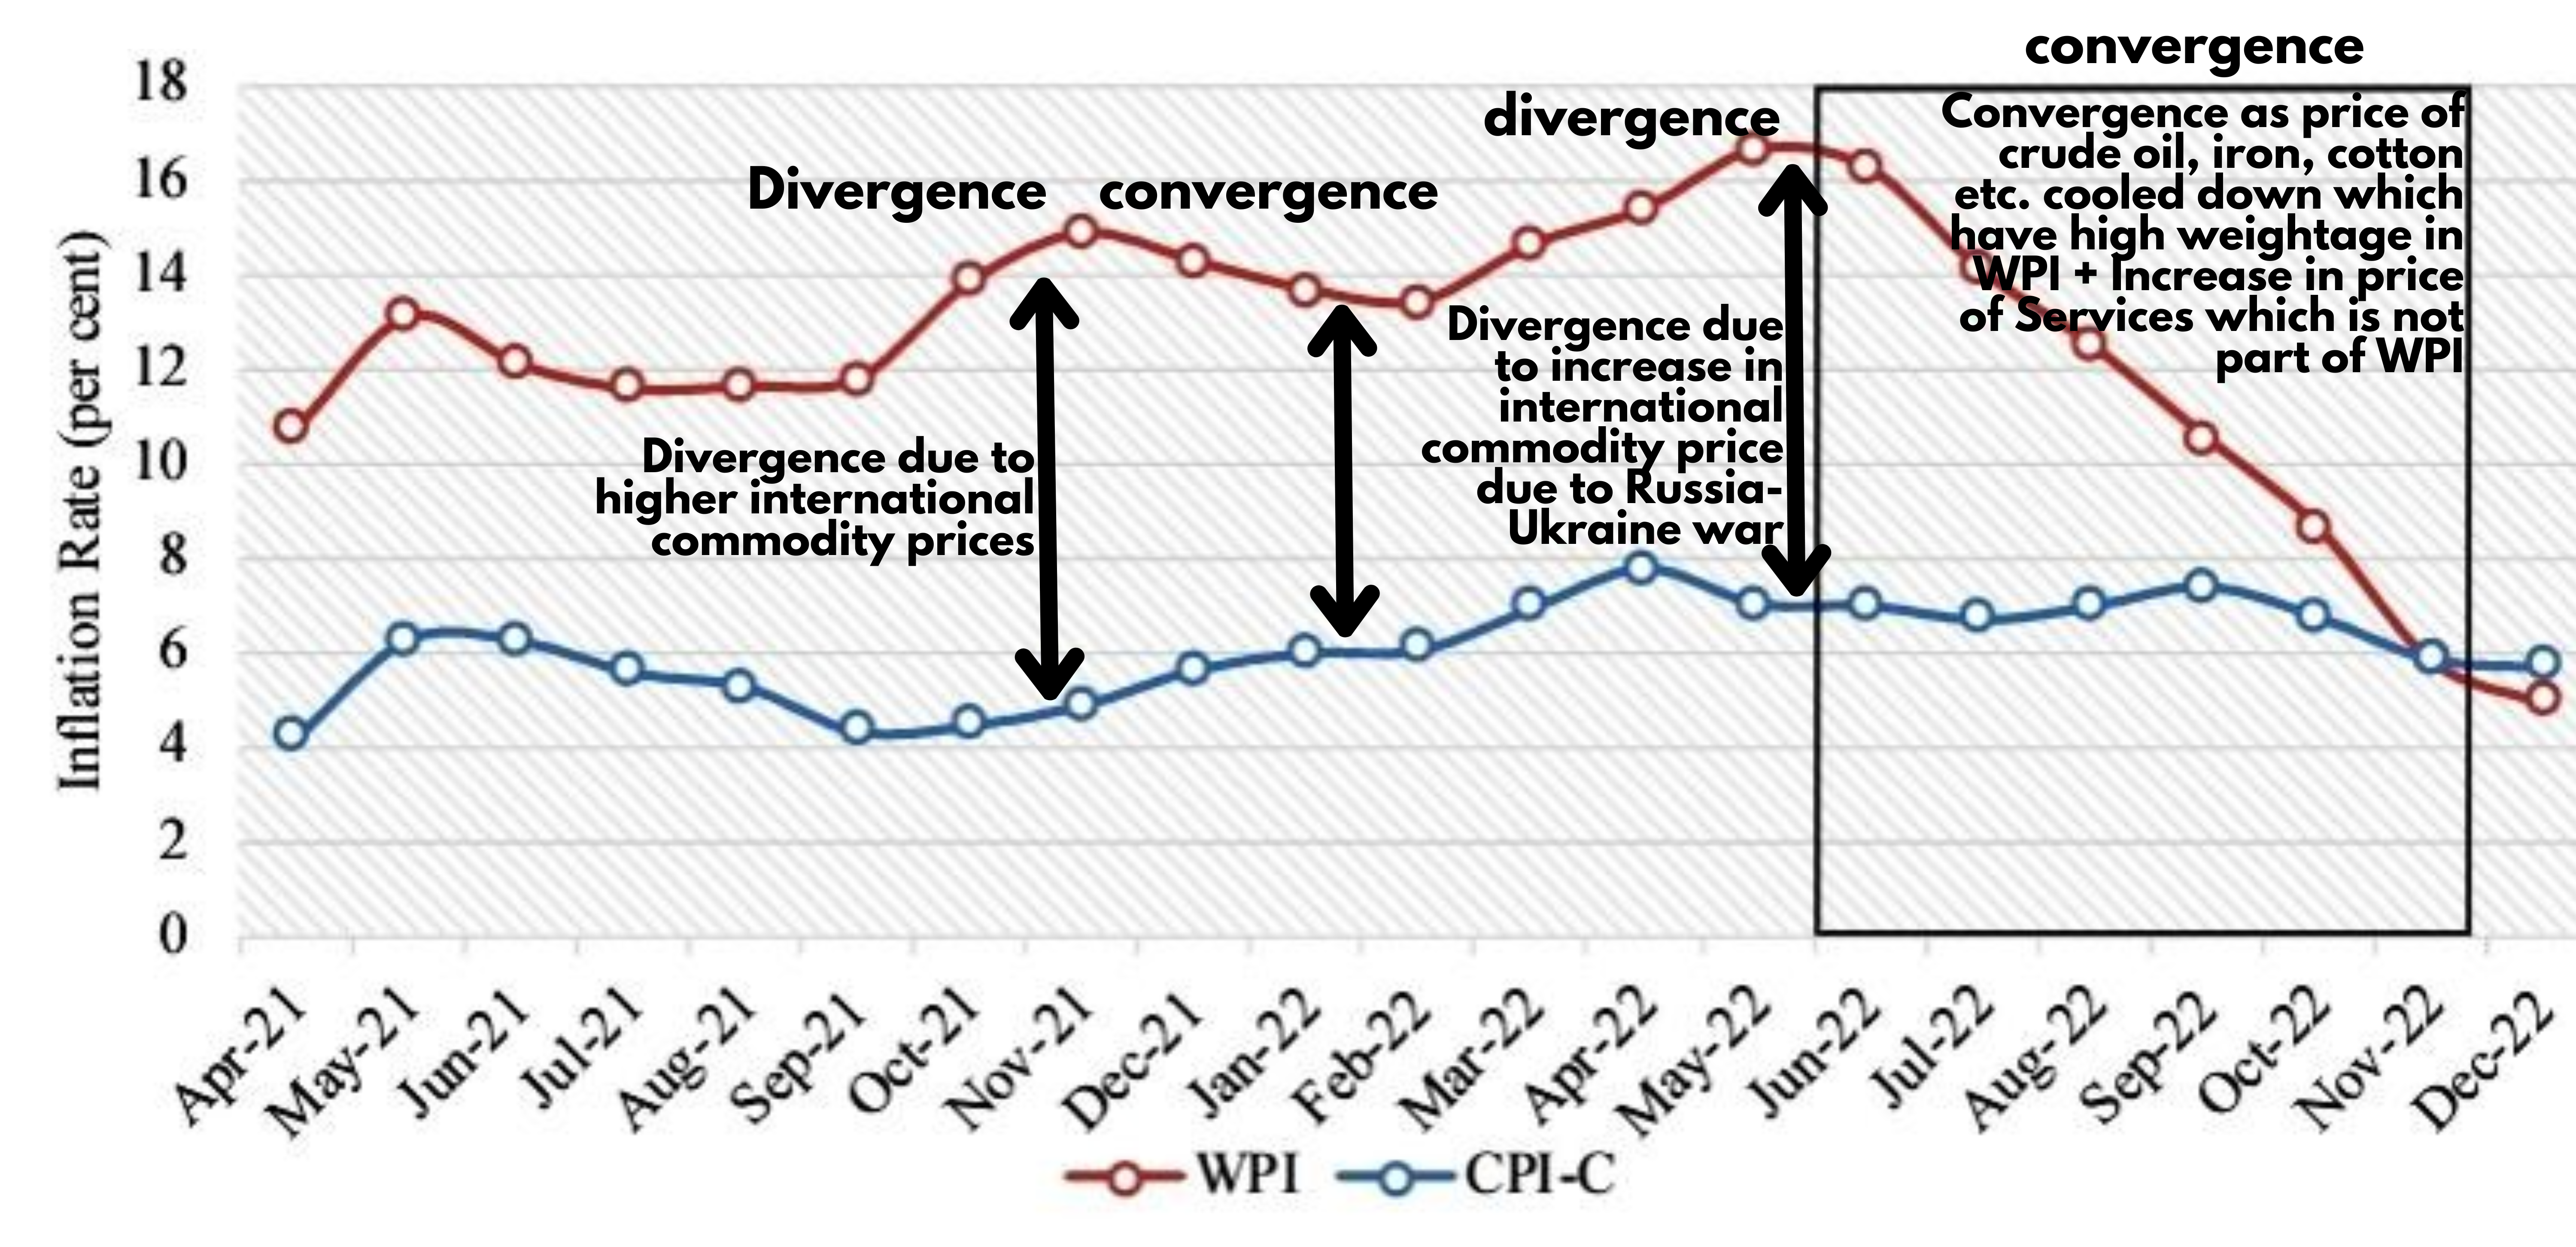
CPI-WPI Divergence and Convergence
It can happen due to the following reasons
- The changes in international prices pass on to Wholesale Prices (reflected in WPI) quickly but impact the retail prices (reflected in CPI) with a lag. Hence, there can be a wedge between both indices.
- Secondly, the composition and weight assigned to different commodities differ in both indices.
Index 3: Index of Industrial Production (IIP)
- IIP is a monthly index prepared by NSO that tracks manufacturing activity in different sectors of an economy.
- Its Base Year is 2011.
- Various components and the weight assigned to them are as follows
| Manufacturing | 78% |
| Mining | 14% |
| Electricity | 8% |
- Another way in which IIP is categorised is USE BASED CATEGORISATION. Weightage given to different categories in this is as follows
| Primary goods | 34.22% |
| Intermediate goods | 17.22% |
| Capital goods | 8.22% |
| Infrastructure goods | 12.34% |
| Consumer durables | 12.84% |
| Consumer nondurables | 15.33% |
Index of 8 Core Industries
- Within IIP, 8 industries are considered core industries because they impact all other economic activities.
- Eight Core Industries comprise 40.27 % of the weight of items included in the IIP.
- It comprises eight industries as follows
- Coal (weight: 10.33%)
- Crude Oil (weight: 8.98 %)
- Cement (weight: 5.37%)
- Fertilizer (weight: 2.63 %)
- Electricity (weight: 19.85%),
- Refinery Products (weight: 28.04%)
- Natural Gas (weight: 6.88 %)
- Steel (weight: 17.92%)
Causes of Inflation in recent period
- Global Spillover of Inflation: Advanced Economies followed expansionary monetary and fiscal policies during Covid to increase liquidity in the economy, leading to inflation in Advanced economies. In the globalized world, inflation has been exported to India as well.
- Geopolitical Conflicts: The price of crude oil, natural gas and wheat has soared globally due to conflicts such as the Russia-Ukraine war.
- Fed Tapering: To deal with the high inflation, the Central Bank of the USA and other advanced economies have started hiking the interest rates rapidly. This has led to the flow of capital from Emerging Economies to the US, strengthening the dollar. The strong dollar has made imports expensive, leading to inflation.
- Vagaries of Weather: Unseasonal rains and excessive heat have impacted the yield of agricultural produce in India, leading to food inflation.
- Pent-up Demand: The demand which was suppressed during Covid has rebounded with power increasing the price of goods and services. E.g., housing, travel and tourism etc.
Other Indexes
1. Producer Price Index
- It measures the prices of goods and services as they are sold to the wholesaler by producers.
- It is measured from the perspective of the producer, while WPI is measured from the perspective of the wholesaler.
- It covers both goods and services. (WPI only covers goods)
- It is a better indicator than CPI because CPI includes subsidies provided by the government. Hence, it doesn’t give a clear trajectory of prices of factors of production.
- Abhijit Sen Committee has recommended the introduction of PPI in India.
2. Service Performance Indices
- Any of the above indexes do not implicitly measure inflation of the service sector.
- Chandrasekhar Committee suggested starting Service Performance Indices. As a result, the following indices have been started
| Railways SPIs | Measures Inflation in freight and passenger services |
| Banking SPIs | Measures Inflation in services for which banks charge fees, commissions, brokerage, etc. |
| Postal SPIs | Measures Inflation in services provided by Department of Posts (private postal services are not taken in account) |
| Telecom SPIs | Inflation in cellular services on the basis of TRAI report. |
3. Residex
- Residex is released by the National Housing Bank (NHB).
- It has 2017-18 as its base, and data is released on a quarterly basis.
- It measures inflation in Housing prices in 26 cities.
4. Baltic Dry Index
- Baltic Dry Index is released by London Stock Exchange.
- It measures the cost of transporting raw materials by sea.
- Conclusions that can be drawn from it are
- Increase = World Economy will grow.
- Decrease = World Economy will slowdown.
epic notes thank you so much