Wildlife Protection Schemes
This article deals with ‘Wildlife Protection Schemes – UPSC.’ This is part of our series on ‘Environment’ which is an important pillar of the GS-3 syllabus. For more articles on Science and technology, you can click here.
Introduction
The government is running 3 schemes for wildlife protection
- Integrated Development of Wildlife Habitats (IDWH)
- Project Tiger
- Project Elephant
1. Project Tiger
About Tiger
- Tiger has eight subspecies in total, and three have been extinct of these. Of the five remaining subspecies, only one subspecies is found in India, i.e. Bengal Tiger (Panthera Tigris Tigris).
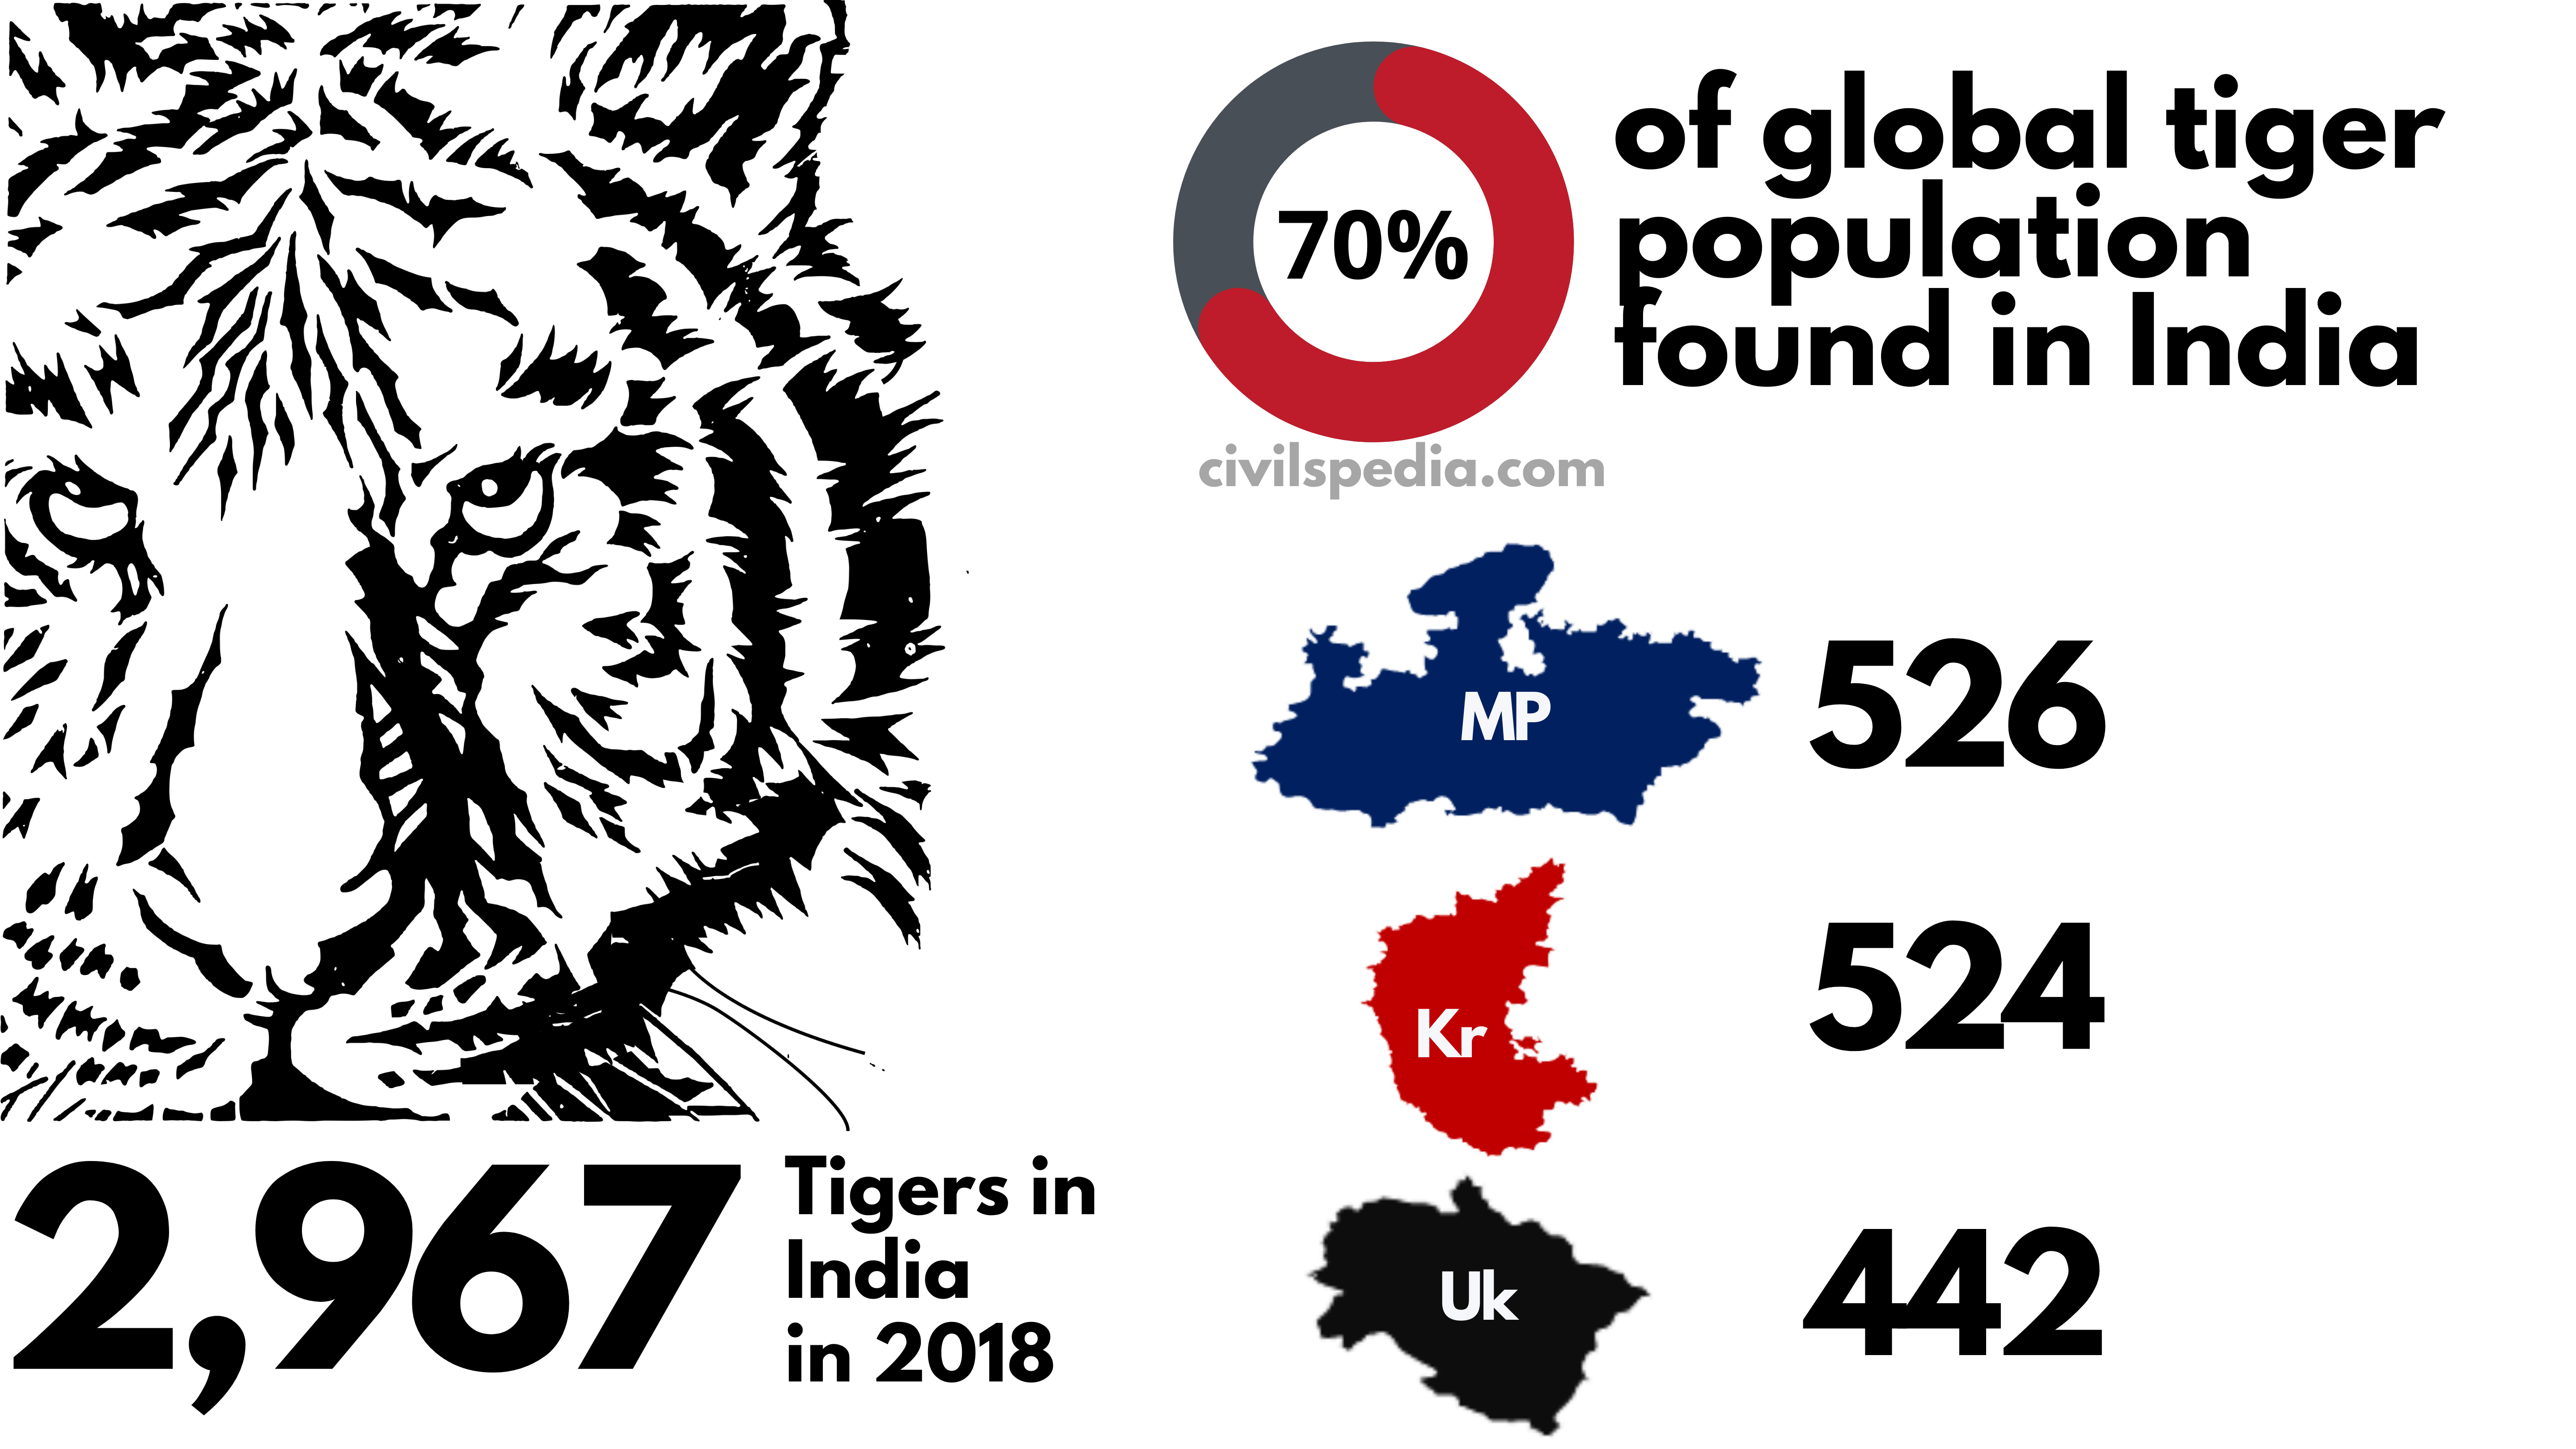
- 70% of the total tiger population in the world is found in India.
- Tiger is the national animal of both India & Bangladesh
- Status of Tiger
- IUCN Red List: Endangered
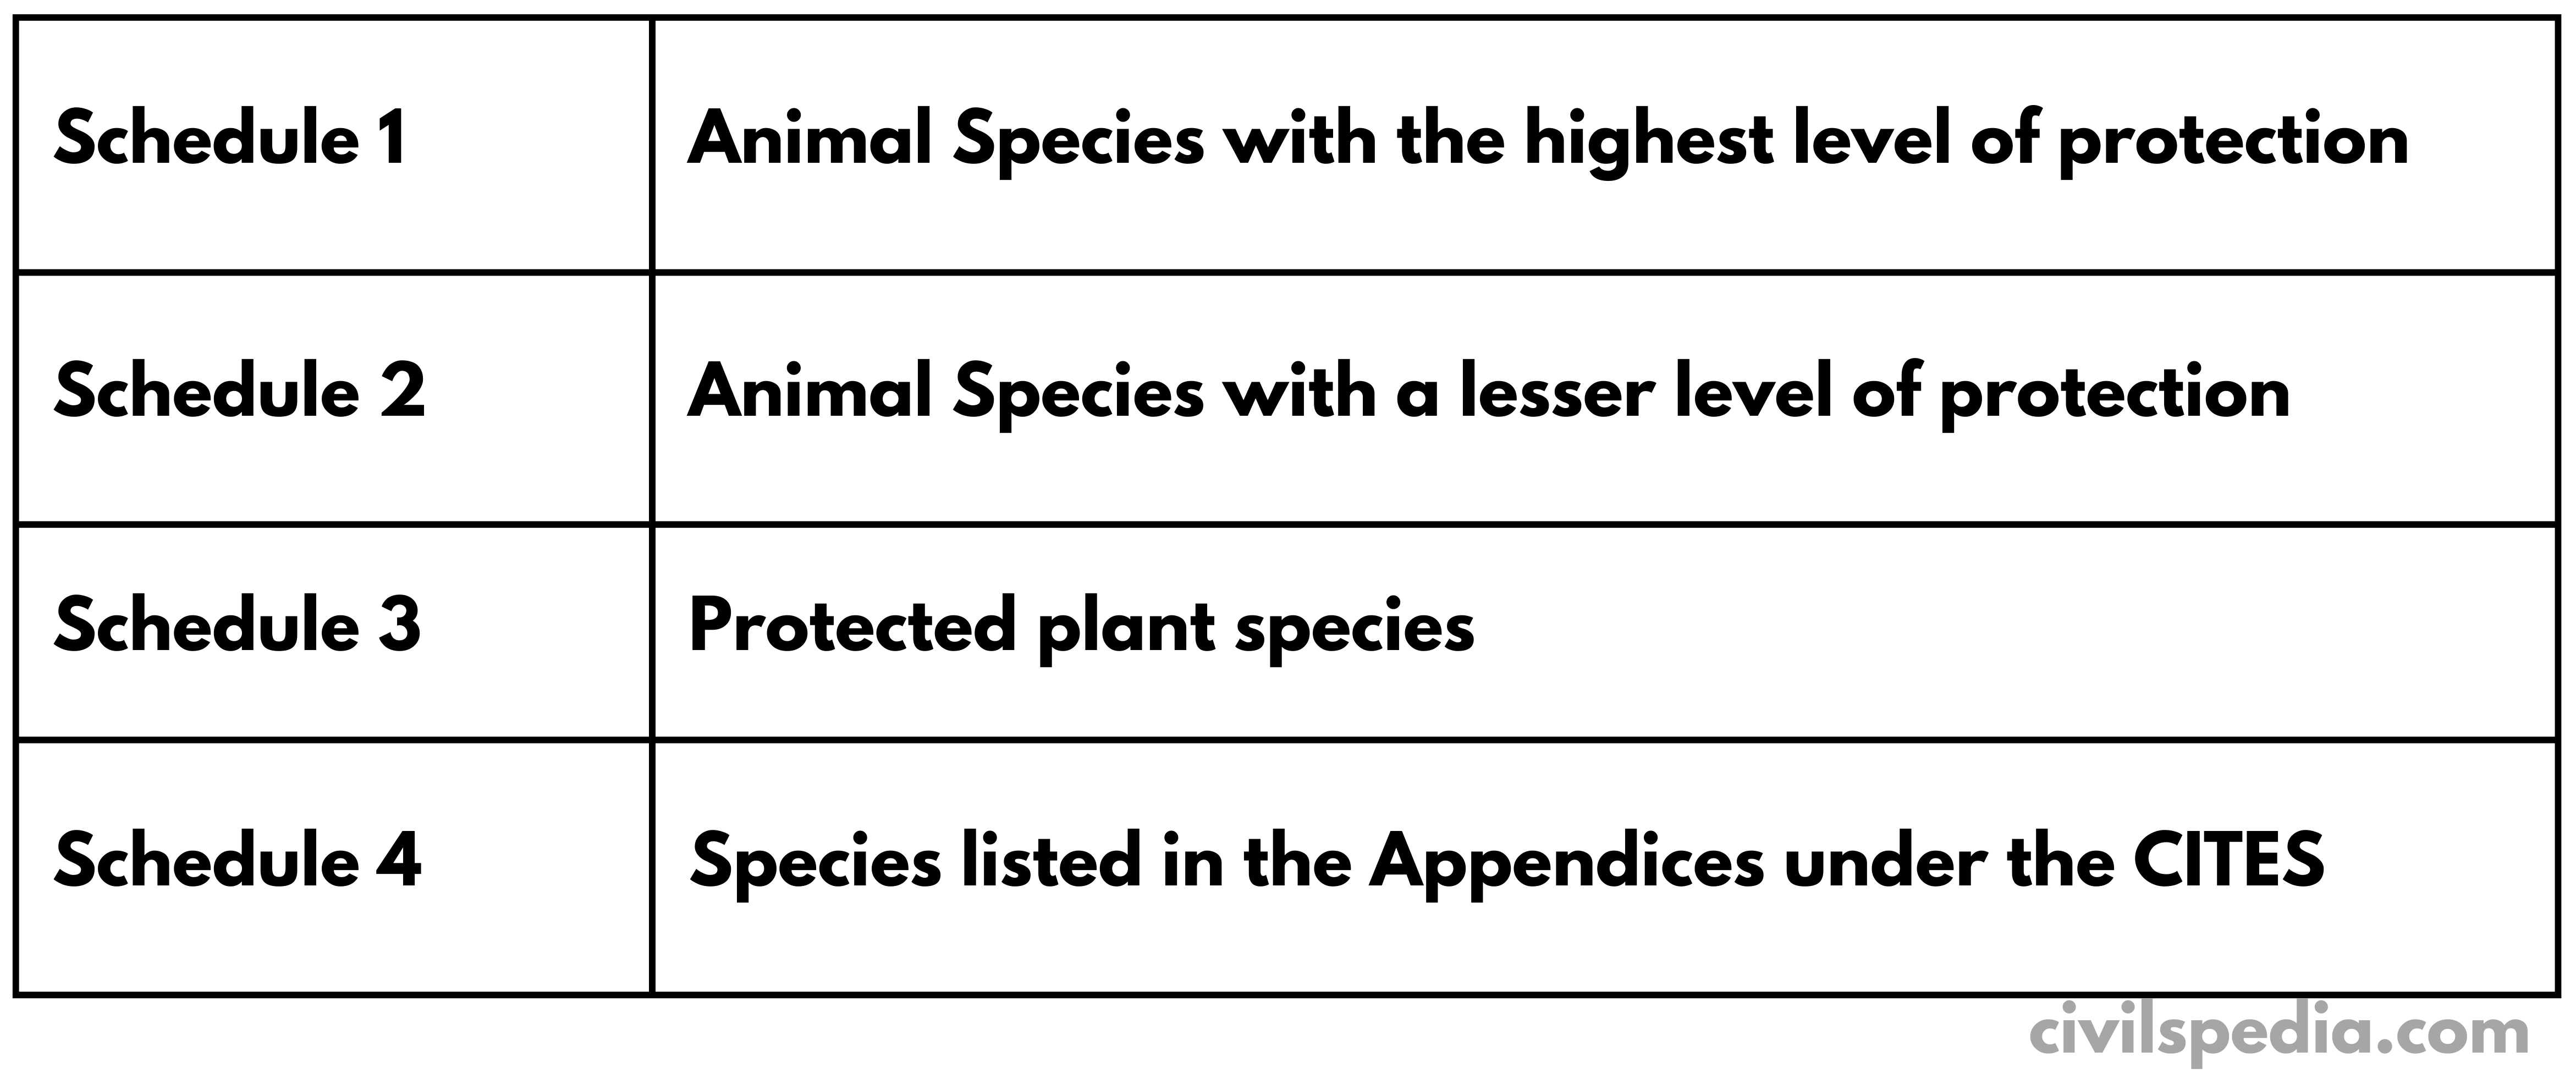
- Wildlife protection Act: Schedule 1 (maximum protection)
- CITES: Appendix 1
Project Tiger
| 1900 | 20,000 to 40,000 tigers were present in India |
| 1972 | The number of tigers reduced to 1800. |
| 1973 | The government started Project Tiger to combat this alarming situation |
About Project Tiger
- Project Tiger is run as Core Scheme, i.e. union and state governments share expenses in the 60:40 ratio.
- It is administered by National Tiger Conservation Authority (NTCA).
National Tiger Conservation Authority of India (NTCA)
- It is a statutory body constituted under the provisions of the Wildlife Protection Act.
- Minister of Environment and Forests heads NTCA.
Procedure to make Tiger Reserve
- The state government can notify any area as Tiger Reserve on the recommendation of NTCA.
Objective of Project Tiger
- Ensuring the maintenance of a viable Tiger population in India for scientific, economic, aesthetic, cultural and ecological value
Parts of Tiger Reserves
| Core Area | – No human activity is allowed except anything that affects the rights of the scheduled tribes and forest dwellers. |
| Buffer Area | – Limited non-commercial activity such as development is allowed. – There is a co-existence of man and wildlife Gram Sabha is consulted in the management of buffer areas. |
Alteration in boundary
- No alteration can be made except on the recommendation of NTCA and approval of the National Board for Wildlife.
Recent initiatives
- Strengthening of anti-poaching activities by the deployment of anti-poaching squads involving ex-army personnel/home guards
- Reintroduction of tigers has been done at Sariska (Rajasthan), Panna (MP), Satkosia (MP) and Rajaji Tiger Reserve (Uttarakhand) tiger reserves.
Problems with project tiger
1. Funds
- Funds received by a majority of tiger reserves are usually inadequate & delayed.
2. Staff
- Forest Guards are usually trained only once during the course of their employment. Proper training is also lacking.
3. Infrastructure
- Roads, wireless equipment, jeeps, arms and ammunition and other anti-poaching equipment are lacking.
4. Constitutional angle
- Forests and Wildlife are placed under the concurrent list in the Indian Constitution. Hence, the Central Government has limited powers over the execution of Project Tiger. Thus, while the guideline issued by the Central Government may be sound, their translation into ground realities depends totally on the State Government’s commitment.
Tiger Reserves in India
Tiger Habitats in India can be divided into 5 divisions i.e.
- Shivalik Gangetic Plains
- Central India and the Eastern Ghats
- Western Ghats
- Sunderbans
- North Eastern Hills and Brahmaputra Flood Plains
There are 52 Tiger Reserves in 17 States. The important ones are listed below
| Corbett | Uttarakhand |
| Dudhwa | UP |
| Valmiki | Bihar |
| Ranthambore | Rajasthan |
| Sariska | Rajasthan |
| Kanha | MP |
| Bandhavgarh | MP |
| Panna | MP |
| Pench | MP |
| Guru Ghasidas | Chhattisgarh |
| Pench | Maharashtra |
| Bandipur | Karnataka |
| Nagarhole | Karnataka |
| Periyar | Kerala |
| Anamalai | Tamil Nadu |
| Mudumalai | Tamil Nadu |
| Simplipal | Odisha |
| Sunderbans | West Bengal |
| Buxa | West Bengal |
| Kaziranga | Assam |
| Manas | Assam |
| Namdapha | Arunachal Pradesh |
Reasons for decrease in tiger population
1. Habitat loss
- Because of Deforestation, the size of tiger prey (deer, sambar etc.) has declined.
- Forest fires and floods are leading to habitat loss.
2. Disturbance in Tiger breeding/ reproduction
- Highways, noise pollution, tourism etc., disrupt the tiger breeding, thus impacting their population.
3. Area constraint/fragmentation of area
- Tiger is a territorial animal which advertises its presence in an area through urine marking and maintains a territory. Hence, 80-100 tigers need a protected and undisturbed area of 1000 sq km. In its absence, male tigers would fight and kill each other. Due to the construction of highways and farming activities, the habitats are getting fragmented.
4. Insurgency in North East and Naxals in Central India
- The Forest departments cannot efficiently work and protect tigers.
- Using illegal trade in these to fund their operations
5. Black market of tiger bones and organs
- China has a big market for tiger bones and organs where these organs are used for enhancing male virality.
Why do we need to protect tigers?
- Tiger is an “umbrella species“. It resides at the top of the forest food chain. A healthy tiger population indicates that the other ecological components in its habitat are equally robust since tigers need a large amount of prey and good habitat.
- If the Umbrella species are protected, it will also ensure viable populations of other wild animals (co-predators like leopards and prey like dears) and the habitat (trees, shrubs, water).
Transfer Projects
1. Lion to Tiger Territory
- There is a proposal to shift lion from Gujarat to Kuno-Palpur National Park, MP
- Reason: All Lion population in Gujarat which makes them vulnerable.
- Problem: Gujarat government considers it PRIDE OF THE STATE & refusing to share it with MP.
2. Interstate Tiger Cub transfer
- From Bandhavgarh and Kanha in MP to Satkosia in Odisha.
- Tigers were transferred in 2018. But this led to massive protests by the locals as they were not consulted in the whole process. One of the tigers started to raid human habitations leading to Man-Animal conflict. Hence, the project was shelved, and Tiger was transferred back to MP.
Tiger census-2018
Tiger census is the all India tiger estimation exercise happening since 2006. The Tiger Census is carried out after a gap of every three years by NTCA.
M – STRiPES
- M-STRiPES, or Monitoring System for Tiger Intensive Protection & Ecological Status, is software developed by the Wildlife Institute of India.
- It is a software-based Monitoring system for tigers.
- It uses e-Eye system using thermal cameras.
- The Indian government launched it in 2010.
- The Tiger Census is also conducted using M-STRiPES.
2. Project Elephant
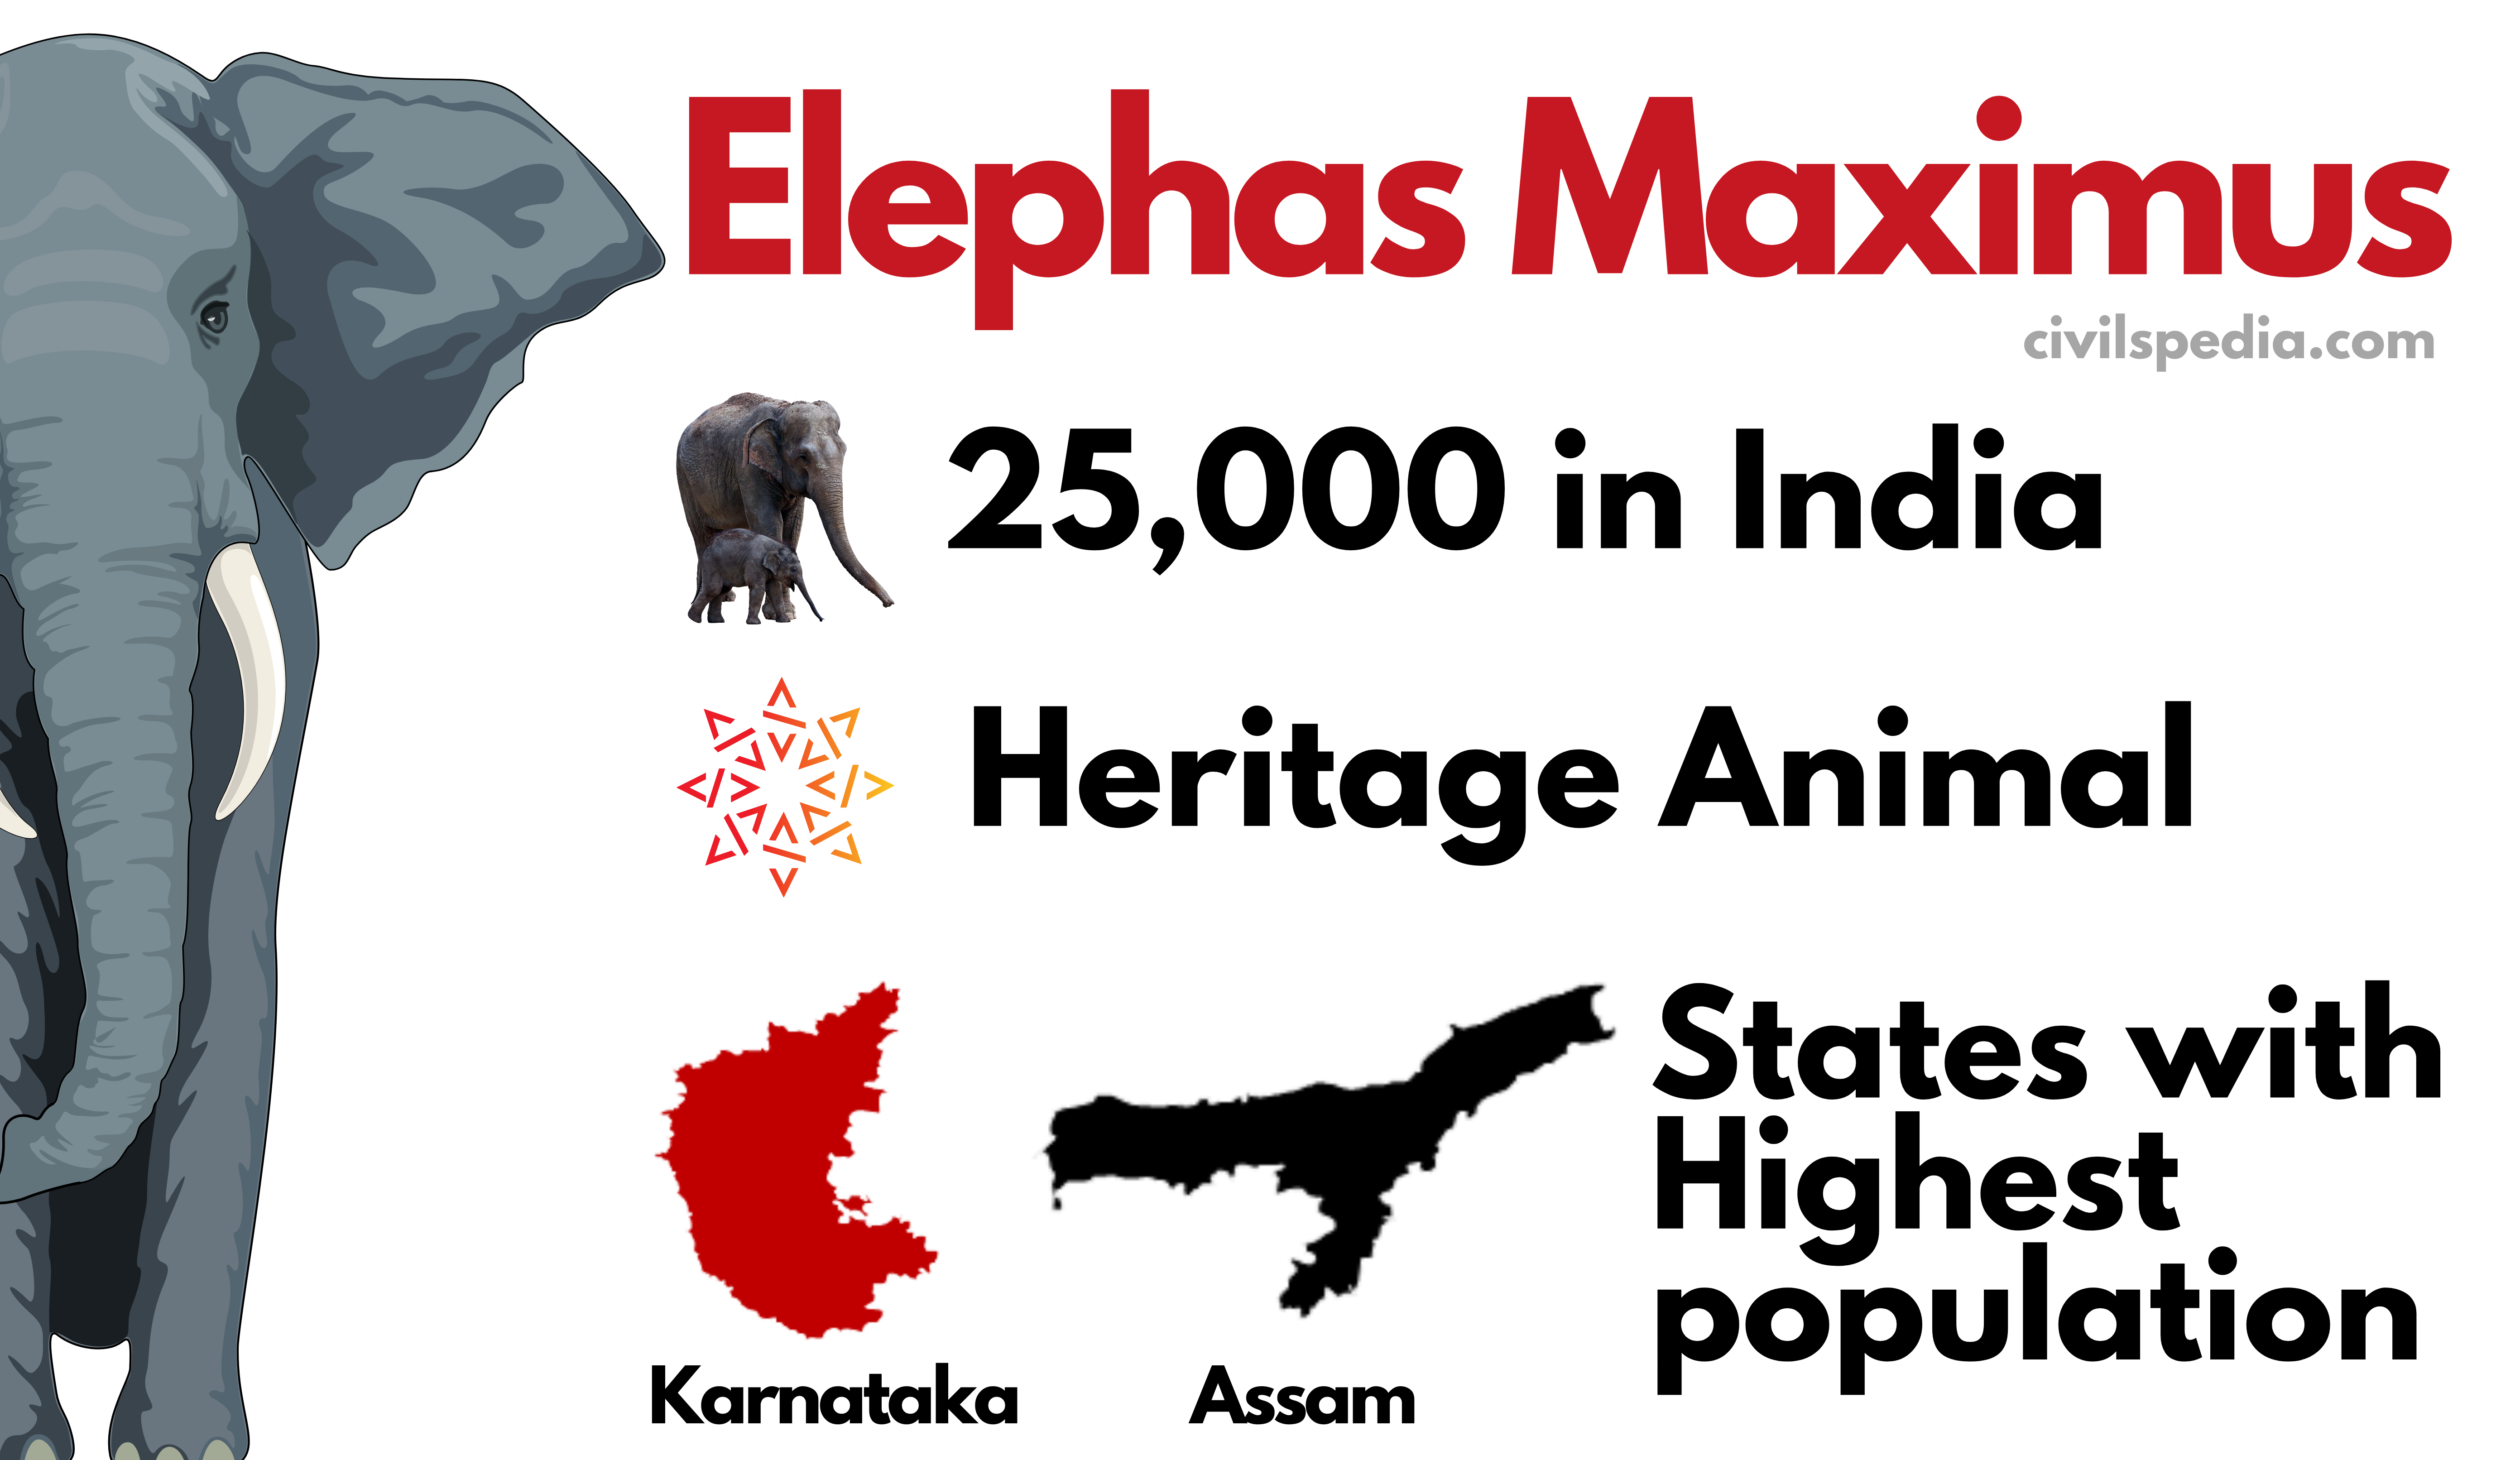
| Scientific Name | Elephas Maximus |
| IUCN status | Endangered |
| Population | 25,000 in India |
| Heritage Animal | The elephant was declared National Heritage Animal in 2010 |
Project Elephant
- Project Elephant was launched in 1992 as a centrally Sponsored Scheme
Objectives
- Protect elephants, their habitat and corridors
- To address the issue of man-animal conflict
- Ensure the welfare of the domesticated elephants
- Strengthening of protection from the poachers and unnatural causes of death
- Public education and awareness
- Providing Veterinary care
Elephant Reserves
There are a total of 30 elephant reserves in India.
Important ones are
| Singhbhum | Jharkhand |
| Mayurbhanj | Odisha |
| Sambhalpur | Odisha |
| Kameng | Arunachal |
| Singhpan | Nagaland |
| Kaziranga | Assam |
| Wayanad | Kerala |
| Periyar | Kerala |
| Anaimalai | Tamil Nadu |
Elephant Corridors
- Elephant Corridors are narrow land for the passage of elephants from one habitat to another.
- There are 183 identified Elephant Corridors in India.
Reasons for decrease in population
- Poaching for elephant ivory
- Disruption of habitat
- Man animal conflict
- Mining activities in central India
- Train hits
Monitoring of Illegal Killing of Elephants (MIKE) Program
- It was established in 2003 by CITES.
- It is an international collaboration that tracks trends in information related to the illegal killing of elephants across Africa and Asia to monitor the effectiveness of field conservation efforts.
3. Integrated Development of Wildlife Habitat (IDWH)
- Project Tiger is run as Core Scheme, i.e. union and state governments share expenses in the 60:40 ratio.
- The aim of the scheme is protection of the wildlife.
- Objective
- Support the protected areas
- Conservation of Wildlife outside protected areas
- Recovering the critically endangered species as well as habitats.
Financial and technical assistance is given to states to protect threatened 18 species like
| Mammals | 1. Snow Leopard 2. Bustards (including Florican) 3. Hangul 4. Nilgiri Tahr 5. Asian Wild Buffalo 6. Manipur Brow-antlered 7. Malabar civet 8. One-horned rhinoceros 9. Asiatic Lion 10. Swamp deer |
| Aquatic | 11. River Dolphin 12. Marine Turtles 13. Dugongs 14. Coral Reefs |
| Birds | 15. Edible-nest Swiftlets 16. Nicobar Megapode 17. Vultures 18. Jerdon’s Courser |
3.1 Lion Conservation Project

- It was launched by Environment Ministry in 2018.
- The aim is to protect and conserve the world’s last ranging free population of Asiatic Lion.
- It is funded under the Integrated Development of Wildlife Habitat (IDWH), with the contributing ratio being 60:40 of Central and State governments.
About Asiatic Loin
- Asiatic Lion, Panthera Leo Persica is listed in
- Schedule 1 of Wildlife Protection Act, 1972
- Appendix-I of CITES
- Endangered category under IUCN Red List
- Asiatic Lions are found only in the 5 protected areas of Gujarat, the most famous of which is Gir.
Lion Transfer
- Lion is only found in Gujarat, which makes it vulnerable to extinction in case of any disease or unwanted accident. Hence, the proposal is to transfer some lions to Kuno-Palpur National Park, Madhya Pradesh.
3.2 Project Snow Leopard
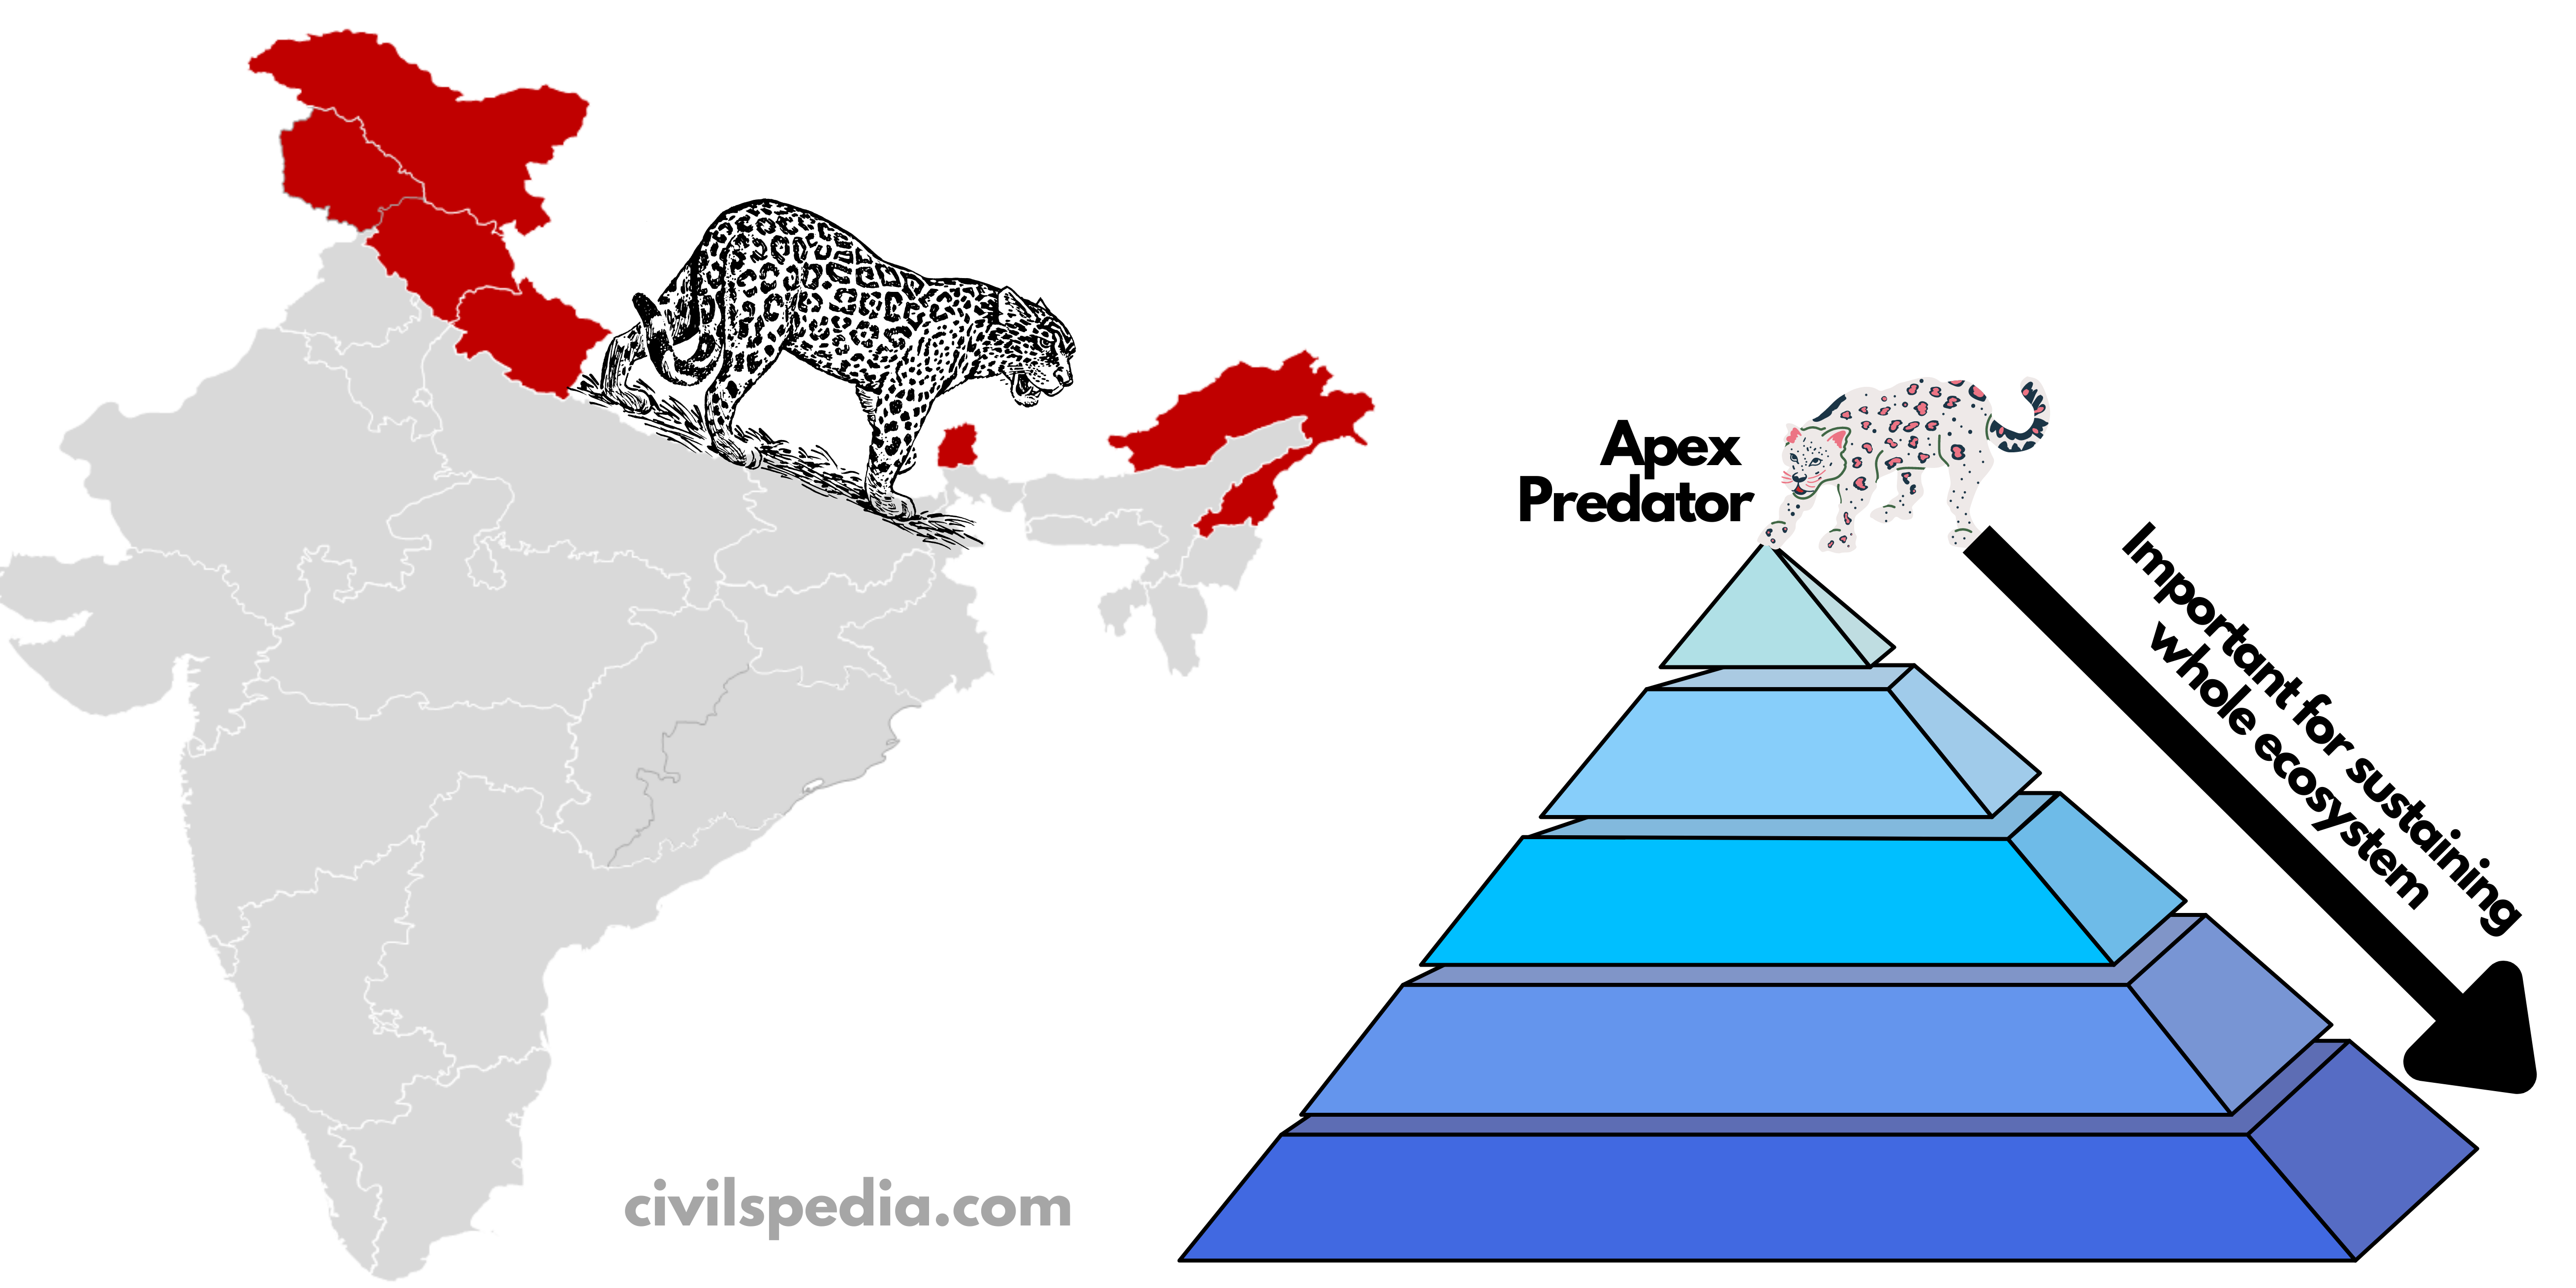
- There are around 7400 snow leopards globally, and ~10% of them are present in India (750 in India ).
- The snow leopard is the apex predator on the ecological pyramid. Hence, it plays an important role in sustaining the ecosystem in its habitat.
- Snow Leopard is listed in
- Schedule 1 of the Wildlife Protection Act
- Vulnerable category under IUCN Red List
- It is found in Jammu and Kashmir, Ladakh, Himachal Pradesh, Uttarakhand, Arunachal and Sikkim.
- In 2021, the newly created Union Territory of Ladakh declared it to be the state animal.
3.3 Vulture
- India is home to 9 out of 23 species of vultures. These include
- White-rumped vulture (WRV)
- Long-billed vulture (LBV)
- Read-headed or king vulture
- Egyptian vulture (EV)
- Eurasian griffon (EG)
- Himalayan griffon (HG)
- Cinereous vulture (CV)
- Slender-billed vulture (SBV)
- Bearded vulture(BV).
- Of these, 3 are Critically Endangered
- White Backed Vulture
- Slender Billed Vulture
- Long-Billed Vulture
- Other points about Vultures
- Vultures nest on tall trees and rocky cliffs.
- They are slow breeders. Hence, the survival of every individual is essential.
- They have excellent eyesight and smelling sense and can detect the presence of dead animals from great distances.
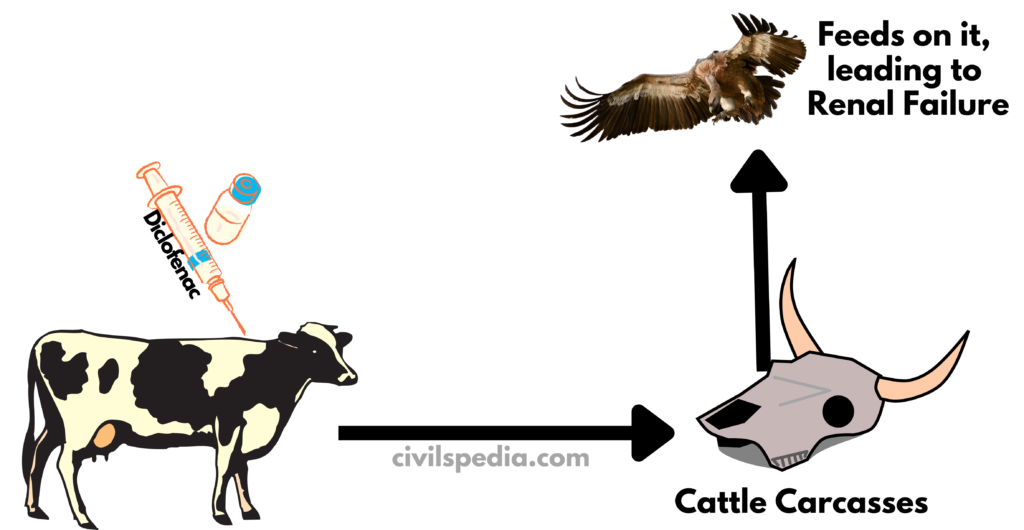
- They don’t hunt and rely on other carnivores for carcasses. But they have strong bills and necks adapted to tear flesh from carcasses. Further, vultures have acidic stomachs, which help them to digest rotting carcasses.
Causes of their deaths
- Bioaccumulation of Diclofenac leads to kidney failure in vultures culminating in their death.
Other minor reasons
- Hunting and trading because of myths about the medicinal power of vultures.
- Habitat destruction due to rapid urbanization.
- Electrocution in the areas with lesser trees.
Program for Protection
- The use of Diclofenac has been banned in India.
- Vulture has been brought under Integrated Development of Wildlife Habitat (IDWH)
- Vulture Safe Zones : 3 such zones have been created – from Uttarakhand to Nepal, Assam to Arunachal and Central India
- Vulture Breeding Facilities: Breeding facilities have been created in Guwahati, Pinjore and Buxa (WB)
- Ramadevarabetta Vulture Sanctuary: It is India’s only vulture sanctuary in Karnataka
- ‘Vulture Restaurants/Cafeteria’: These are elevated spots located strategically, for example, in Punjab and Maharashtra, where dead animals are kept for vultures to feed.
Consequences of these disappearances
- The disappearance of vultures has allowed other species, such as rats and wild dogs, to take their place. These new scavengers, however, are not as efficient as vultures. Vulture’s metabolism is a true “dead end” for pathogens, but dogs and rats become carriers of the pathogens. Thus, they are directly or indirectly responsible for thousands of human deaths.
3.4 Rhino
- Rhino is listed in
- Schedule 1 of the Wildlife Protection Act
- Vulnerable category under IUCN Red List
- There are around 3000 Rhinos in the world.
- In India, Rhino is found in North Bihar, North West Bengal and the Brahmaputra valley of Assam. But 95% of the world population is found in Kaziranga & Orang National Park in Assam.
Reasons for poaching
The reason for poaching is a great demand of horns of Rhino due to
- Use of Rhino horn in Chinese medicines.
- The Rhino horn is considered a status symbol in countries such as Vietnam.
3.5 Project Hangul/Kashmiri Stag
- Hangul or Kashmiri Stag is a CRITICALLY ENDANGERED species under IUCN Red List.
- There were only 160 mature individuals of Hangul in 2008
- Project Hangul was started in 1975 by the J&K government, IUCN and WWF. Presently under IDWH
- It is also the state animal of J&K.
- The main population is in Dachigam National Park, Srinagar.
3.6 Gangetic Dolphin
- In 2010, Government declared Gangetic Dolphin as the National Aquatic Animal.
- It is listed in the
- Schedule 1 of the Wildlife (Protection) Act
- Endangered on IUCN Red List.
- It is found in parts of the Ganga Brahmaputra river system. More than 50% of Gangetic Dolphin are found in Bihar.
- The Gangetic Dolphin symbolizes the purity of Ganga as it can survive only in freshwater.
- It is also known as Susu or Sushak, or Souns because of its noise.
Side Topic: River Dolphins
- There are a total of 4 freshwater dolphins in the world i.e.
- Baiji or Yangtze Dolphin (China)
- Boto or Amazon Dolphin
- Bhulan or Indus Dolphin
- Susu or Gangetic Dolphin.
Main reasons for population decline
- Poaching for oil
- Habitat degradation due to declining flow
- Heavy siltation
- Sand mining
- The construction of barrages causes population fragmentation due to physical barriers
- Increasing traffic due to the declaration of Ganga as National Waterways
Steps taken for preservation of Gangetic Dolphin
- Project Dolphin
- Ministry of Environment announced it in 2020 on the lines of ‘Project Tiger’.
- It involves the conservation of dolphins through the use of modern technology and engages local fishing communities in the conservation process.
- National Dolphin Research Centre has been established at Patna University.
- Vikramshila Gangetic Dolphin Sanctuary has been established in Bihar.
Side Topic: Indus Dolphin
- Indus Dolphin are endangered, freshwater, and functionally blind species of dolphins relying on echolocation for navigation, communication and hunting prey.
- India has a population of around 30 Indus Dolphins in the Beas River. The rest of the population is found in the Indus river in Pakistan.
- Punjab declared it as its state aquatic animal in 2019.
- In 2021, the Punjab government, along with WWF-India, conducted the first organized census on the population of Indus Dolphin.
3.7 Nilgiri Tahr
- Nilgiri Tahr is the state animal of Tamil Nadu.
- It is listed in
- Schedule 1 of the Wildlife (Protection) Act
- Endangered on IUCN Red List
- It is endemic to the narrow belt of the higher elevation of Shola Forest in the Western Ghats.