Last Update: May 2023 (Balance of Payment)
Table of Contents
Balance of Payment (2023)
This article deals with ‘Balance of Payment.’ This is part of our series on ‘Economics’ which is important pillar of GS-3 syllabus . For more articles , you can click here.
Introduction
- Balance of
Payment is the summary/account sheet made by the country’s central bank
that shows the cash flow between residents of a country with the
rest of the world for a specified time period, typically a year. - A payment to a foreign country
is a debit transaction, whereas a payment received from a foreign
country is a credit transaction.
| Outgoing | -ive |
| Incoming | +ive |
- The IMF decides the format, and all data is presented in dollars for the comparison’s sake.
- If the Balance of Payment of all countries is added, the answer will be zero (because one nation’s credit becomes the other’s debit).
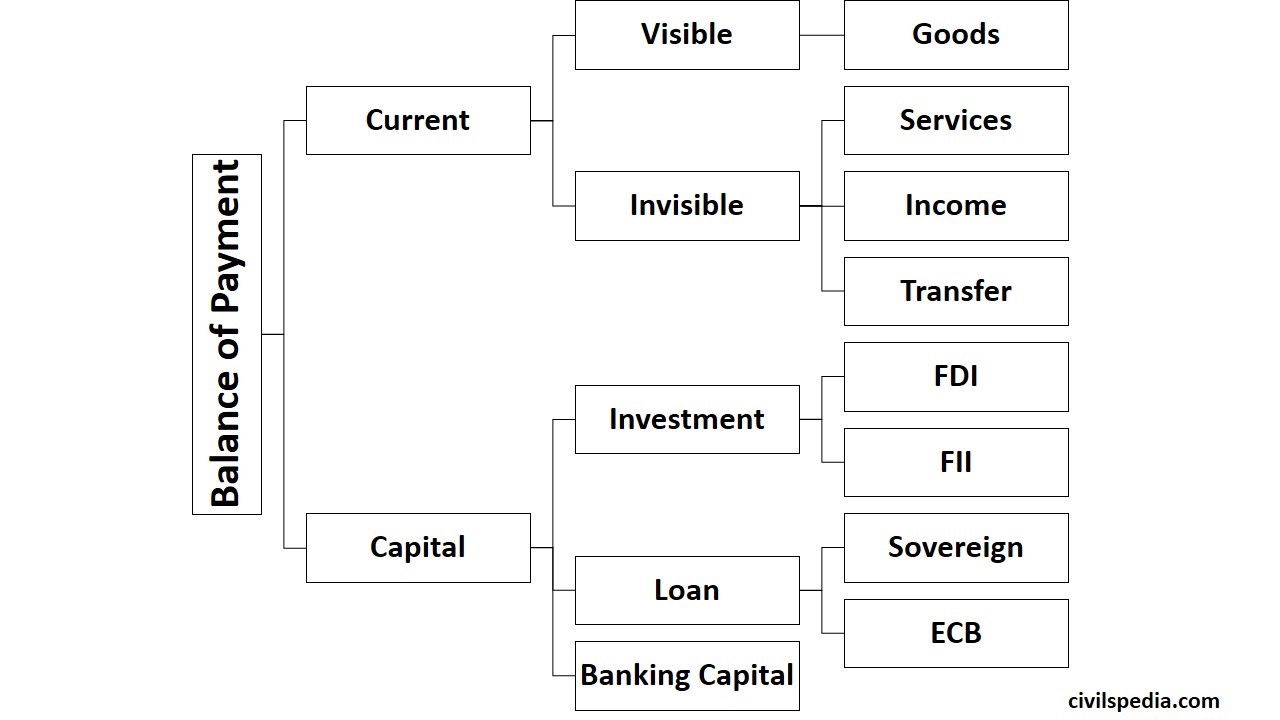
Components of Balance of Payment
Balance of Payment comprises two parts: Current Account and Capital Account.
| Current Account | The Current Account is the record of trade in goods and services, transfer of income (in the form of profit, interest and dividend) and transfer payments. |
| Capital Account | Capital Account records all international transactions of assets. An asset is any one of the forms in which wealth can be held, for example, money, stocks, bonds, Government debt, etc. |
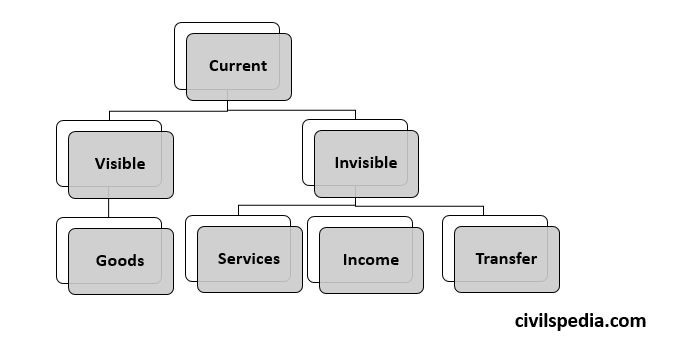
Part 1: Current Account
Note: In the Economic Survey, 2023 (which was published on 31/Jan/23), they have published only partial data from April to December-2022. Hence, instead of going into the exact data of each component, we will look into general trends. Even UPSC asks about general trends in the exam.
Visible Part and Balance of Trade (BoT)
- The movement of goods (export and import) is also known as ‘visible trade’ because the movement of goods between countries can be verified physically by the customs authorities of a country.
- Balance of Trade is the net difference between the export & import of goods.
- India always has a trade deficit because Indian imports are always more than exports.
Imports & Exports of Goods
| Major Exports | 1. Petroleum Products (14% of all exports) 2. Gems and other precious metal Jewellery 3. Organic and Inorganic Chemicals 4. Drug and Biologicals 5. Iron and steel |
| Major Imports | 1. Petroleum: Crude (22% of all imports) 2. Electronic goods 3. Coal and coke 4. Gold 5. Chemicals |
But there is a danger of a slowdown in Indian exports due to the fear of a global recession.
RoDTEP Scheme
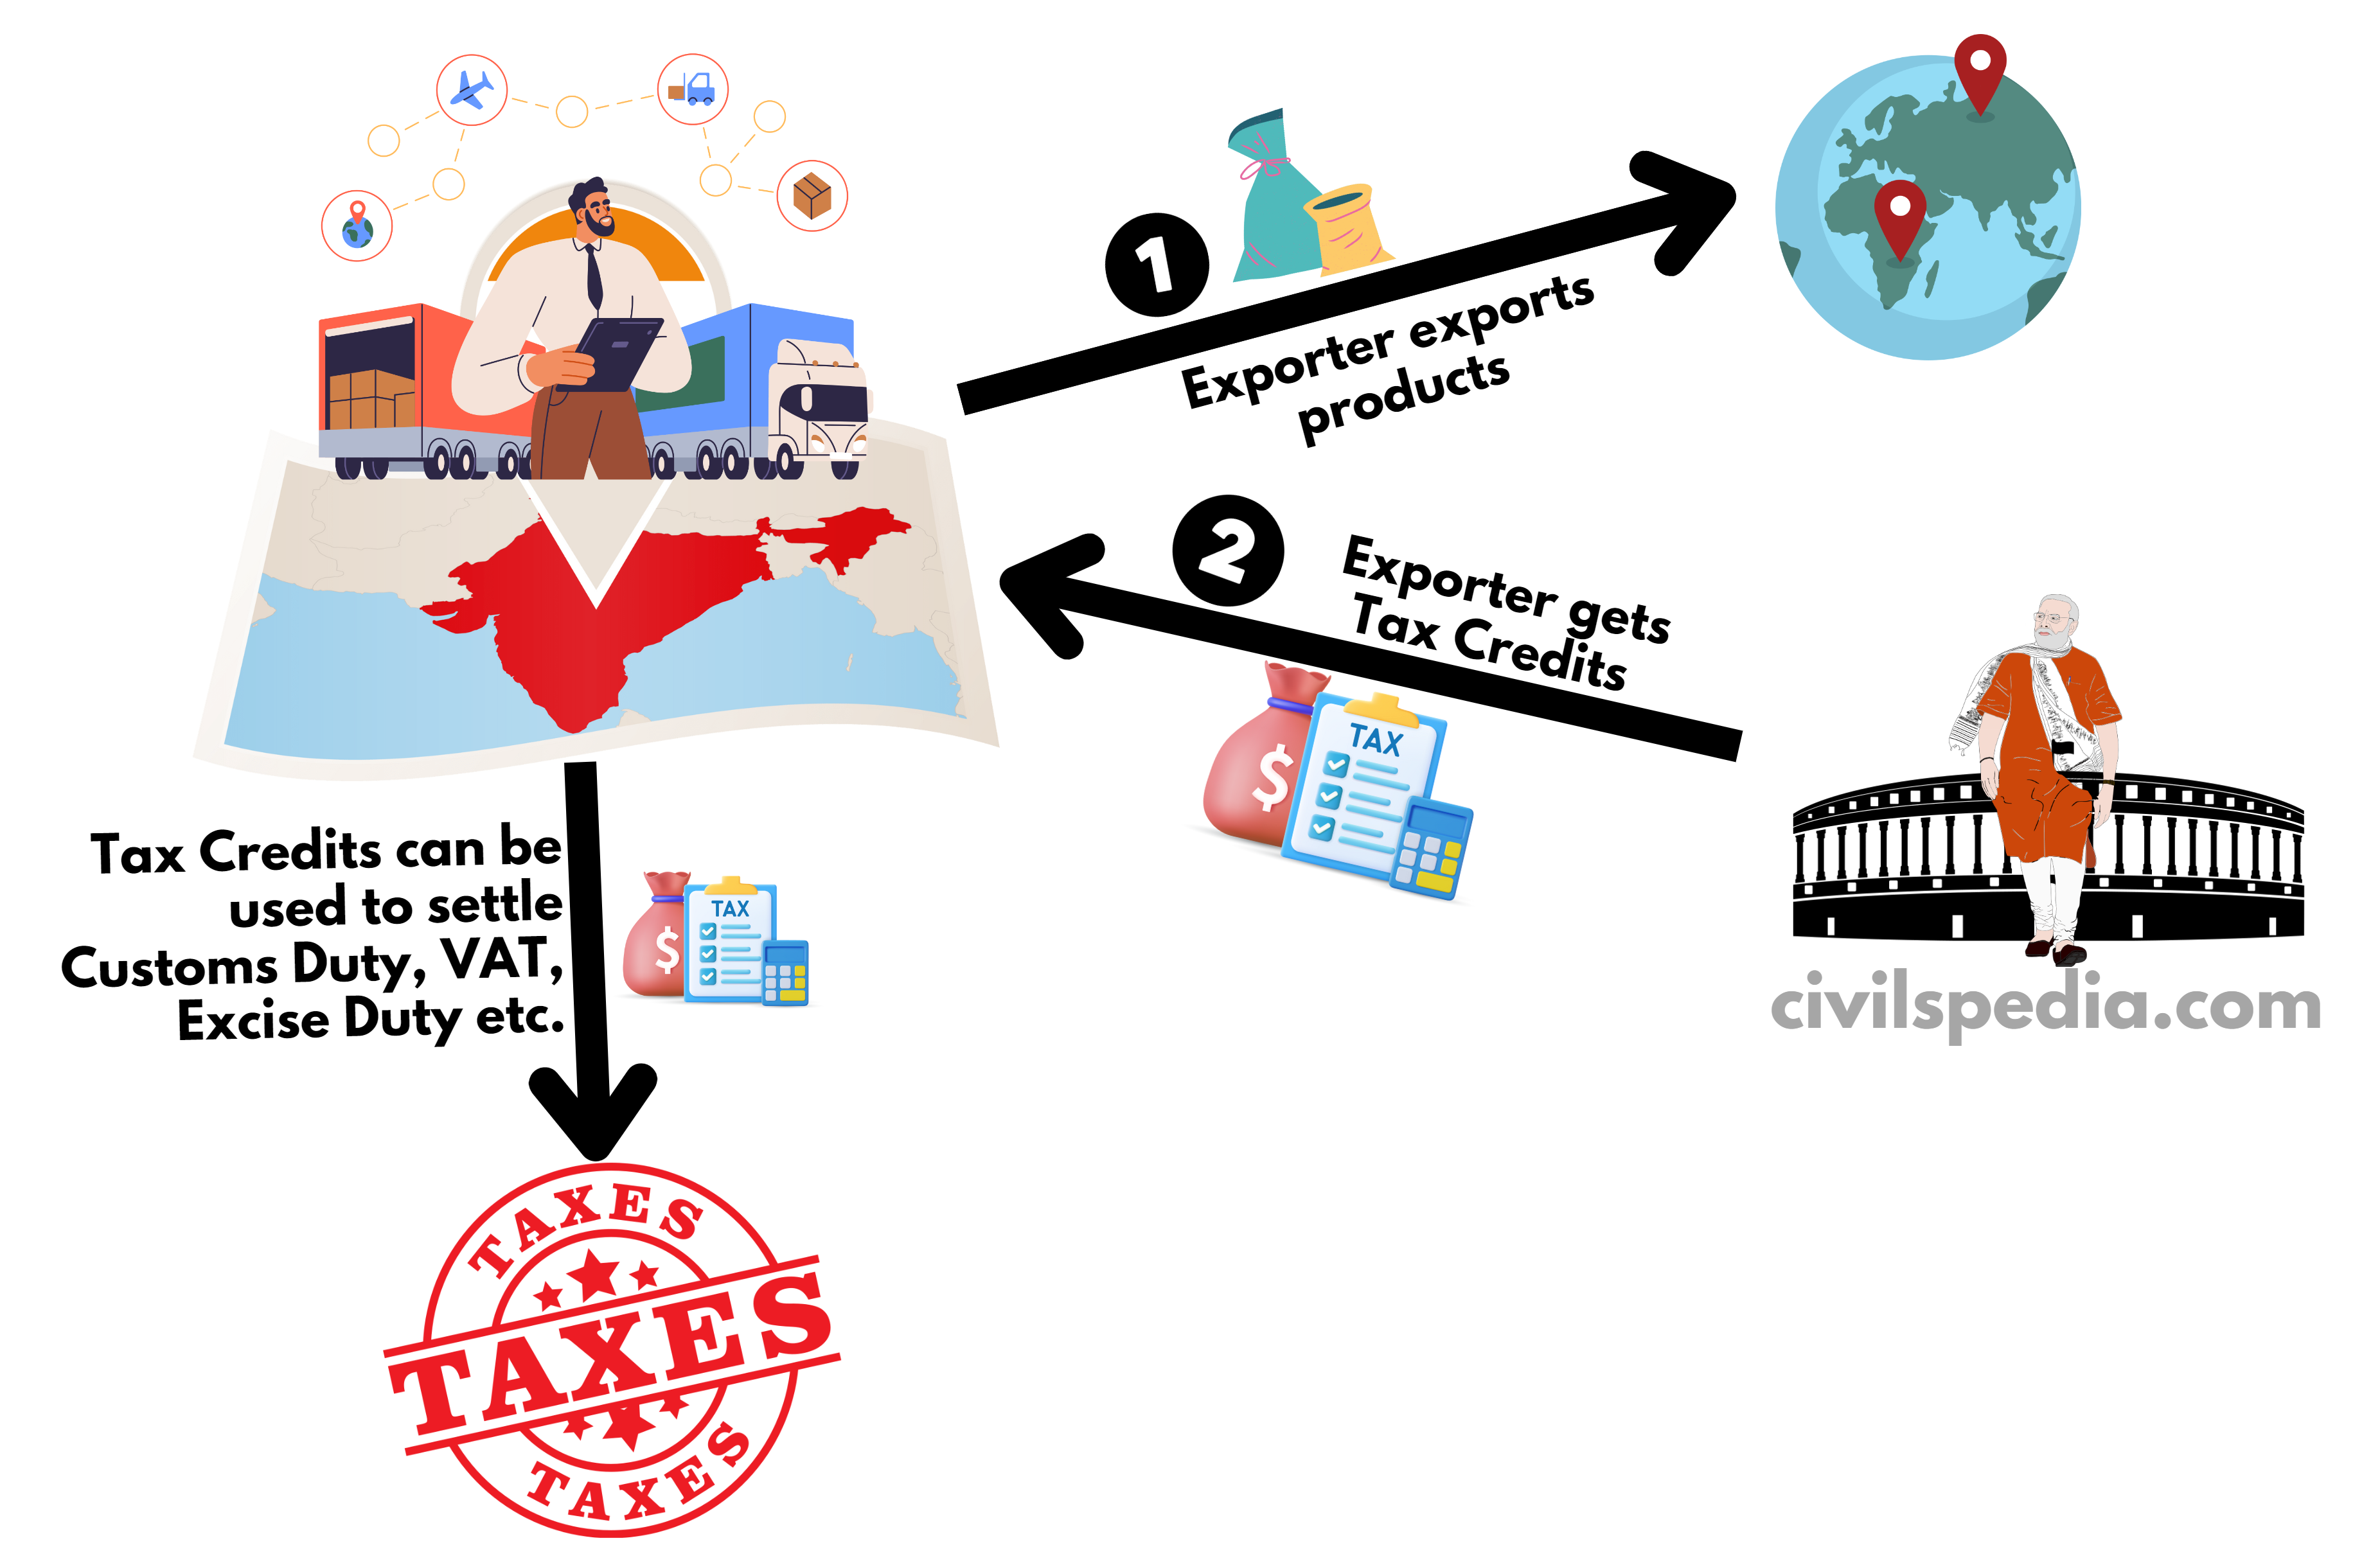
- Under RoDTEP, tax credit earned by the merchant can be used to settle (1) Customs Duty, (2) excise duty and VAT on the export of fuel, (3) electricity duty on the export of electricity and APMC Mandi fees on the export of agricultural raw material.
- Remission of Duties & Taxes on Exported Products (RoDTEP) has replaced MEIS (Merchandise Exports from India Scheme) as MEIS was declared against WTO obligations and also due to the shortcoming that MEIS tax credits can be used to settle Customs Duty only.
Steps to Improve Export Competitiveness of India
Some suggestions from Economic Surveys of recent years are as follows
1. Change in mindset
- Indian policymakers and businesses will have to change their mindset. They shouldn’t only produce what they can make with ease. Instead, they should focus on what the world needs from India.
2. Product Basket and Destination Diversification
- India should focus on Product basket and destination diversification. It can be achieved by signing more FTAs to enhance trade opportunities.
3. Logistics
- Government should focus on improving the logistics to make Indian exports more competitive.
4. Sign FTAs
- India should sign Free Trade Agreements with as many nations as possible.
5. Currency Rate
- India should make sure that the Indian Rupee is not overvalued.
- Most of the time, it has been observed that REER is greater than 100. As a result of the overvaluation of the Indian Rupee, Indian exports are expensive compared to our competitors like Vietnam and Bangladesh.
6. Promote Make in India
- India should make a solid industrial base and encourage export-oriented manufacturing (as China did in the past).
7. Combine Assemble in India with Make In India
- ‘Assemble in India for the world’ should be integrated with the ‘Make in India’. By doing so, India can raise its export market share to about 3.5 per cent by 2025 and 6 per cent by 2030.
8. Use GI Tags
- India should export products like Darjeeling Tea, Basmati rice etc.
9. Other suggestions
- India should reduce the import of petroleum by promoting ethanol blending of ethanol.
- India needs to utilize SEZ potential properly due to numerous policy issues.
The Government has introduced Export Preparedness Index to evaluate State’s capacity and potential to export goods. It will guide the stakeholders to strengthen the export ecosystem accordingly in a particular area.
Invisible Part & Balance of Invisibles
- Balance of Invisibles is the difference between the export & import of Invisibles, i.e. Services, Income and Transfers.
- Generally, the Balance of Invisibles is positive for India.
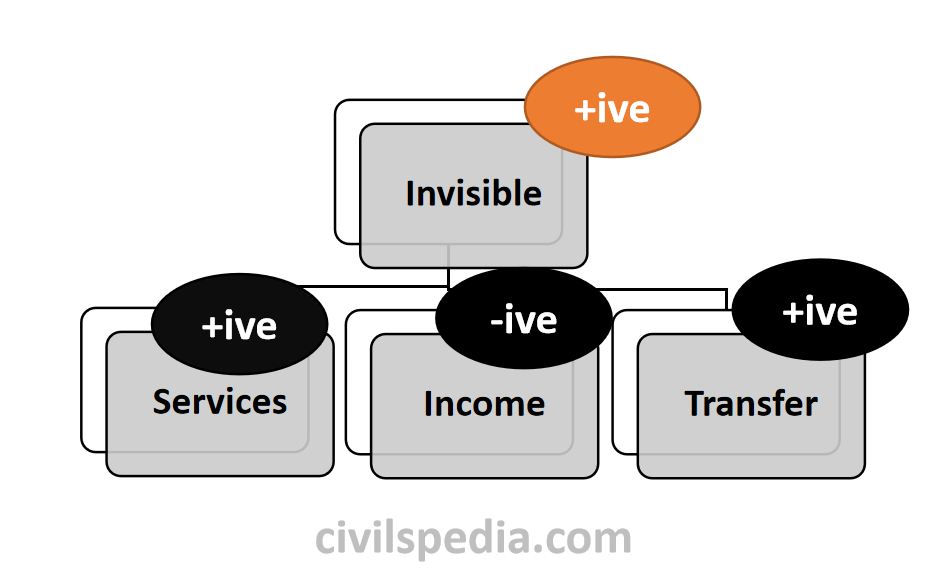
1. Service
- India has always been a surplus in Services due to the well-developed IT and BPO sectors.
- Hence, the general trend is that India is a surplus in Services.
- Note – The general trend is that Trade in Goods and Services (combined) is negative because Trade Deficit is much larger than the Surplus in Services.
- Major exports and imports of India in services are
| Exported Services | 1. Software, IT and BPO services (40% of all service exports) 2. Transportation 3. Travel tourism 4. Financial |
| Imported Services | 1. Business Services (like digital advertisements) 2. Foreign Travel 3. Fees for using the intellectual property of foreign entities |
Service Export from India Scheme (SEIS)
- The government introduced this scheme to increase the export of Services from India.
- Under this, for the export of Services worth every $100, Commerce Ministry transfers $ 5 to the Scrip Wallet of that firm, which can be used for paying tax liabilities.
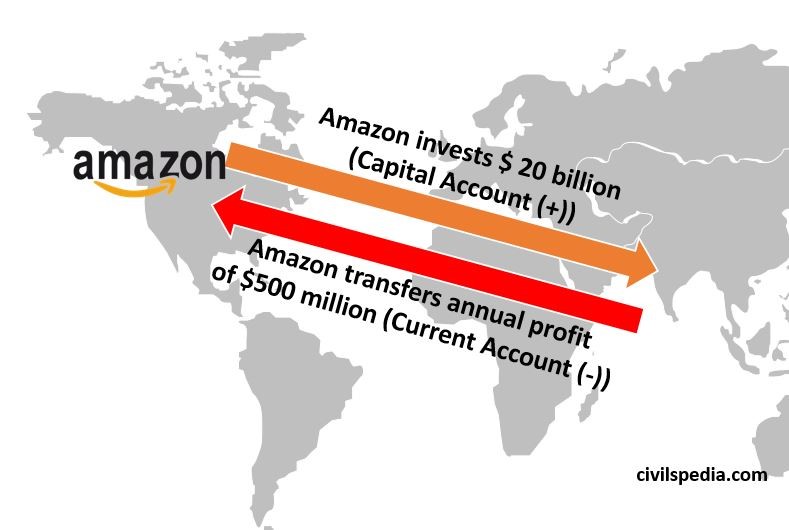
2. Income
- Income consists of profit earned by FDIs, interest on loans & dividends earned by investors.
- It has to be noted that whenever a foreign investor invests in any country, he will get back a dividend (in case of equity) or interest (in case of debt) or profit (in case a company like Amazon is doing FDI in India). These incomes are counted in the Current Account.
- The general trend is that India is a deficit in Income.
3. Transfer
- It includes three things.
- Remittances (sent to India by Indians living abroad and by foreigners residing in India to their native countries (e.g. Nepal))
- Gifts
- Donations
- According to World Bank’s Remittance Report, India receives the largest amount of remittance (about $100bn), followed by (2) Mexico, (3) China, (4) the Philippines and (5) Egypt.
- The general trend is that India is a surplus in Transfers.
Current Account of India (Final Stats)
The Current Account is in balance when receipts on the Current Account are equal to the payments on the Current Account. A surplus Current Account means that the country is a net lender to other countries, and a deficit Current Account implies that the country is a net borrower from other countries.
India generally has a DEFICIT CURRENT ACCOUNT.
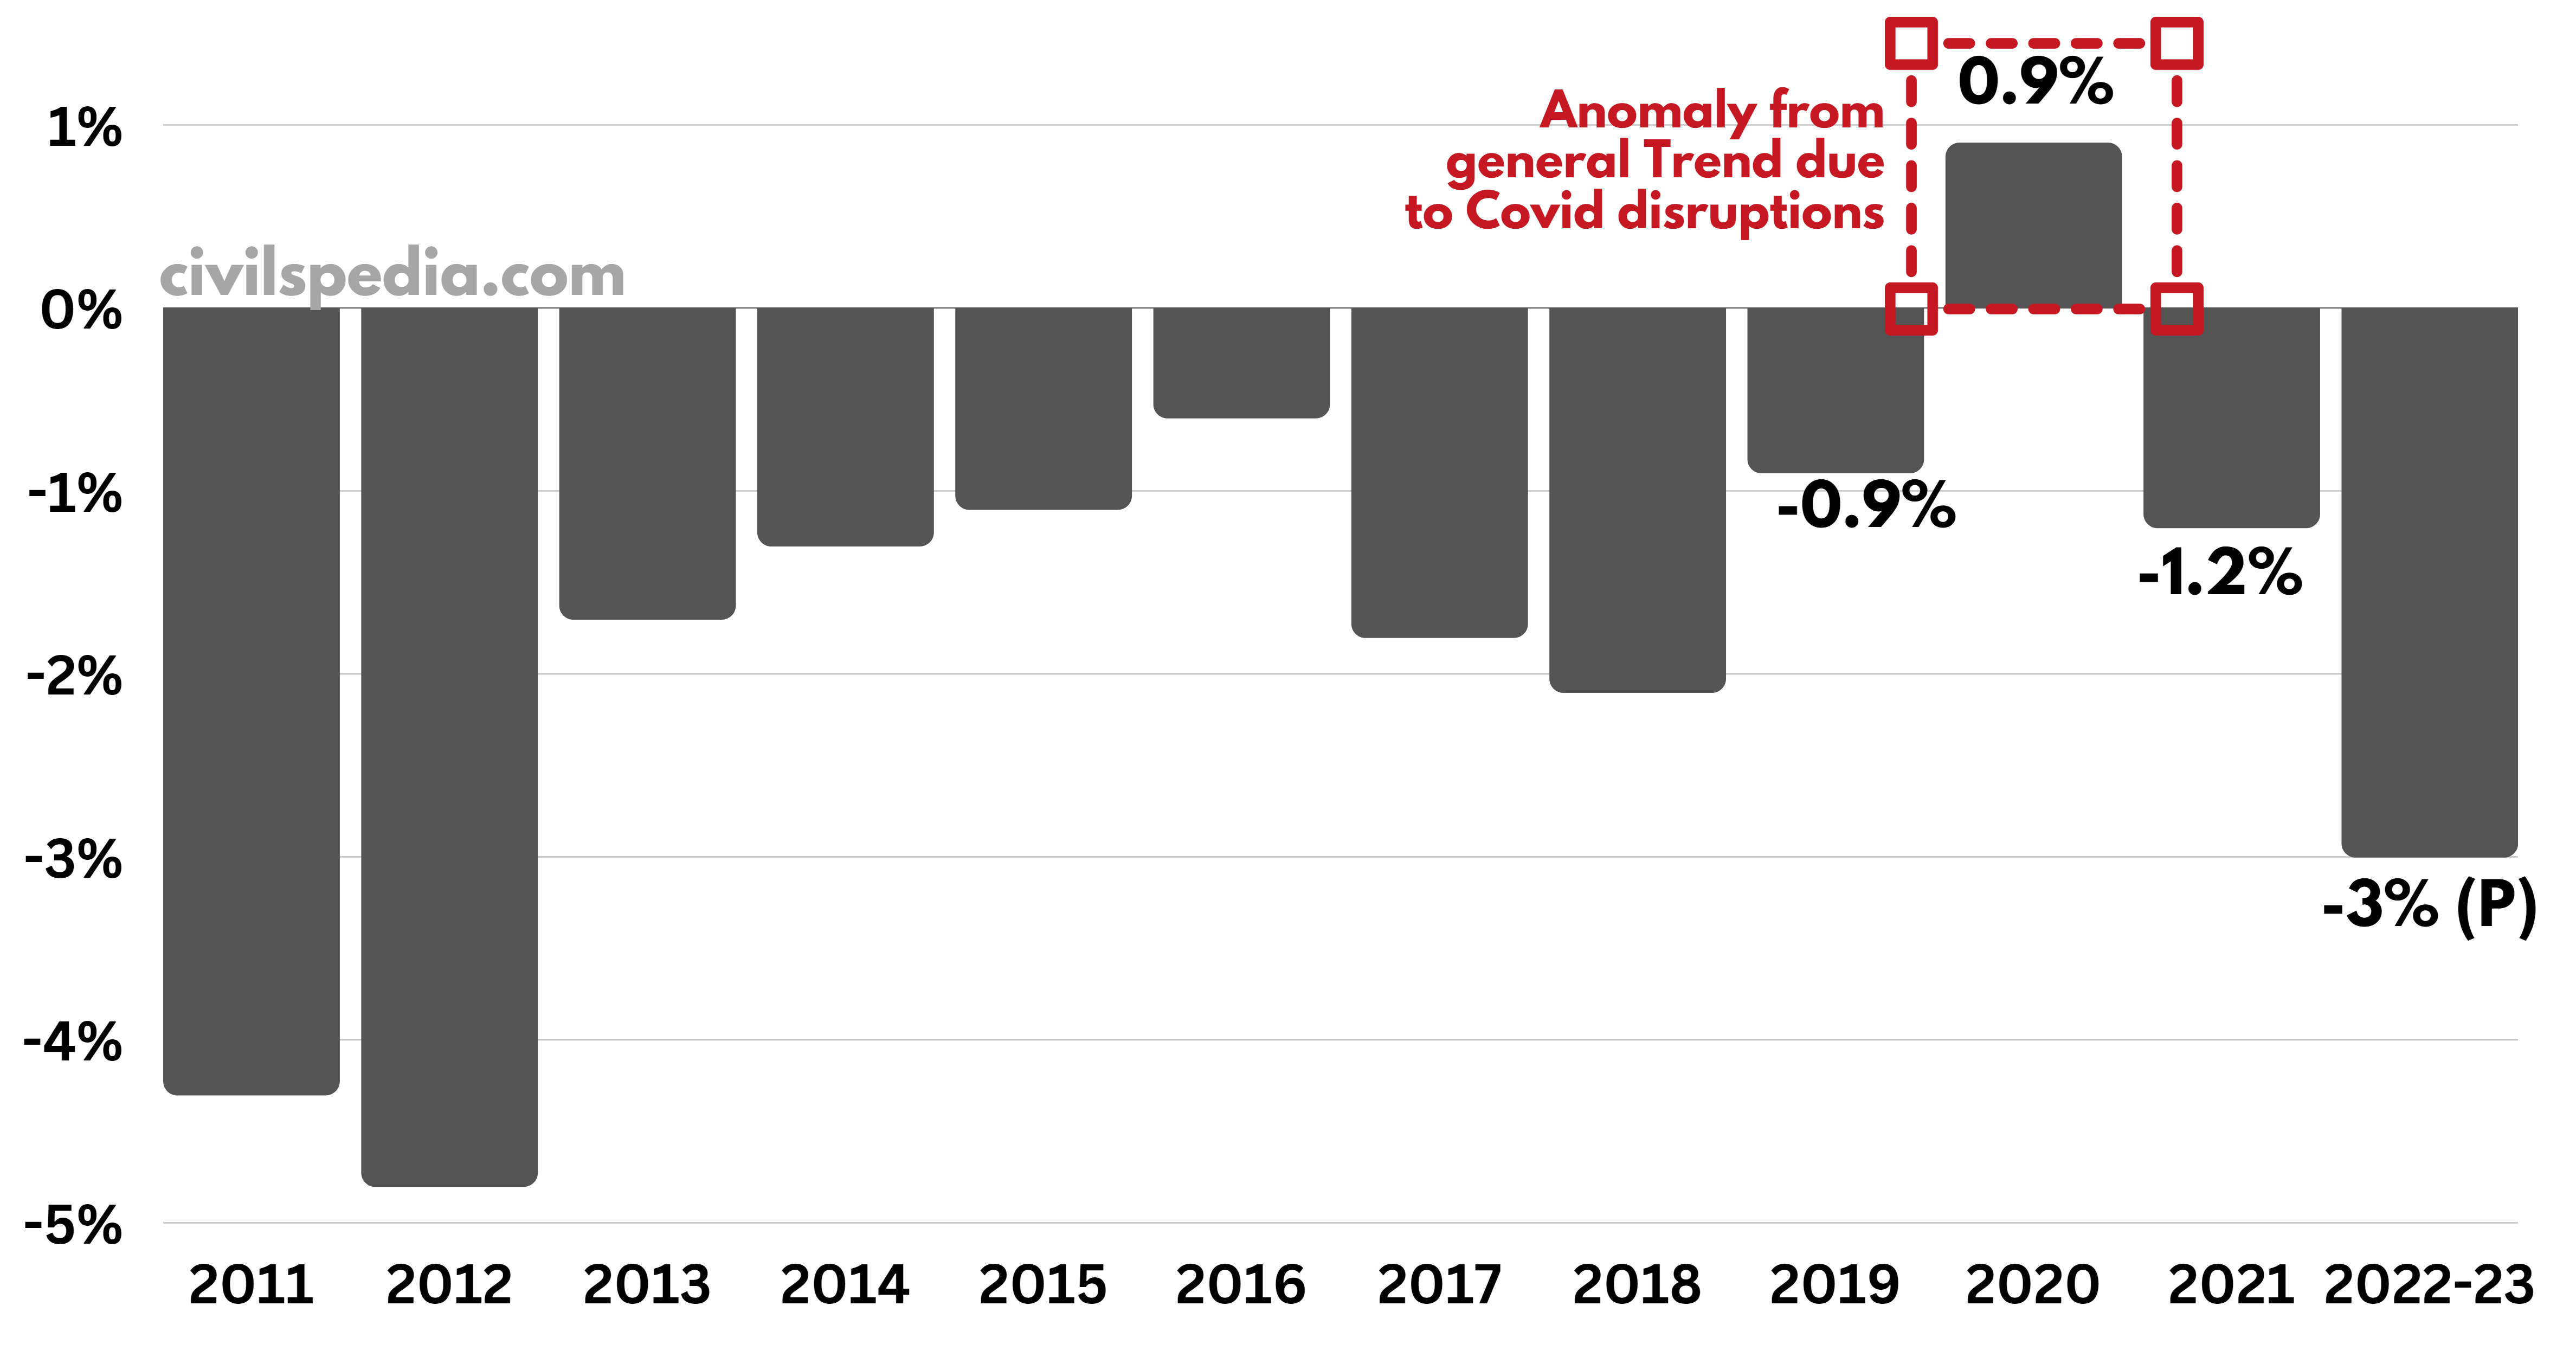
Based on a historical perspective, India can sustain a CAD of 2.5-3.0% of GDP without getting into an external sector crisis.
Note: From 2001 to 04, India had a Current Account Surplus because Indian exports to Western economies were booming, especially in the wake of the BPO revolution in India.
Current Account Deficit is not considered good
- If CAD increases, the currency of the country weakens.
- For a country like India, which has high imports, it increases the cost of imports impacting the economy negatively.
CAD for 2023-24 can be a challenge as
- The prices of commodities that India imports (like petroleum, gold etc.) have reached record-high levels. Additionally, there is strong pent-up domestic demand for foreign goods in India.
- Due to the slowdown in the advanced economies, the global demand for Indian goods is low.
- The rupee has been weakening against the US dollar, further increasing the cost of imports.
Side Topic : Major Importers and Exporters of India
| Importers of Indian Products | 1. USA (16% of India’s exports are sent to the USA) 2. United Arab Emirates 3. Netherlands 4. China |
| Exporters to India | 1. China (14% of all Indian imports are from China) 2. USA 3. United Arab Emirates 4. Saudi Arab 5. Iraq |
It has to be noted that
- India has a large Trade Deficit with China, Saudi Arabia, Iraq, Germany, South Korea, Switzerland and Indonesia.
- India has been diversifying its export destinations. E.g., South Africa, Brazil, Saudi Arabia etc.
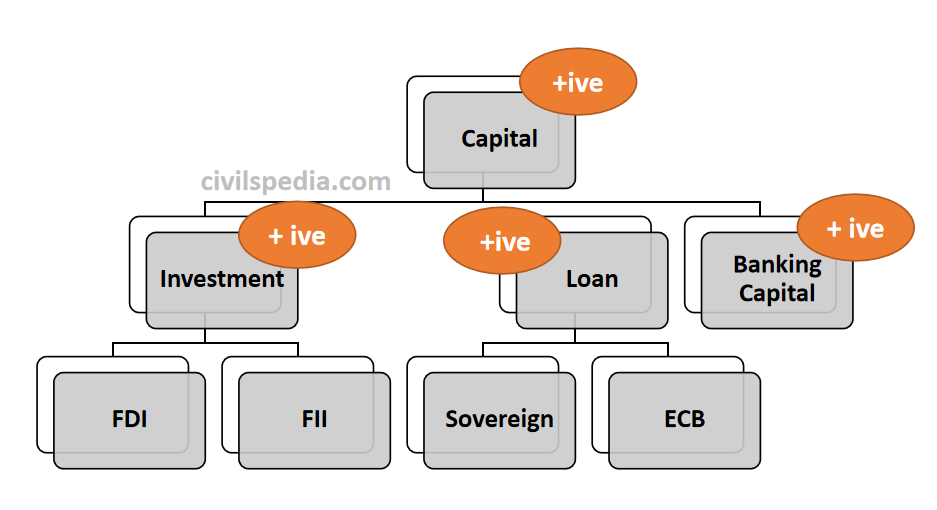
Part 2: Capital Account
The Capital Account is the second account, recording all international purchases and sales of assets such as money, stocks, bonds, etc., for a specified time, usually a year.
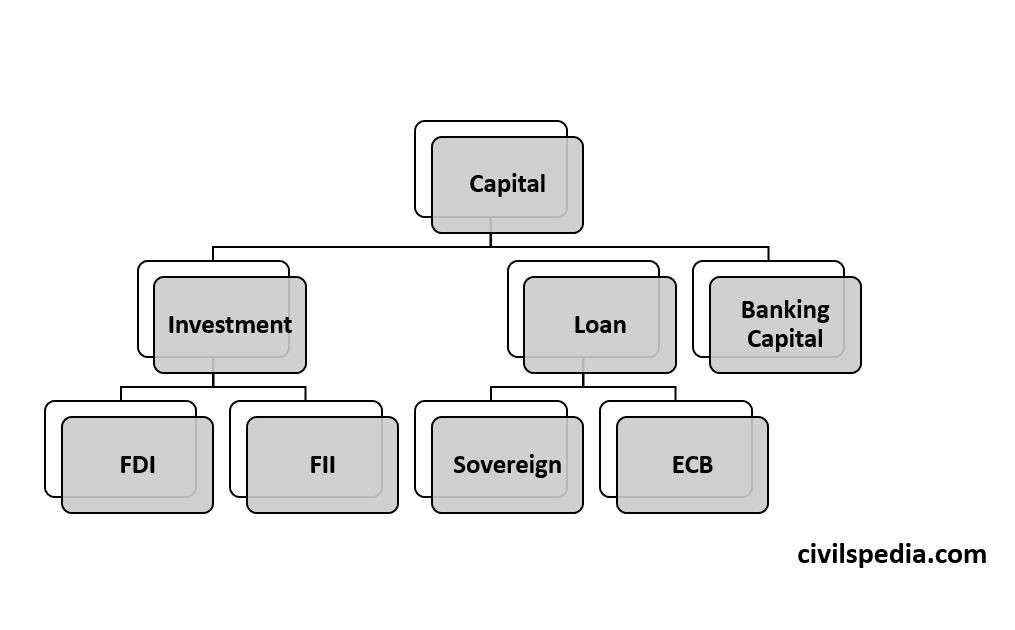
Investment – FDI & FPI
What constitutes Foreign Direct Investment (FDI) ?
- According to Arvind Mayaram Panel, more than 10% of equity investment made by a foreign entity into an Indian company with the motive of getting involved in the management of that Indian company is known as FDI.
- E. g. : Walmart of USA has 77% stakes in Flipkart.
What constitutes Foreign Portfolio Investors (FPI) ?
- FPIs are foreign entities registered with SEBI and have up to 10% equity in an Indian Company.
- FPIs are not involved in the management of a company. Their primary motive is to earn profit by buying and selling shares.
- Note: Till 2019, the summation of all the FPIs in a company could be at most 24%. But in the 2019 Budget, the government removed the 24% cap.
Sector-wise Foreign Investment (FDI + FPI) Limit
Note: The list is not exhaustive and keeps changing frequently. For the latest limits, please cross-check government sources as well
| 100% FDI allowed | 1. Single Brand Retail 2. E-commerce (marketplace model) 3. Defence Industry 4. Railway Infrastructure (Construction, operation and maintenance) 5. Industrial Parks 6. Telecom services 7. Pharma Companies 8. Contract manufacturing 9. Asset Reconstruction Company (ARC) 10. Floriculture, Horticulture, and Cultivation of Vegetables 11. Animal Husbandry, Pisciculture, Aquaculture, Apiculture 12. Plantation : Only in plantations of Tea, Coffee , Rubber , Cardamom , Palm oil and Olive oil tree plantations 13. Airports (both Greenfield and Brownfield projects) 14. Air Transport Services 15. Maintenance and Repair in air transport 16. Mining and Exploration of metal and non-metal ores 17. Coal and lignite 18. Exploration activities of oil and natural gas fields 19. DTH and Cable Networks 20. Non-news channels |
| 74% | 1. Private Banks 2. Private Security Agencies |
| 51% | 1. Multi Brand Retail Trading |
| 49% | 1. Insurance Company 2. Pension Sector Companies 3. Power Exchanges 4. FM and News channels |
| 26% | 1. Digital Media 2. Newspapers and periodicals |
| 20% | 1. Public Sector Banks |
| Prohibited | 1. E-commerce ( inventory based model ) 2. Atomic energy 3. Railway operations (except Metro) 4. Tobacco Products like cigars , cigarillos and cigarettes 5. Real Estate Business and Farm Houses 6. Chit Funds and Nidhi Companies 7. Betting , Gambling, Casino & Lottery. |
Foreign Investment Promotion Board (FIPB)
- Foreign Investment is permitted either through:
- Automatic Route: i.e. Foreign entities don’t require Indian Government’s approval.
- Government Route: i.e. Approval of the Government is required prior to investment.
- Earlier, this approval was given by FIPB. But, Budget 2017 removed this Board to promote Ease of Doing Business by removing Red-Tapism in bureaucratic decision-making and reducing the time for mergers and acquisitions.
- Now, Government approval is given by the Commerce Ministry after consultation with the subject ministry.
FDI in India
1. Sector Wise
Sectors receiving maximum FDI in India are
- Computer Hardware
& Software (44%) - Construction (13%)
- Services (8%)
2. Country-wise
Countries with maximum FDI in India are
- Singapore
- Mauritius
- UAE
- USA
3. States with Maximum FDI
Indian states having maximum FDI are
- Gujarat (27%)
- Maharashtra (27%)
- Karnataka (13%)
4. State Wise Analysis
- A state-wise analysis of FDI
inflows to different Indian states shows a clear regional disparity in FDI
inflows. Delhi, Haryana, Maharashtra, Karnataka, Tamil Nadu, Gujarat and
Andhra Pradesh have together attracted more than 70 % of total FDI inflows
to India during the last 15 years. - However, states with vast
natural resources, like Jharkhand, Bihar, Madhya Pradesh,
Chhattisgarh and Odisha, have not been able to attract foreign funds
directly for
investment in different sectors.
What government has done to attract FDI ?
- The Government has abolished Foreign Investment Promotion Board (FIPB)
- A number of sectors have been opened for FDI, including defence, construction, broadcasting, civil aviation etc.
- Investor Facilitation Cell has been created under Invest India Program to guide, assist & handhold investors.
- For some countries like Japan, a special program like Japan Plus has been started.
- The Insolvency and Bankruptcy Code has been passed to make an exit from non-viable businesses easier.
- “Foreign Investment Facilitation Portal (FIF Portal)” has been launched as the online single-point interface of the Government of India for investors to facilitate Foreign Direct Investment.
FDI & FPI Trends in India (2018-19)
| FDI | FDI is positive for India as India attracts significant investments in FDI. |
| FPI | – There is no general trend for FPI, and it can be positive or negative depending on the situation. – In FY 2023, there was a net outflow of the FPI (mainly due to Fed Tapering). |
Fed Tapering and FDI
The US and other advanced economies are witnessing very high rates of inflation due to the following reasons
- Loans
were provided at an ultra-low interest rate during the Covid pandemic to
boost the economy. - Supply chain disruptions due
to the Russia-Ukraine war.
To combat inflation, the Federal Bank of America (the equivalent of RBI of India) has started to increase their Repo Rate, thus making the loans expensive in the USA. This process is known as Fed Tapering.
Fed Tapering has an impact on India and other developing economies as well. When the Feds were following Easy Money Policy, US investors were investing their excess funds in India and other developing economies as the rate of return on the US bonds was extremely low. But when Feds started to increase Repo Rate, the Bond Yield on US bonds increased, and investors started to take their money out of India. E.g., the bond yield on a 10-year US bond was 0.54% in July 2020 and raised to 3.30% in Feb 2023.
Overall, Fed Tapering has the following impacts on the Indian economy
- Flight of FPI and FDI from India (as explained above)
- The flight of investment leads to a fall in Rupee vis-à-vis US Dollars
- The inflation from the US economy is exported the world over.
Loans
- In loans, the Indian account is +ive.
- Internally, Private External Commercial Borrowing is more than Sovereign foreign debt.
- Such loans are beneficial during good times as borrowers could enjoy the benefits like lower interest rates, longer maturity, and capital gains. But sharp depreciation in local currency would mean a corresponding increase in debt service liability, as a more domestic currency would be required to buy the same amount of foreign exchange.
Composition of Indian Debt
| Tenure Wise | Long Term (78%) more than Short Term (22%) |
| Sector Wise | Private Sector (80%) more than Public Sector (20%) |
| Currency Wise | Dollar (55%) > ₹ denominated > SDR > Yen > Euro |
Banking Capital
Banking Capital has two components
- FCNR Deposits of NRIs (+ive for India)
- General (+ive for India)
FCNR Accounts
- FCNR Deposit = Foreign Currency Non-Resident Deposits
- NRIs can deposit their $ (or other foreign currency) in Indian Banks via FCNR Accounts.
- Interest to be paid on FCNR deposits is tied up with LIBOR (London Interbank Offered Rate).
Capital Surplus
India’s Capital Account is in Surplus.
Balance of Payment condition of India
The outcome of the total transactions of an economy with the outside world in one year is known as the Balance of Payment (BoP) of the economy. It is the net outcome of an economy’s current and capital accounts.
The Balance of Payment can be positive or negative. However, negative doesn’t mean it is unfavorable for the economy until it has the means to fill the gap with the help of its forex reserves.
Various conditions
Positive BoP
- If the Balance of Payment is positive at the end of the year, the money is automatically transferred to the foreign exchange reserves of the economy.
Negative BoP
- If the Balance of Payment is negative at the end of the year, the foreign exchange is drawn from the country’s forex reserves.
- If the forex reserves cannot fulfil the negativity created by the BoP, it is known as a BoP crisis. India faced such a situation in 1991 when India was forced to take forex help from the IMF.
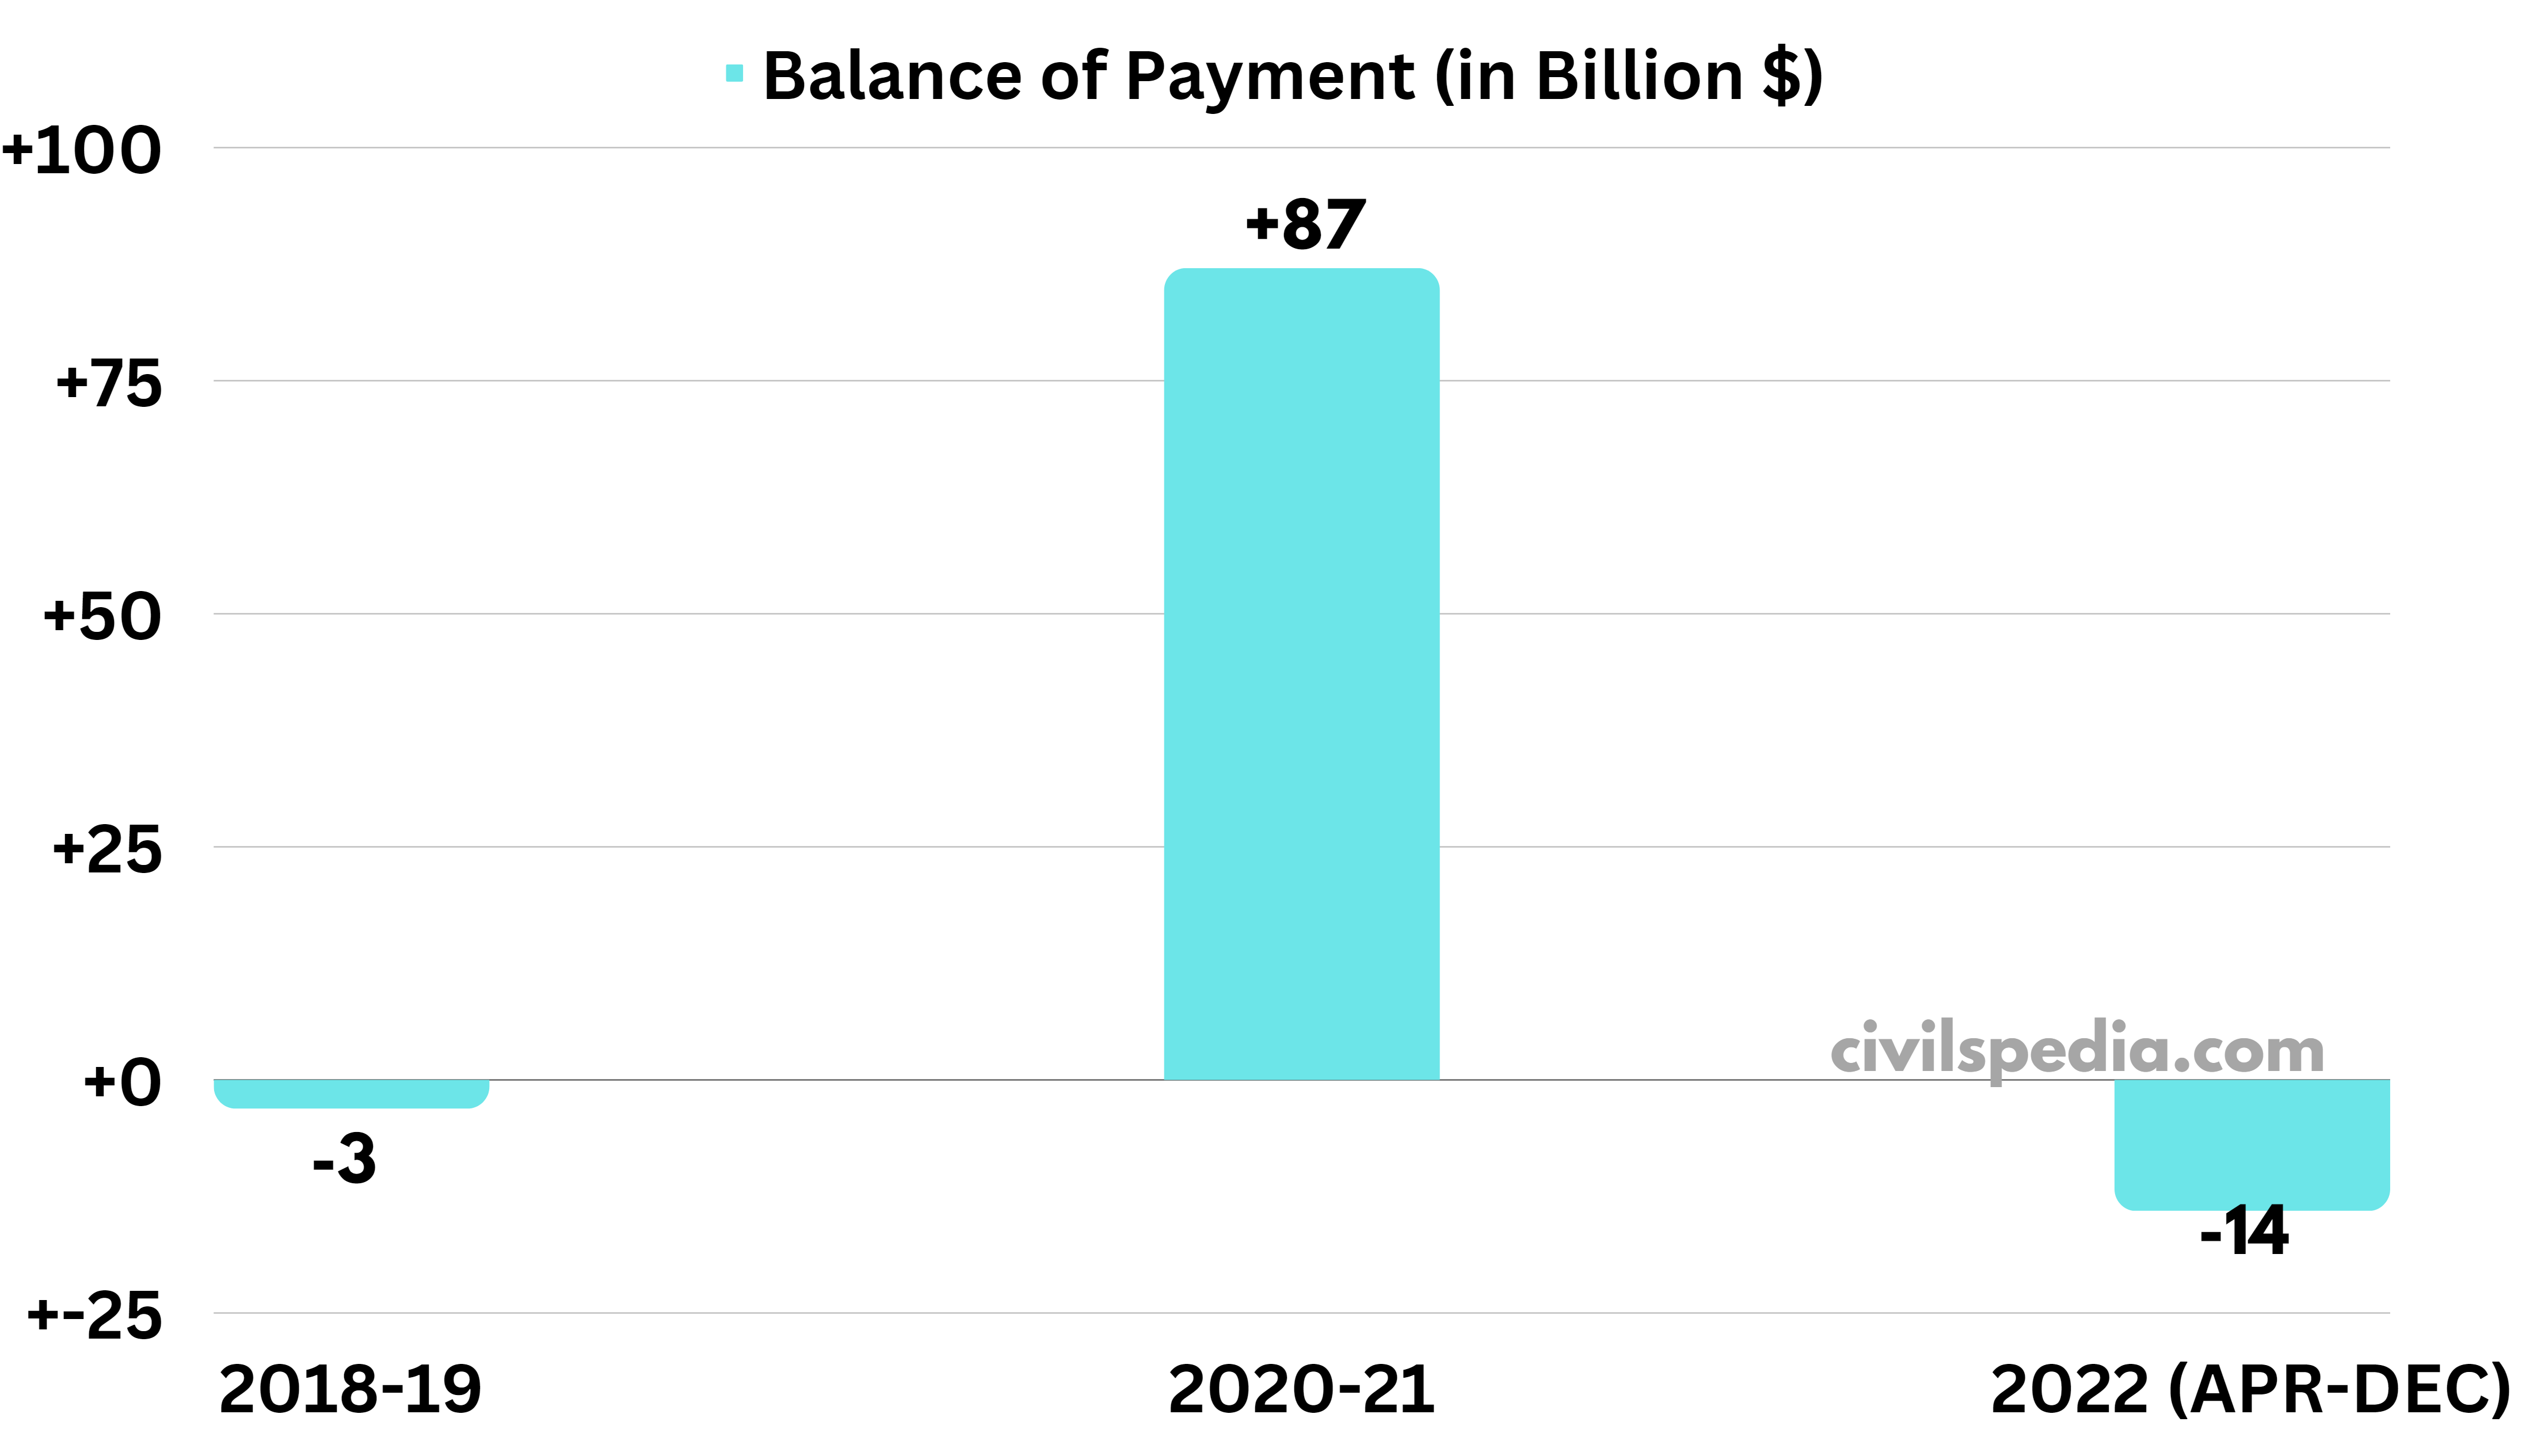
India’s BoP position (for 2022-23)
- Only preliminary data was
presented in the Economic Survey (2023). For period Apr-Dec 2022, India
Balance of Payment -14 billion.
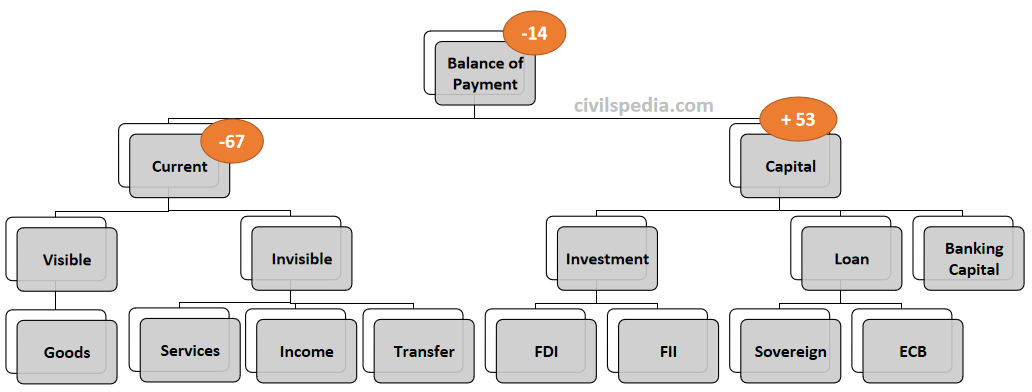
- But India has forex reserves of more than $ 560 billion. Hence, India faced no problem in bridging the gap.
Trends in previous years