Defining Pollution
This article deals with ‘Defining Pollution – UPSC.’ This is part of our series on ‘Environment’, which is an important pillar of the GS-3 syllabus. For more articles on Science and technology, you can click here
What is Pollution?
- Pollution is the undesirable change in biological, chemical and physical characteristics due to human and natural activities.
- Pollutants are the agents which cause pollution.
Types of Pollutants
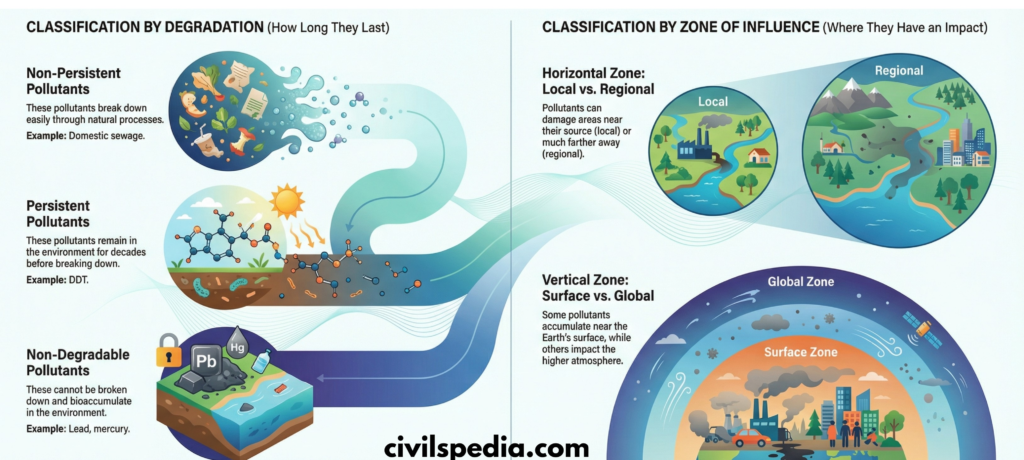
#1 On the Basis of Degradation
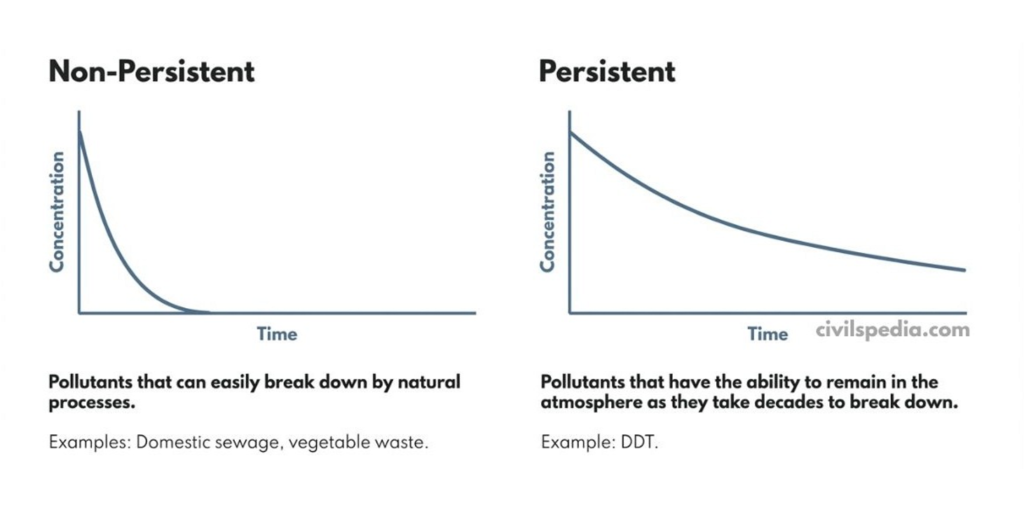
1. Non-Persistent Pollutants
- Pollutants that can easily break down by natural processes.
- For example, domestic sewage and vegetable waste.
2. Persistent Pollutants
- Pollutants that have the ability to remain in the atmosphere as they takes decades to breakdown.
- For Example, DDT
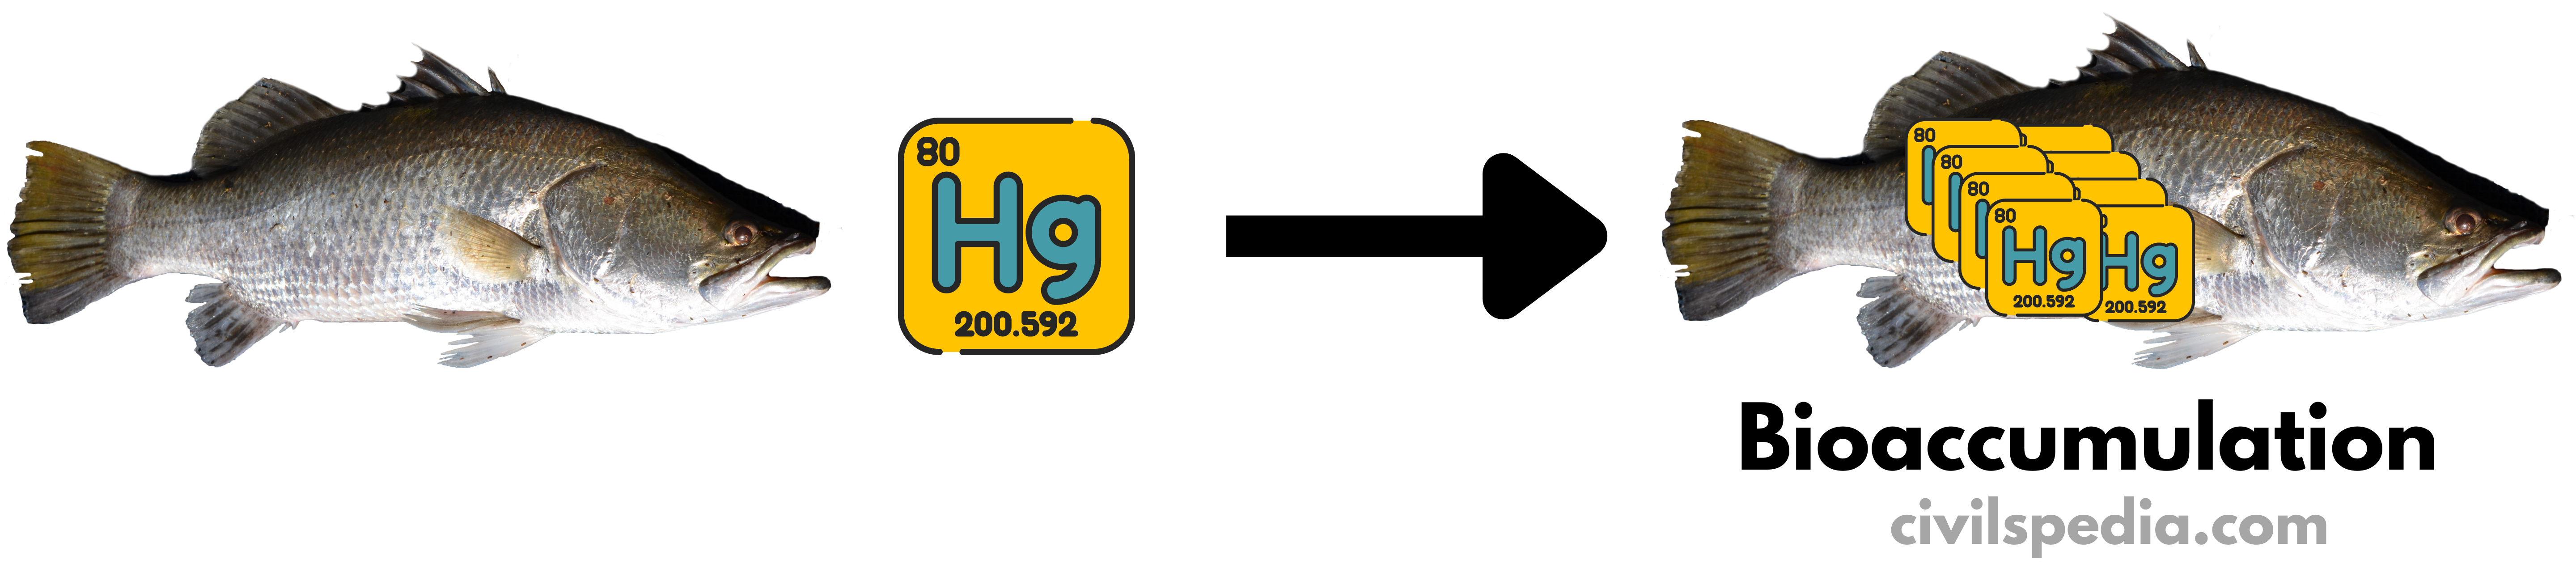
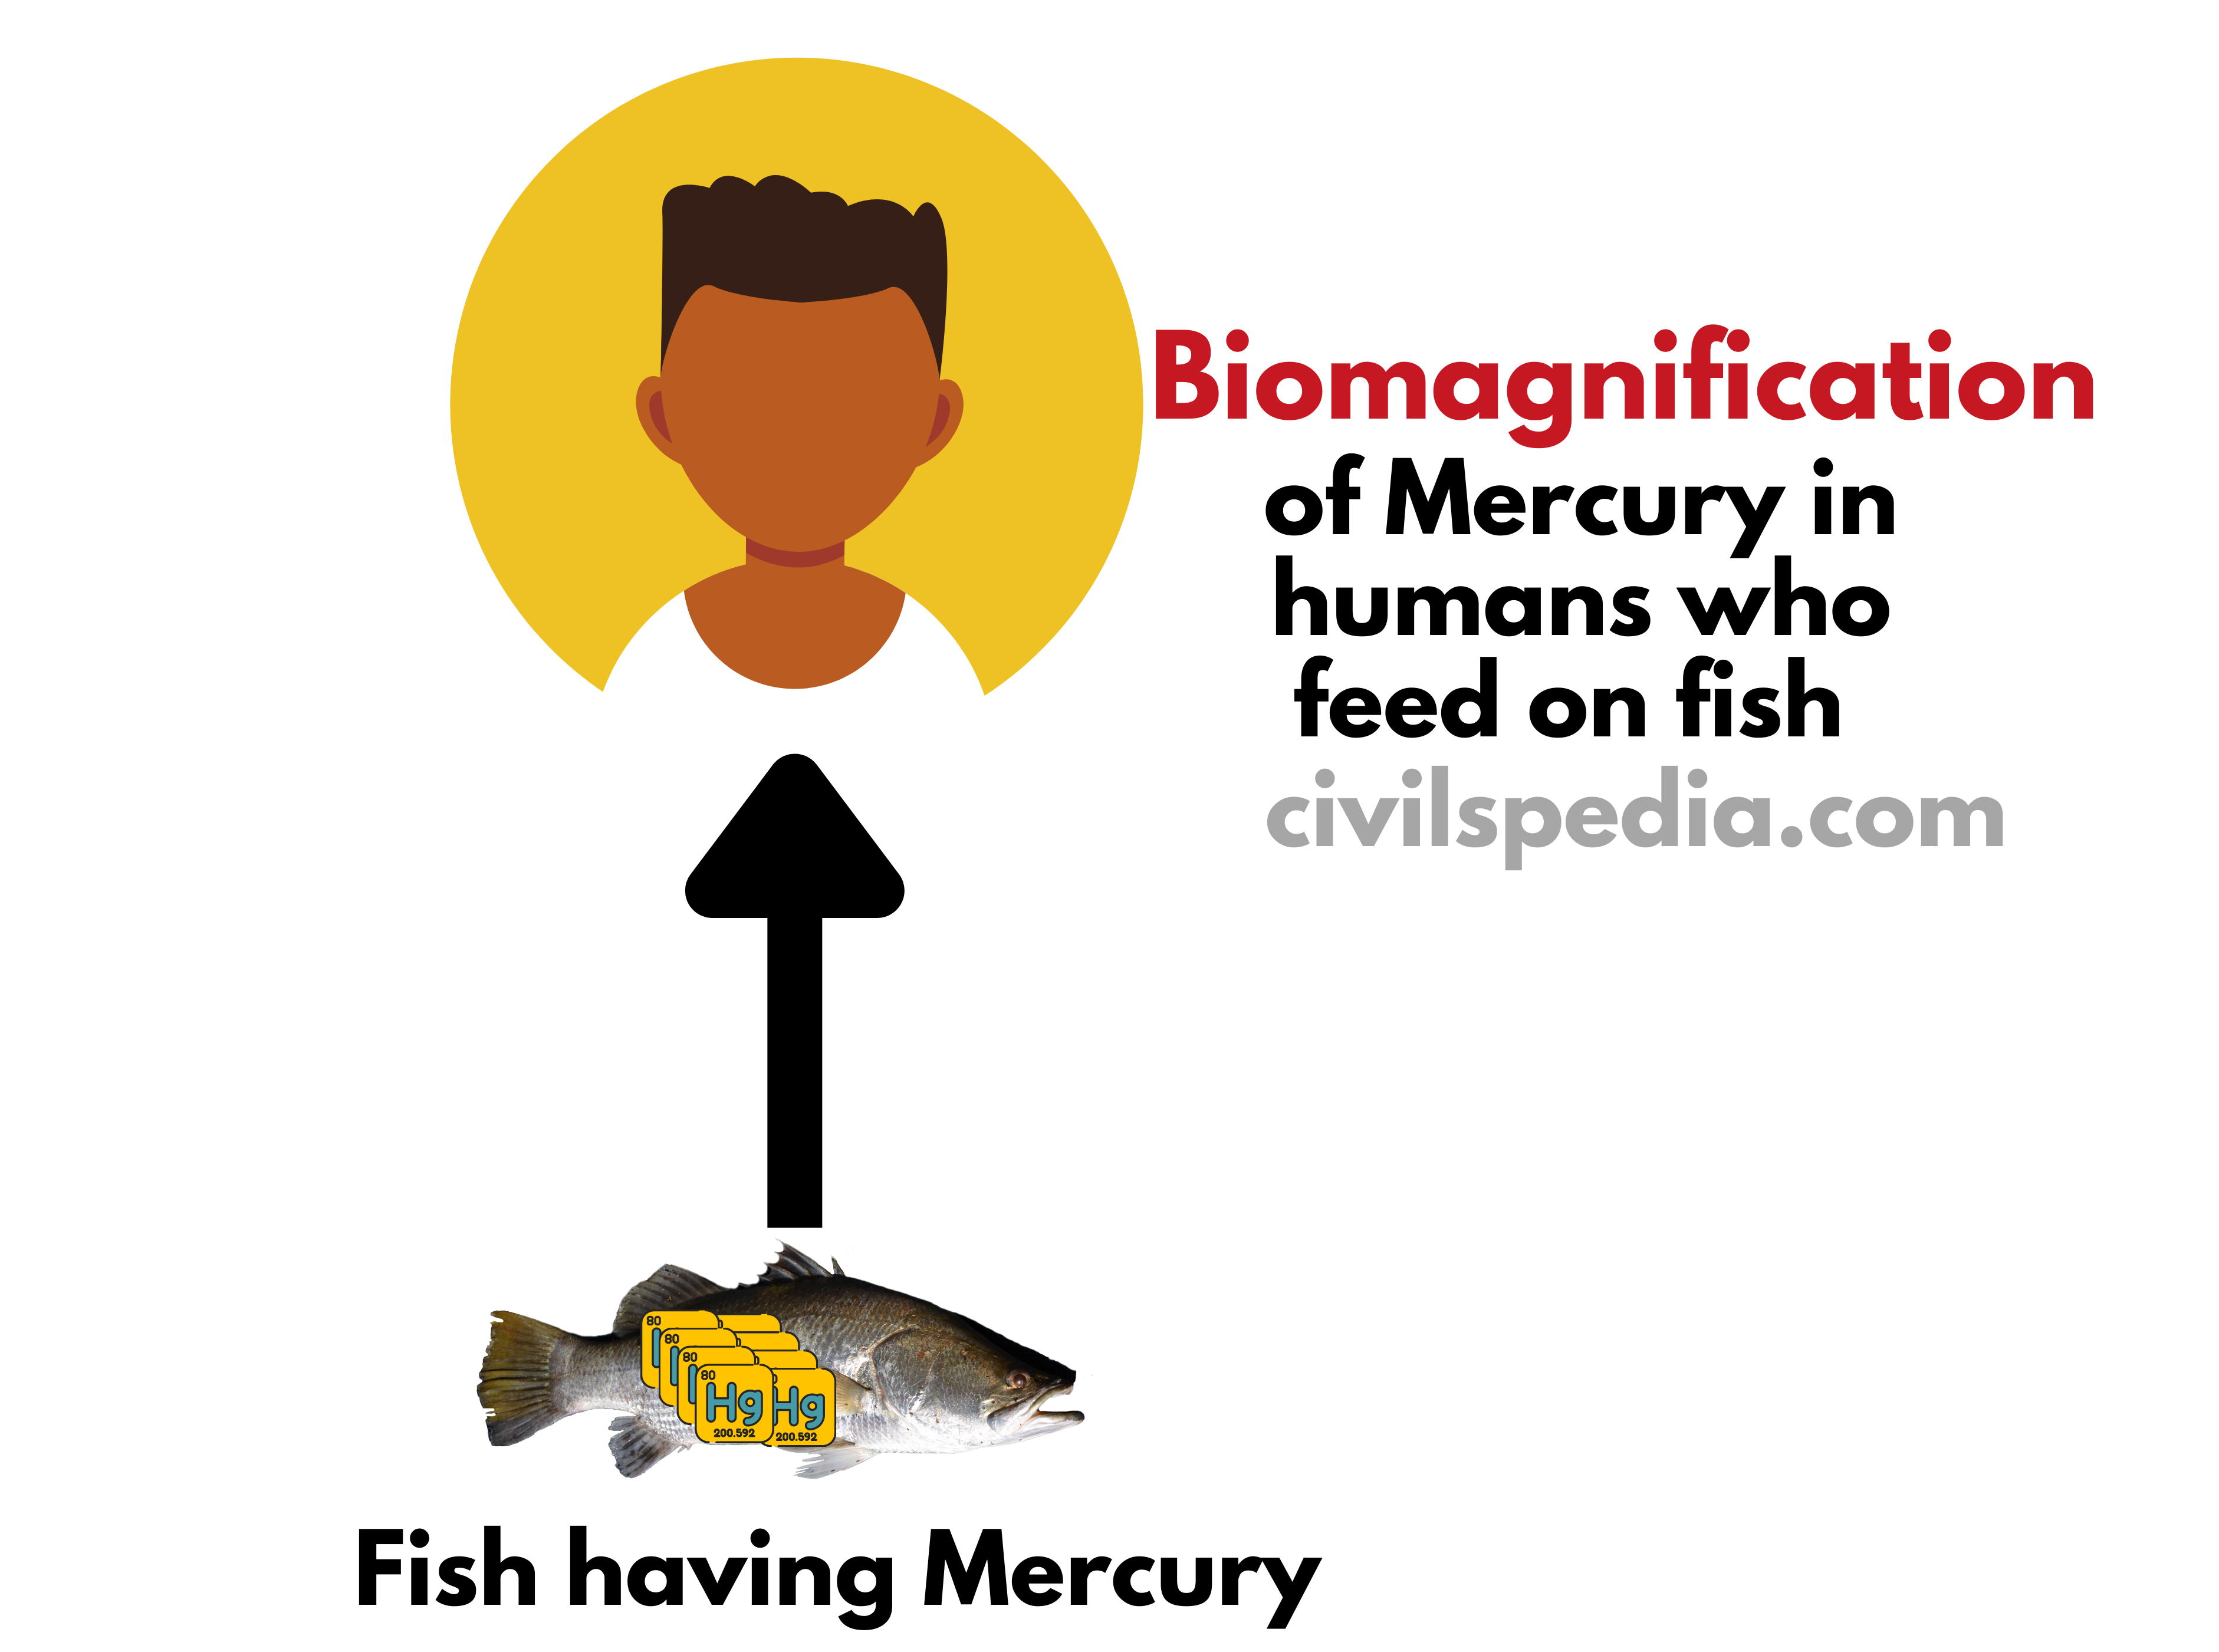
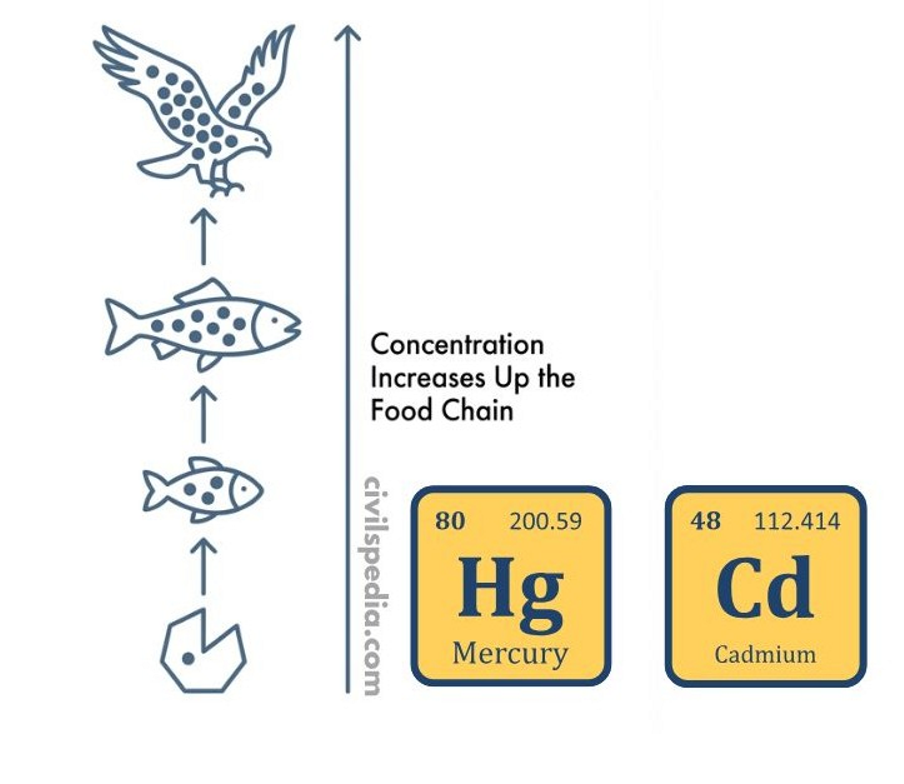
3. Non-Degradable Pollutants
- These pollutants can’t be degraded by natural processes. Hence, they remain in the atmosphere forever and bioaccumulate if they are released into the atmosphere.
- For Example, Toxic elements like lead, mercury, cadmium, chromium and nickel.
#2 On the basis of Zones of Influence
Pollutants can also be defined wrt their zones of influence
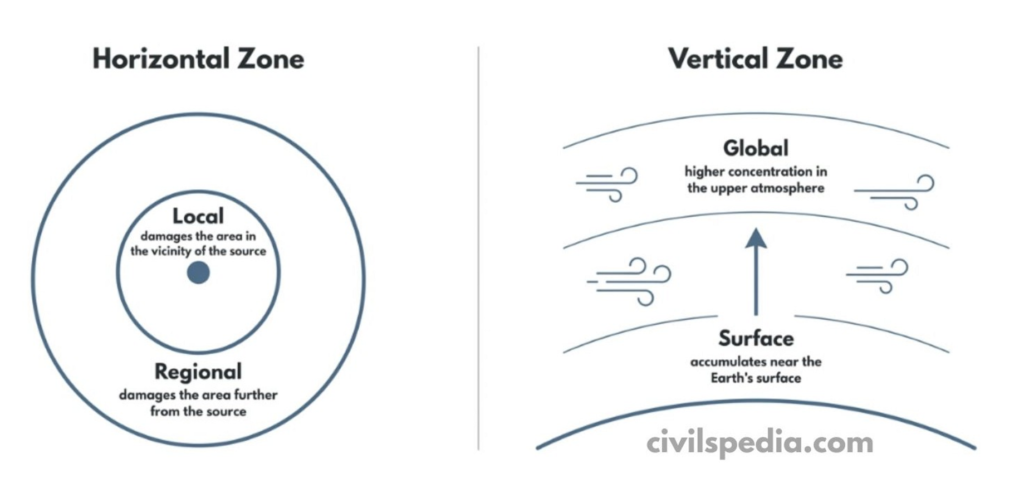
2.1 Horizontal Zone
It is defined wrt an area damaged by the pollutant
- Local Pollutant: They damage area in the vicinity of the source
- Regional Pollutant: They damage area further from the source
2.2 Vertical Zone
It is defined wrt the height up to which pollutants show their impact.
- Surface Pollutant: These pollutants accumulate near the Earth’s surface.
- Global Pollutants: These pollutants have a higher concentration in the higher atmosphere.
#3 Existence in Nature
3.1 Quantitative Pollutants
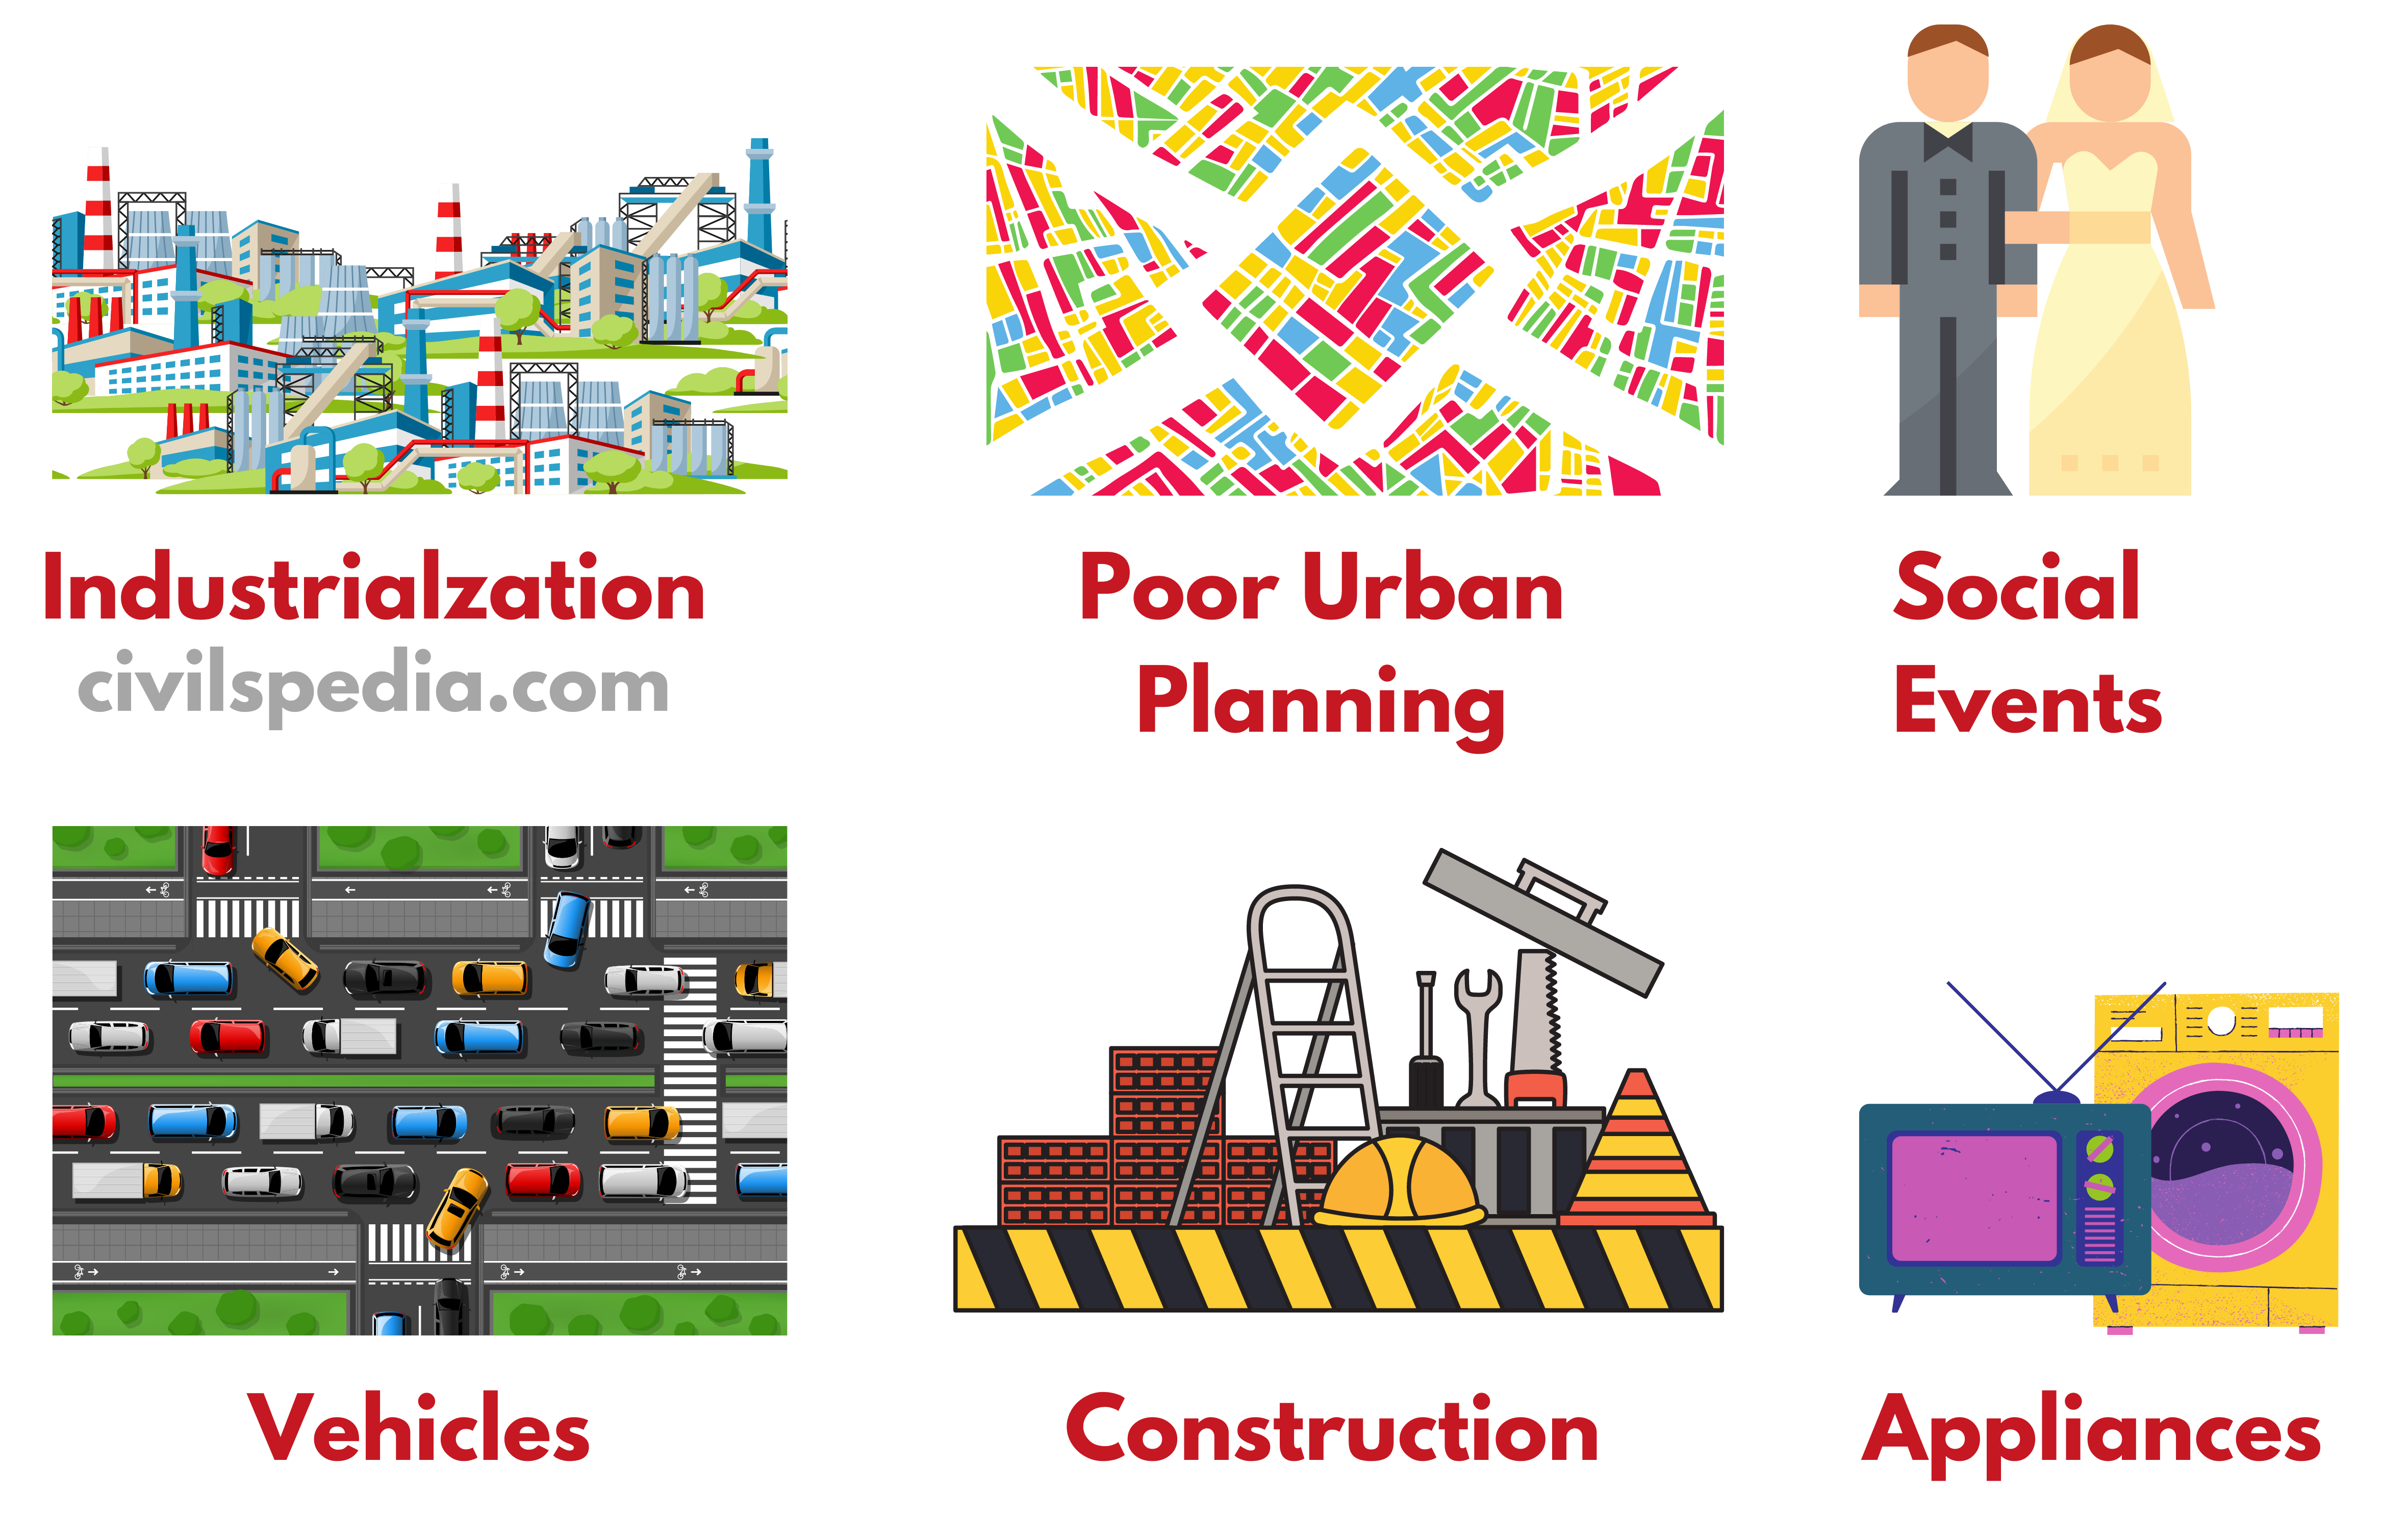
- Substances which are already present in the environment, but are termed as pollutants when their concentration (quantity) increases in the environment.
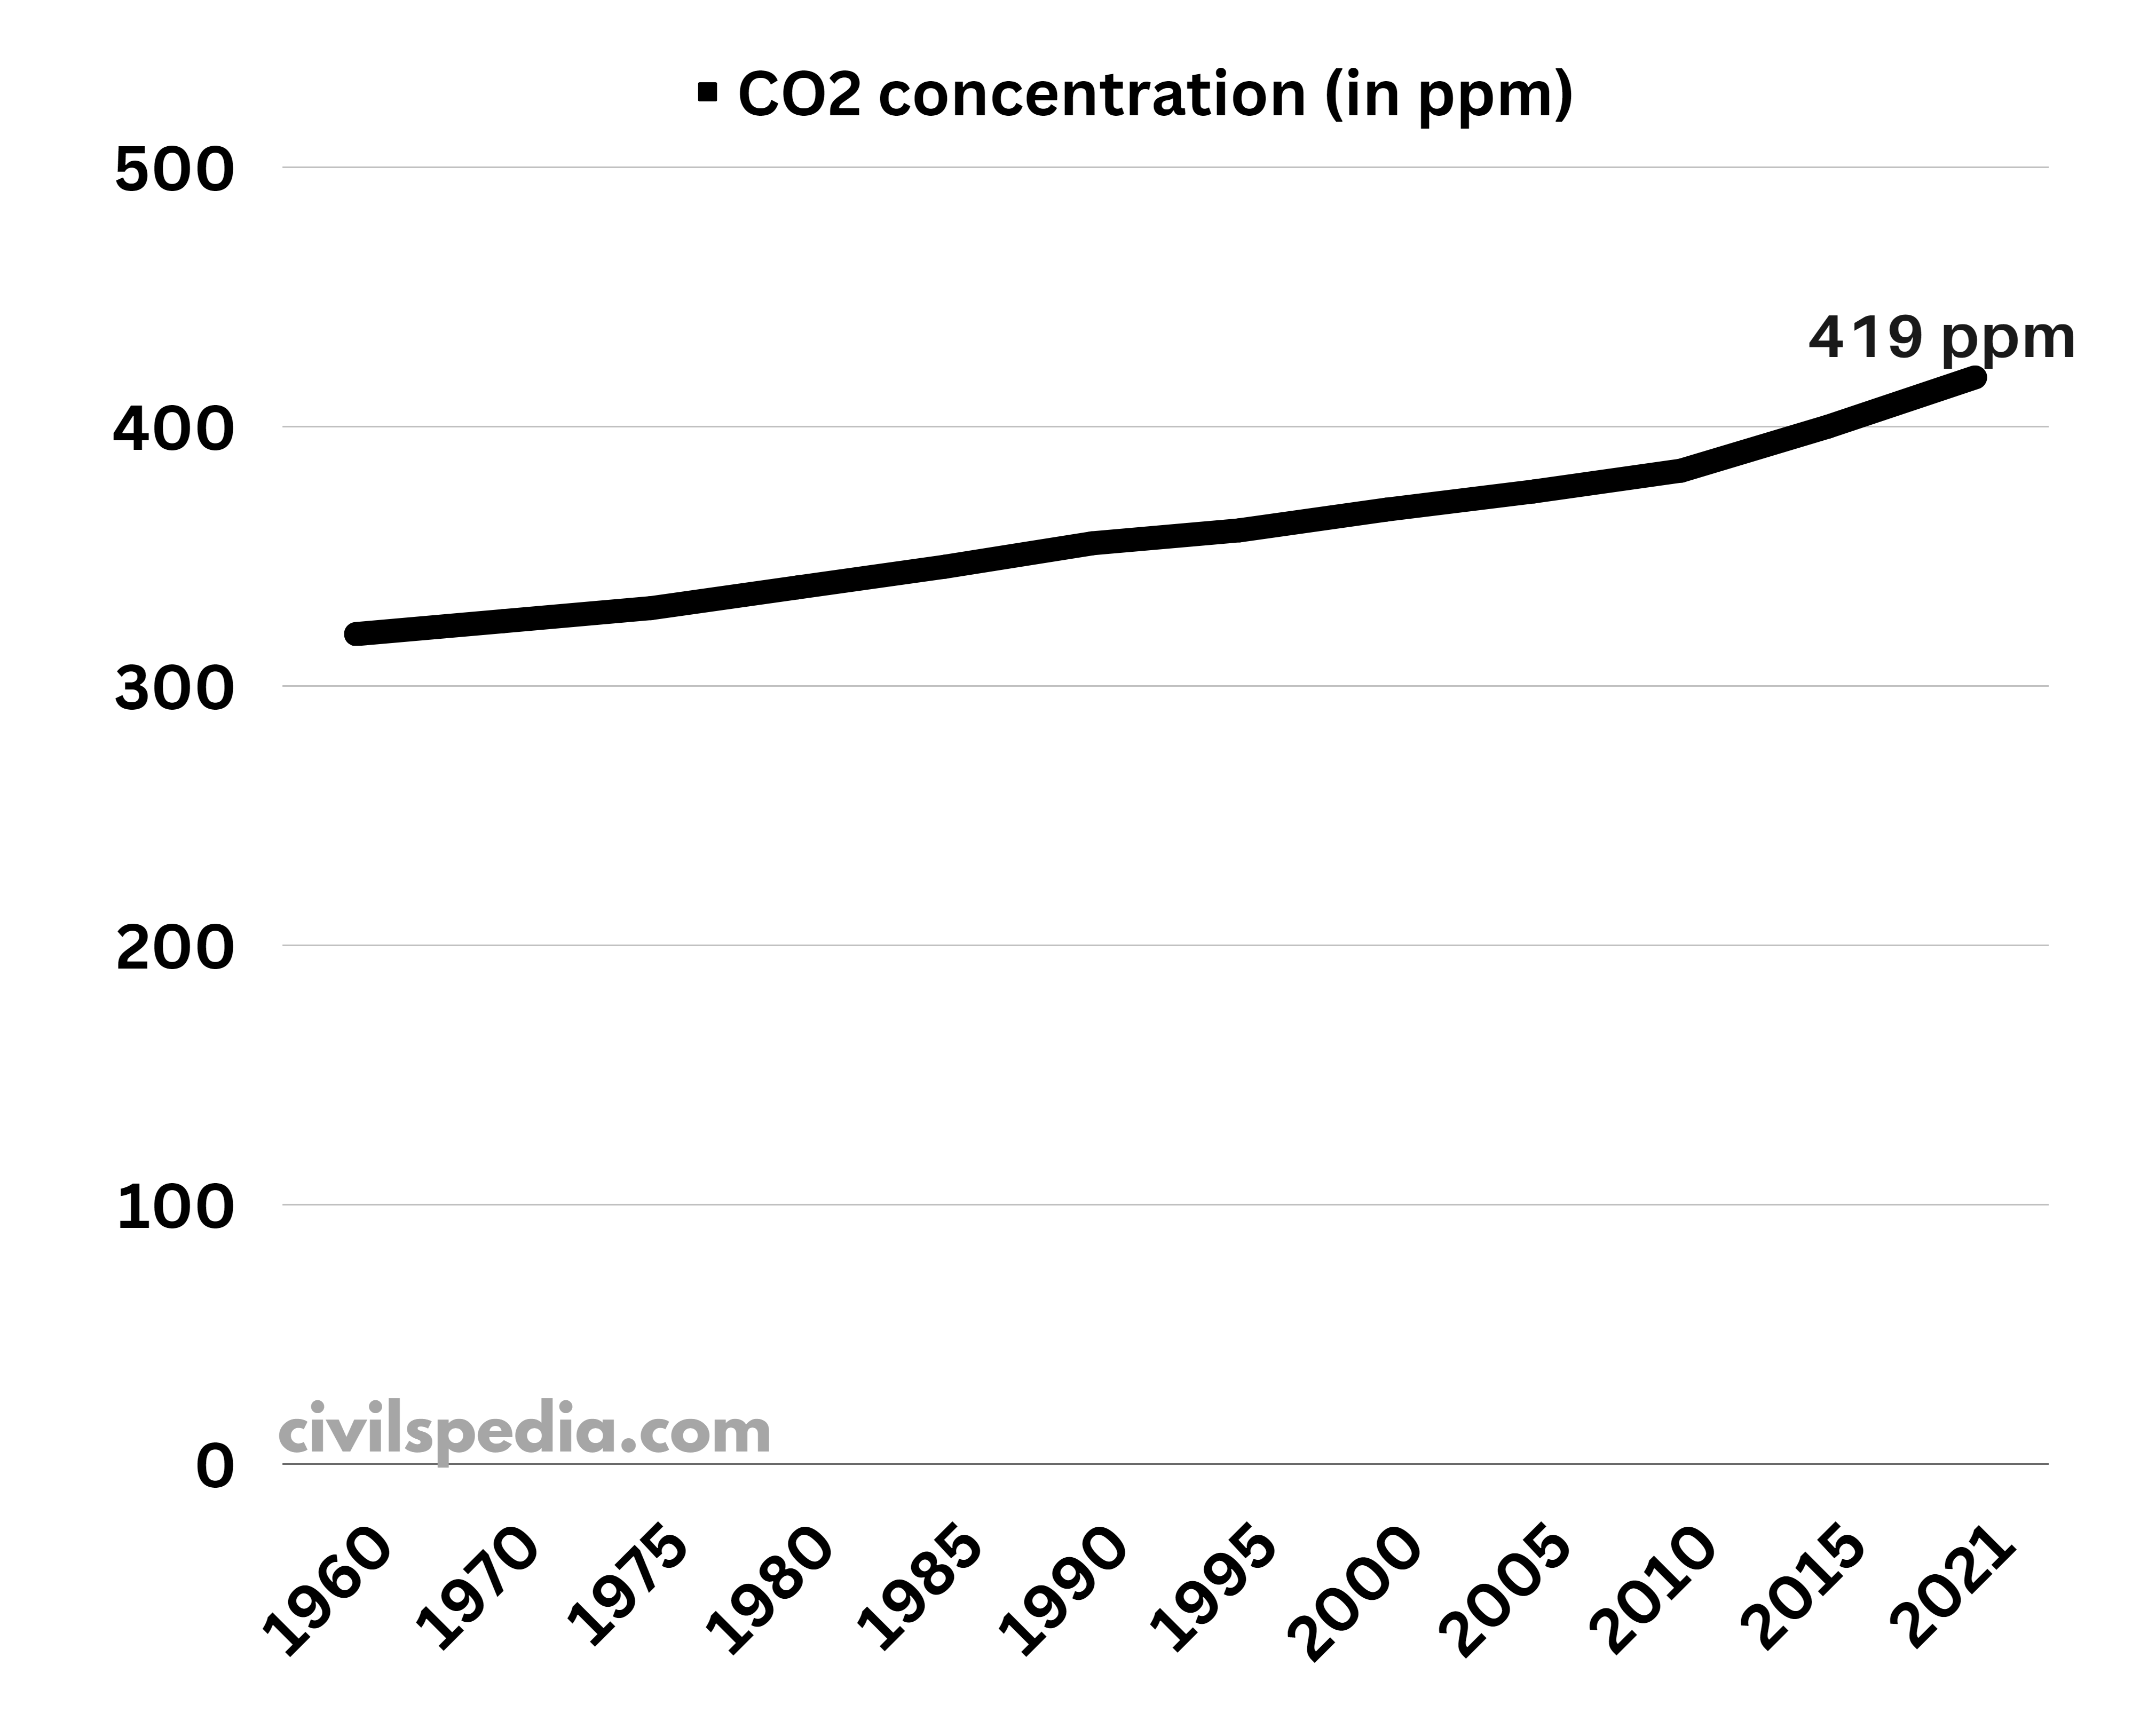
- E.g. : CO2 is present in the environment but when it’s concentration increases, it becomes pollutant.
3.2 Qualitative Pollutants
- Substances that are present ordinarily present in the atmosphere and don’t cause any harm. But they become pollutants only when their concentration increases beyond a certain limit.
- E.g., CO2 is present in the environment, but when its concentration increases, it becomes a pollutant.