Human Development Report

Last Update: June 2023 (Human Development Report)

Human Development Report

This article deals with ‘Human Development Report’ This is part of our series on ‘Economics’ and ‘Society’. For more articles , you can click here .


Introduction

UNDP defines Human Development as the process of widening people’s choices and raising the level of well-being.

For instance, look at the following example.

Human Development Report

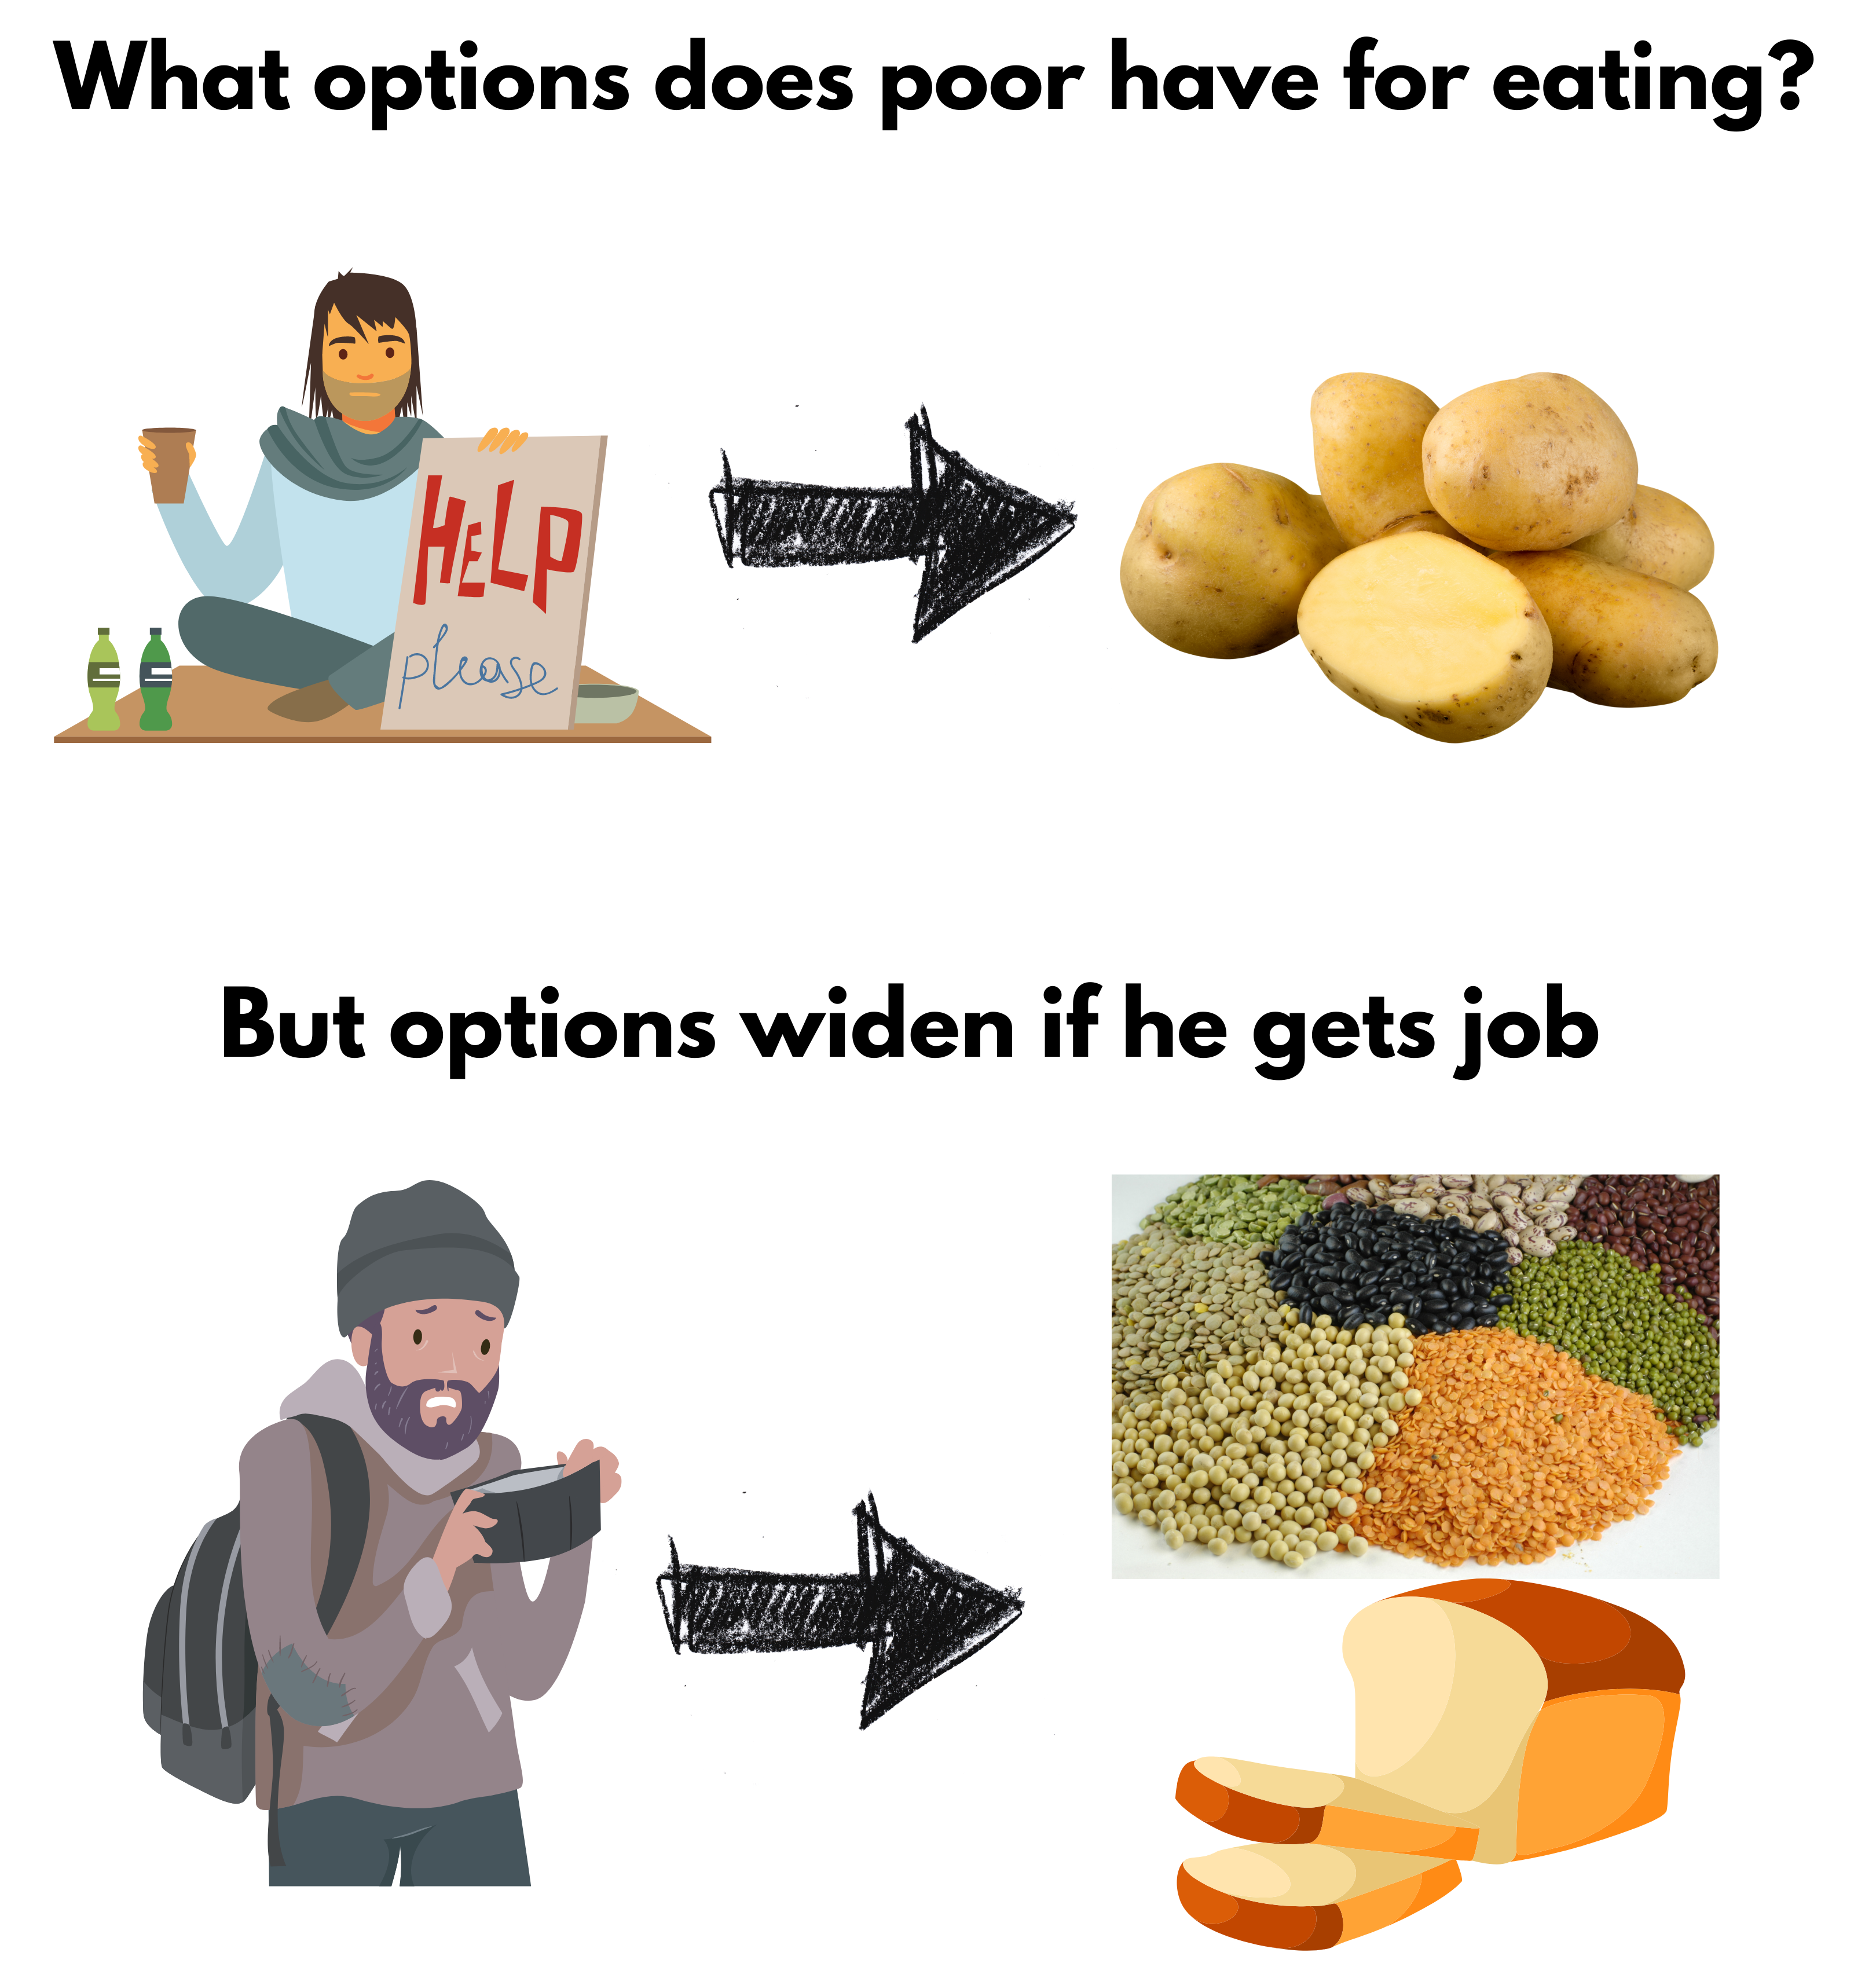
Human Development is the critical enabler for upward social mobility.


Human Development Report

  • It is prepared by the United Nations Development Program (UNDP) which provides a comprehensive analysis of human development across countries. 
  • In 1990, Mahbub-ul-Haq of Pakistan and Amartya Sen of India gave the concept of HDI. 
  • In various reports, it has been found that the Human Development of everyone is not taking place.
    • The human development of males is 20 points greater than females in South Asia.
    • Everywhere, the Human Development of elites and religious majorities is more than others.
    • Due to Climate Change, the Human Development of the present generation is more than what can be achieved by future generations. 

In Human Development Report, there are 5 Indexes.

  1. Human Development Index (HDI) 
  2. HDI – Inequality Adjusted 
  3. Gender Development Index(GDI) 
  4. Gender Inequality Index 
  5. Multi-dimensional Poverty Index (MPI)

The latest report for 2021/22 was released in 2022


1. Human Development Index  (HDI)

  • It was developed by United Nations Development Program (UNDP) in 1990 by a team headed by Prof. Mahbub ul Haq. Prof Amartya Sen was also a prominent member of this. 

Dimensions of HDI

Dimension Indicator 
Health Life Expectancy at Birth 
Knowledge Mean Years of Schooling
Expected Years of Schooling
Standard of Living GNI per capita
  • Switzerland topped the ranking in the latest report (2021/2022). India was ranked 132.

Indian Ranking

  Indian Ranking HDI Score
1990   0.429
2015 130 0.624
2016 131 0.624
2017 130 0.643
2018 129 0.647
2019 131 0.645
2021/22 132 0.633

Based on a report by the United Nations Development Program (UNDP), approximately 90% of nations have witnessed a decline in their Human Development Index (HDI) value during either 2020 or 2021. It signifies that global human development has come to a halt for the first time in 32 years.


2. Inequality-adjusted Human Development Index (IHDI)

  • Human Development Index is Geometric Mean. Hence HDI masks internal inequalities.
  • UNDP releases another Index which also accounts for inequalities.
  • HDI (Inequality adjusted) = HDI -(minus) HDI (lost due to Inequality), i.e. Human Development which is lost because of inequalities present in the country wrt gender is adjusted in this. 

IHDI (2022) Ranking

Rank Country HDI Score HDI-Inequality Adjusted Score
1 Iceland 0.959 0.915
2 Norway 0.961 0.908
—— —–    
108 India 0.633 0.475

When there is perfect equality, the HDI and the Inequality Adjusted HDI (IHDI) are equal. However, as the difference between the two increases, it indicates greater levels of inequality within the country.

Note: SDG Goal 10 calls for ‘reducing the Inequalities.’


3. Gender Development Index

  • The Gender Development Index (GDI) is a separate measurement released by the UNDP to complement the Human Development Index (HDI) to address females’ development specifically. 
  • While the HDI does not provide specific information on female development, the GDI calculates the ratio of Female HDI to Male HDI. 

GDI = Female HDI/ Male HDI.

  • If the Development Index for females exceeds that of males, the GDI can be greater than 1.

4. Gender Inequality Index

  • The Gender Inequality Index (GII) has been calculated since 2010.
  • Despite improvements in life expectancy and access to education for women, they still face specific forms of inequality, such as early pregnancies, lack of representation, and limited participation in economic activities. Therefore, the United Nations Development Programme (UNDP) introduced a specialized index to examine gender inequality.

Dimensions of Gender Inequality Index

Dimension Indicator 
Reproductive Health Maternal Mortality Rate
Adolescent Birth Rate
Empowerment Parliament Seats occupied by Women
Higher Education Attainment Levels
Economic Activity Female Labour Force Participation

The calculations used for the Gender Inequality Index (GII) are represented on a scale of 0 to 1, with 0 indicating no inequality (i.e., women fare equally to men) and 1 representing complete inequality (i.e., significant disparities between women and men).

GII (2022) Ranking

  • India is Ranked = 122 (Score: 0.490)
  • This score is better than that of the South Asian region (value: 0.508) and close to the world average of 0.465. This reflects the Government’s initiatives and investments towards more inclusive growth, social protection, and gender-responsive development policies. 

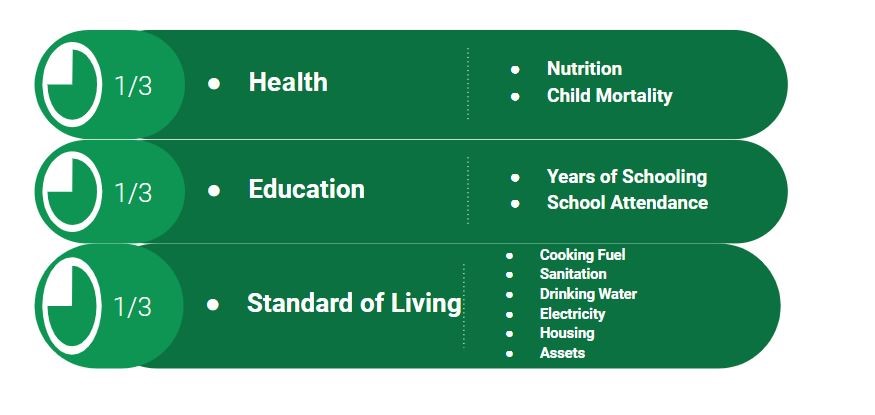
5. Multidimensional Poverty

  • In India, we calculate poverty using Tendulkar Method based on household consumption.
  • But UNDP takes a holistic view of poverty and measures it differently. 
  • The report has been released since 2010.
  • In Multidimensional Poverty, they look into the following components to measure poverty (HES)
    • Health with components like child mortality
    • Education with components like years of schooling
    • Standard of Living with components like electricity, water etc.
Multidimensional Poverty
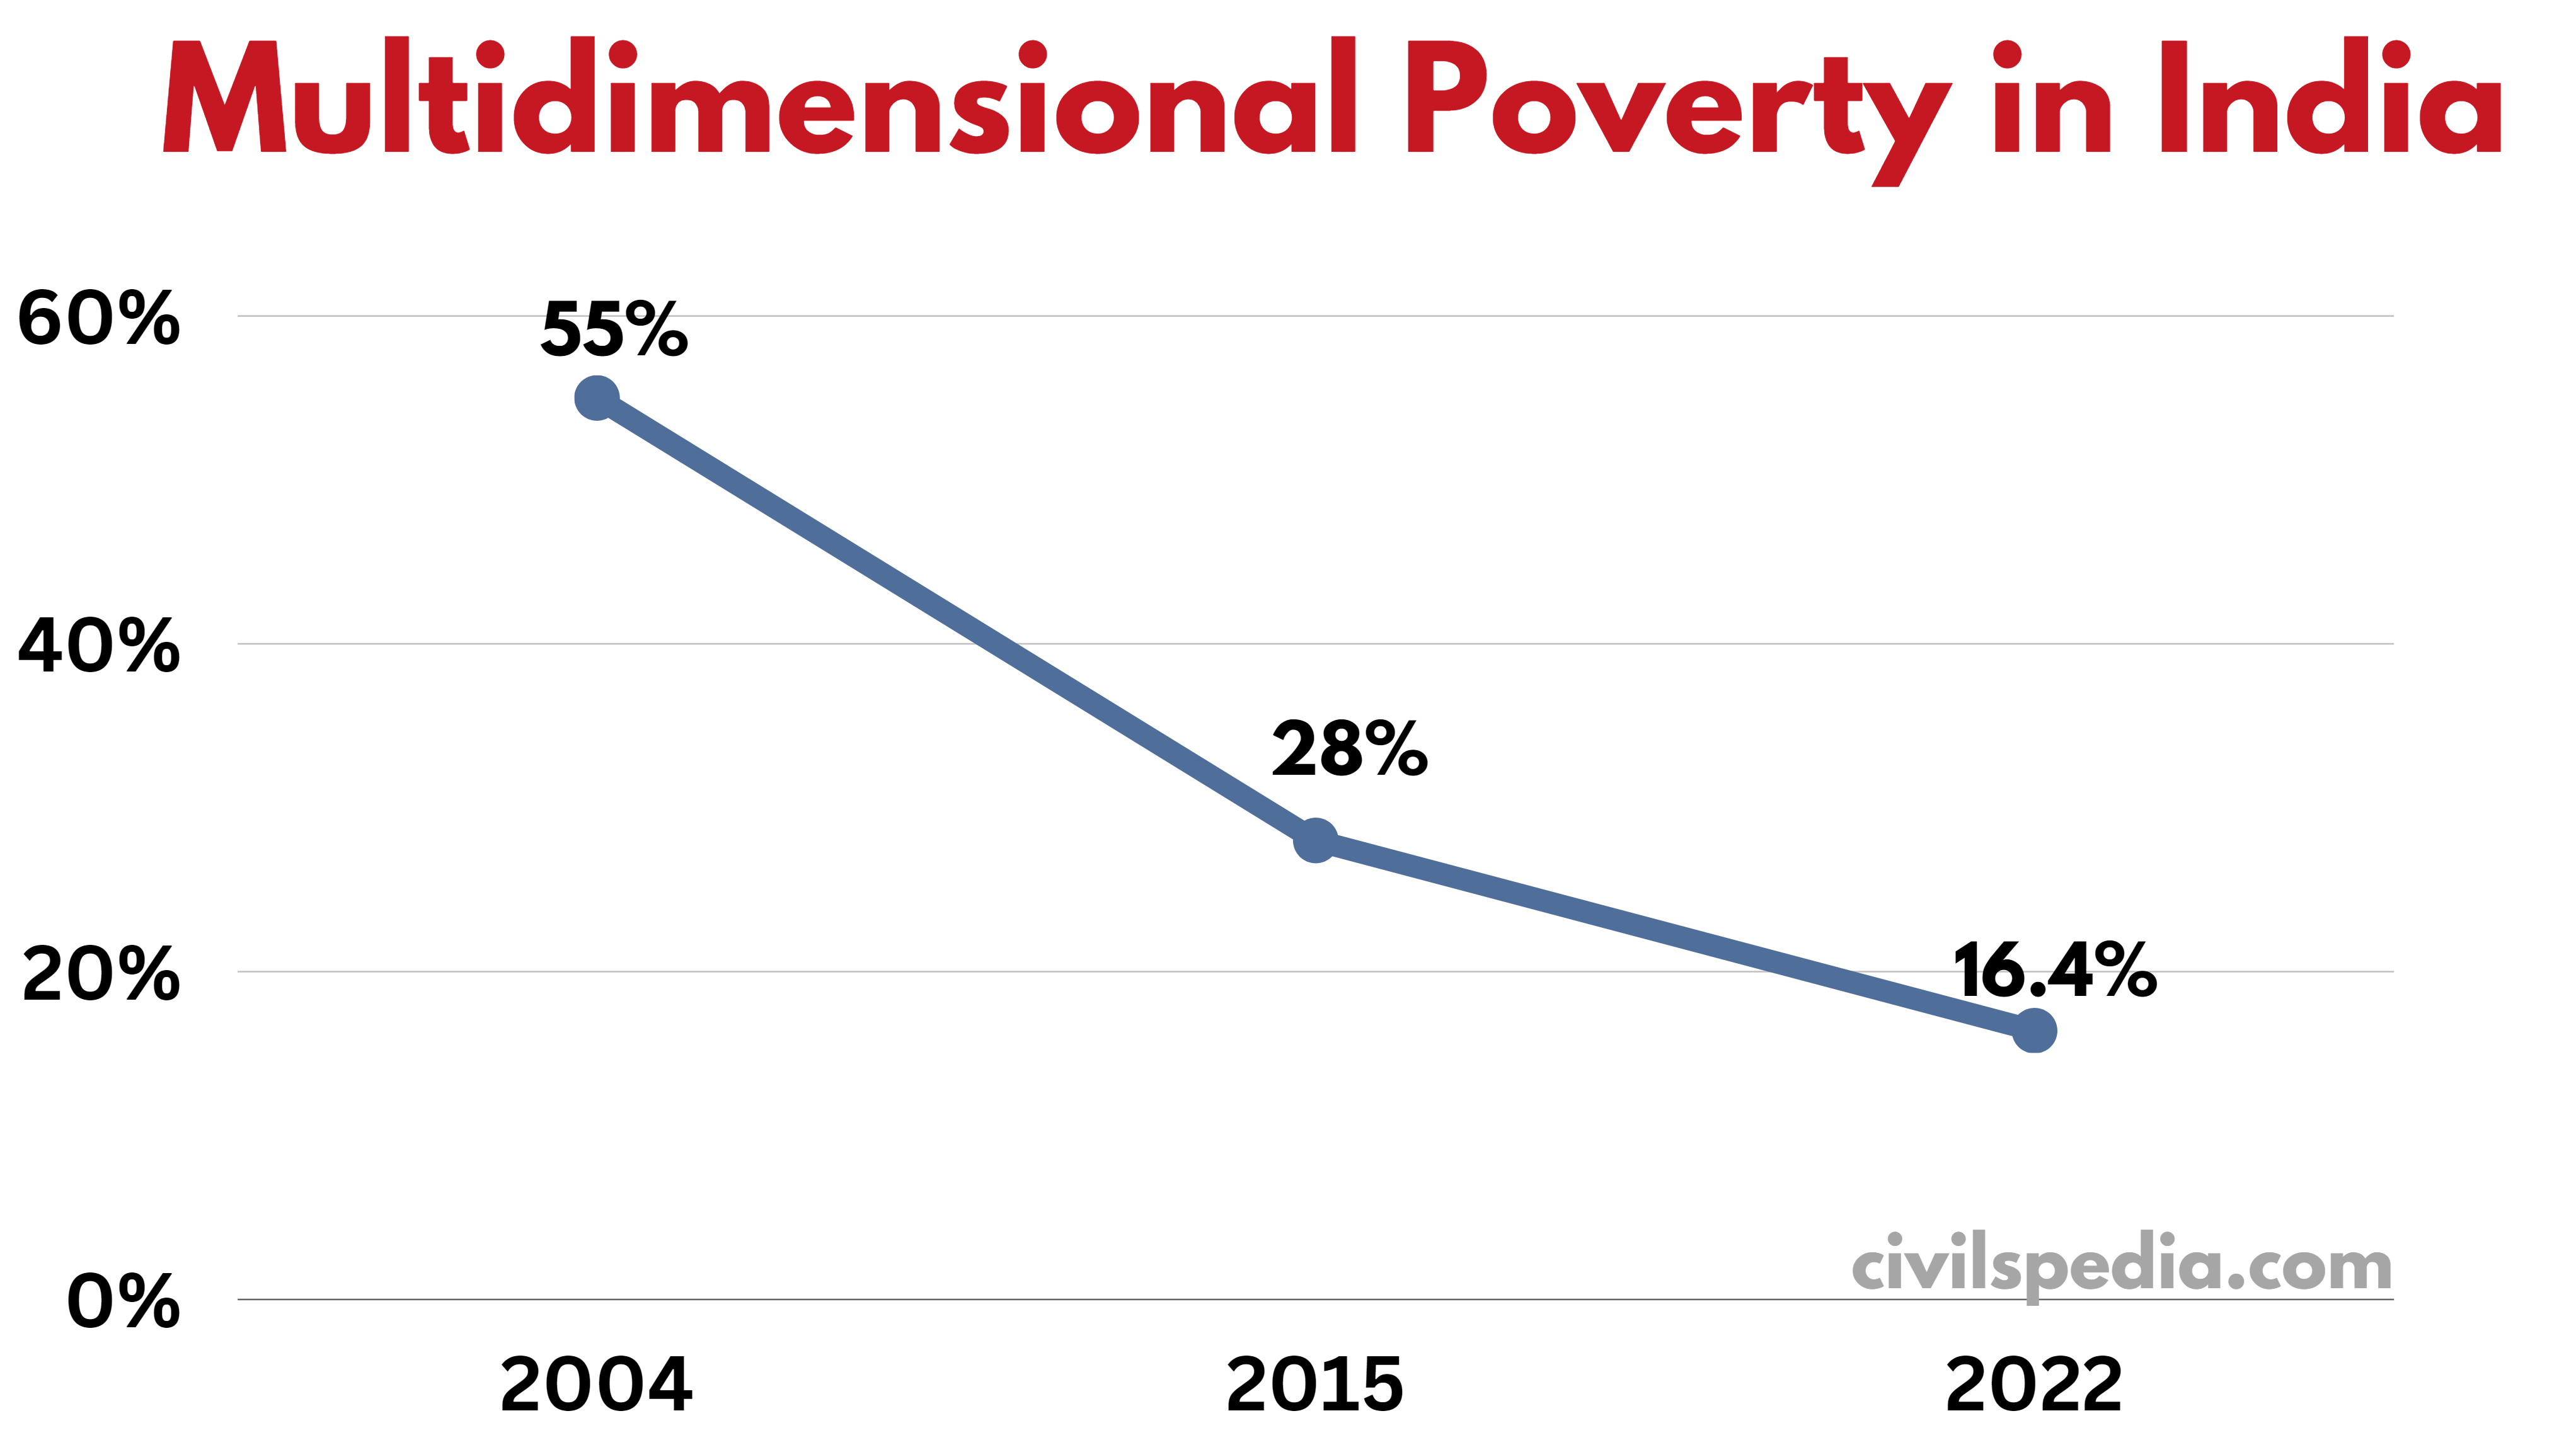
  • According to the 2022 Report, 16.4 per cent of the Indian population (22.8 crores) is Multidimensionally Poor
  • Additionally, Multidimensional Poverty is continuously decreasing in India.
Multidimensional Poverty  in India - Trend

Noise Pollution in India

Noise Pollution in India

Last Update: March 2023

This article deals with ‘Noise Pollution in India – UPSC.’ This is part of our series on ‘Environment’, an important pillar of the GS-3 syllabus. For more articles on Science and technology, you can click here.


Introduction

Noise Pollution in India
  • The unwanted and undesirable sound or sound that can disrupt one’s quality of life is called noise.
  • Noise pollution is the phrase used to describe when there is excessive “noise” in the environment.
  • World Health Organization has prescribed optimum noise level as 45 dB by day and 35 dB by night. Anything above 80 dB is hazardous.

Sources of Noise Pollution

Sources of Noise Pollution
  • Industrialization (industries use big machines)   
  • Poor Urban Planning: Congested houses and large families sharing small space
  • Social Events:  Such as marriage, parties, pubs or places of worship 
  • Vehicles: A large number of vehicles run and honk on roads
  • Construction Activities  
  • Household appliances like noise from the TV, Radio, Air Conditioner, cooking appliances etc. These might be minor contributors but affect the quality of life badly.

India suffers from high levels of Noise pollution. For example, World Health Organisation’s “Worldwide Hearing Index” reported that Delhi is the second-worst city with the highest noise pollution (Guangzhou in China is the worst and Zurich in Switzerland is the best). 


Effects of Prolonged Noise Pollution

  • Physical Effects: It leads to irreversible Noise-Induced Hearing Loss (NIHL), heart disease, high blood pressure, stress-related illness, sleep disruption and productivity loss. 
  • Physiological effects: 
    • Depression and fatigue 
    • Aggressive behaviour 
    • Straining of senses and annoyance 
    • Psychomotor impacts
  • Sleeping disorders: Loud noise can impact a person’s sleeping cycle. Due to this, a person’s performance may go down in the office.
  • Effect on Wildlife: Wildlife is dependent on sounds for their various functions, and animals may become easy prey.

Legal and Constitutional Provisions 

  • Article 48-A regarding protection and improvement of the environment) 
  • Article 51-A (fundamental duties) of the Constitution of India.
  • Air (Prevention and Control of Pollution) Act, 1981: The act includes noise in the definition of ‘air pollutant’.
  • Noise Pollution (Regulation & Control) Rules: Under the rules, permissible noise limits are as follows
    1. Industrial Areas: 75 decibels during the day and 70 decibels during the night
    2. Commercial Areas: 65 decibels during the day and 55 decibels during the night
    3. Residential Areas: 55 decibels during the day and 45 decibels during the night
  • The Central Pollution Control Board (CPCB) has set up the National Ambient Noise Monitoring Network (NANMN), covering 35 locations in seven metro cities like Delhi, Lucknow, Hyderabad, Kolkata, Mumbai, Chennai and Bangalore.
  • Article 48-A, i.e. protection and improvement of the environment
  • Article 51-A, i.e. fundamental duties of the Constitution of India
  • Central Pollution Control Board (CPCB) has established the National Ambient Noise Monitoring Network (NANMN), covering 35 locations in seven metro cities like Delhi, Lucknow, Hyderabad, Kolkata, Mumbai, Chennai and Bangalore.


Preventive measures

  • Personal Level: NIHL can be prevented by  
    • Dietary supplements rich in antioxidants  
    • Use of earplugs  
  • Scientific urban planning: Transport terminals, Industries, airports, and railway terminals sight should be far from living spaces.
  • Green Belt, i.e. planting trees in and around noise sources.
  • Lubricating the industrial machinery to reduce their noise levels
  • Making and implementing laws in effective ways to control noise pollution. E.g., regulations regarding loudspeakers are present but not applied strictly.

Types of Vegetations in India

Types of Vegetations in India

This article deals with ‘Types of Vegetations in India.’ This is part of our series on ‘Geography’, which is an important pillar of the GS-1 syllabus. For more articles, you can click here.


Introduction

  • Natural vegetation refers to a plant community unaffected by man, directly or indirectly.
  • Climate, soil and landform characteristics are the important environmental controls of natural vegetation.

1. Tropical Evergreen Forest

  • Tropical Evergreen Forests are found in areas with 
    1. 200 cm or more annual rainfall
    2. Annual temperature of more than 22°C 
    3. Rainfall is distributed throughout the year.
  • These forests never shed their leaves; therefore, they are called evergreen forests.
  • The temperatures in these regions are high enough to promote constant growth, and water is always sufficient. The only physical limitation for vegetation growth is light, which sets a competition between adjacent species for light. Due to this reason, Tropical evergreen forests are dense, vertically stratified and multi-layered
    • The tallest trees, to ensure maximum sunlight goes up to the height of 60 meters and have a branched canopy. They receive maximum sunlight. 
    • Vegetation layers closer to the ground consisting of shrubs and creepers receive very low sunlight due to darkness in this area.       
  • Vegetation in this region consists of 
    • Trees: Rosewood, Mahogany, Aini, Ebony, Ironwood, Cinchona (bark used to make quinine), and Cedar (all hardwoods). Their height is up to 60 meters, and their bark is up to 5 m thick.
    • Dense undergrowth: Bamboo, Fern, Canes & Climbers 
Types of Vegetations in India
  • Though this is a hardwood type of vegetation, due to high density, lack of pure strands and swampy ground conditions, it is not easy to exploit these forests. Also, due to the lack of transportation facilities, their full economic benefits have not yet been realised.
  • They are found in 
    1. Western Ghats in Maharashtra, Karnataka and Kerala
    2. Parts of Tamil Nadu and Andhra
    3. Andaman-Nicobar Islands
    4. Plain areas of West Bengal and Odisha
    5. North-Eastern states of Assam, Nagaland, Tripura, Mizoram, Manipur and Meghalaya 
Tropical Evergreen Forest (Areas in India)

2. Tropical Deciduous Forest

  • Tropical Deciduous Forests develop in areas with  
    1. 70 to 200 cm annual rainfall
    2. Annual temperature of about 27°C  
    3. But there is a distinct dry and wet season.
  • The characteristic feature of the Deciduous forest: This vegetation sheds its leaves due to stress during the long dry season, which occurs at the time of low sun and cool temperatures.
Tropical Deciduous Forest
  • Vegetation in this region consists of 
    1. Teak and Sal are the most important trees.
    2. Rosewood, Kusum, Pipal, Neem, Teak, Eucalyptus, Mahua, Amla, and Tendu are also found. 
  • They are found in regions having tropical monsoon climates i.e. 
    1. Great Plains: Punjab, Haryana, Uttar Pradesh, Bihar and West Bengal
    2. Central India: Jharkhand, Madhya Pradesh, Chhattisgarh, 
    3. South India: Maharashtra, Karnataka, Telangana, Andhra Pradesh and Tamil Nadu 
Tropical Deciduous Forest

3. Scrubs and Thorny Forests

  • Scrubs and thorny forests are found in areas with 
    1. Annual rainfall of less than 70 cm. 
    2. Annual temperature of about 27°C  
  • In such regions, Xerophytic vegetation is found, which has the following characteristic features to conserve moisture.  
    1. Long roots to extract moisture 
    2. Thick barks to store water
    3. Waxy leaves, thorns and small leaves to avoid evapotranspiration
  • Vegetation in this region consists of 
    • Trees: Kikar, Babul , Pipal, Palm, Khejri , Ber, Neem etc.
    • Xerophytes like Cactus
    • Grasses like Munj, Tussocky etc.
  • These forests are found in 
    1. West of Aravallis in Rajasthan
    2. South Punjab and South Haryana
    3. Gujarat
    4. Interior rain shadow areas of the Deccan Plateau
Scrubs and Thorny Forests


4. Mountain or Montane Forest

This type of vegetation is found in India in the Himalayas in the north and Nilgiri hills in the south. 


4.1 Himalayan Montane Forests

  • All type of vegetation available worldwide is found in the Himalayan region. The Himalayan mountains exhibit a succession of vegetation, ranging from tropical to tundra, with changes in altitude 
  • The natural vegetation found on hill slopes is affected by the difference in temperature and rainfall with increasing height. 

Upto 1000 m

  • Mixed trees of deciduous vegetation are found, like Sal and Teak.

1000 to 2500 m

  • There is a decrease in temperature and an increase in precipitation. Hence,  wet-temperate vegetation is found here, which consists of evergreen broad-leaf trees such as Deodar (highly durable wood used in construction),  Chinar and Walnut (in Kashmir and used in handicrafts) etc.

2500 to 4000 m

  • With an increase in temperature and a decrease in precipitation, this region contains Alpine vegetation and pastures. Pointed-leafed coniferous trees like pine, spruce, rhododendrons etc., are found here. 
  • Pastures of this region are used extensively by tribes like Gujjars, Bakarwals, Bhotiyas and the Gaddis.

Above 4000 m

  • These areas are above the snowline, and Tundra vegetation is found in this region, containing mosses, lichens, natural grasses and flowers. 
Himalayan Montane Forests

4.2 South Indian Montane Forests

  • These forests are found in three distinct regions of Peninsular India viz; the Vindhyas, the Western Ghats and the Nilgiri.
  • It is different from the Himalayas because 
    1. They are closer to the tropics
    2. Their height is only 3000 m above the sea level at max 

Two different types of vegetation are found in accordance with increasing height

Lower regions

  • Subtropical vegetation is found in this region

Higher regions

  • Temperate vegetation is found here.
  • In Nilgiris, Annamalai and Palani Hills, these Temperate forests are known as Sholas
  • Shola forest has a high degree of endemism, i.e. concentration of species that are not found anywhere else in the world. 
  • Shola forests on the higher reaches of the Western Ghats are like “patches of forests floating in a sea of grassland.”

5. Littoral and Swamp Forests

  • This vegetation is found in the deltaic areas of rivers like the Ganges, Brahmaputra, Krishna, Cauvery, Godavari and Mahanadi. 
Mangroves in India
  • Here, seawater at the time of tides keeps entering the deltaic areas. Due to this, the soil becomes marshy and saline, and normal vegetation can’t survive there. A special type of salt-tolerant plant called Mangroves is found here, which has adapted itself to survive in these conditions with features like 
    1. aerial roots (roots above ground for breathing)
    2. stilt roots (roots below water to hold tree against tides) and 
    3. vivipary (special technique of germination) 
  • The Sundari tree is also found in abundance. Therefore, the Ganga-Yamuna delta is known as the Sundarbans delta. Sundari tree provides valuable timber for making boats.
  • This type of vegetation is also called mangroves or Sundarbans vegetation.
Properties of Mangroves

Side Note: Importance of Mangroves

  • It provides Buffer Zone between the land and sea.
  • Mangroves protect coastal land from erosion. 
  • Mangroves serve as the natural defence against cyclones and other calamities that threaten the environment.
  • Many living species, including invertebrates, fish, amphibians, reptiles, birds, and even mammals like tigers, can be found in mangroves.
  • Huge volumes of carbon dioxide are removed from the atmosphere by mangrove forests, and their preservation can help to control and combat climate change.
  • Mangroves clean the air by absorbing pollutants in the air and cleanse the water by absorbing contaminants and dangerous heavy metals.
  • Mangroves are a potential source of recreation and tourism.

Side Note: Causes of degradation of Mangroves

1. Natural Causes

  • Cyclones, typhoons, and strong wave action damage mangroves
  • Attack of insect pests such as wood borers and caterpillars (which eat the mangrove foliage and damage the wood).

2. Human Causes

  • Human Encroachment: The increasing human population in coastal areas results in increased pressure on mangrove ecosystems in many countries, including India.
  • Oil spills and other accidents: As happened recently in Sundarbans

Mangrove Alliance for Climate (MAC)

  • It was launched at CoP-27 (Sharm El-Sheikh, Egypt (2022)).
  • The initiative is led by UAE and Indonesia. India is also one of its founding members.
  • It aims to raise awareness about the potential benefits of mangroves as a climate change solution and their role in reducing global warming.

Soils of India

Soils of India

This article deals with ‘Soils of India ’ This is part of our series on ‘Geography’ which is an important pillar of the GS-1 syllabus. For more articles, you can click here


Introduction

Indian Council of Agriculture Research (ICAR) divides the soils of India into the following eight major groups

Soils of India
Soils of India (percentage of different soils)

1. Alluvial Soil

  • 22.16% of the total area of India consists of Alluvial soil. 
  • Alluvial soil formation results from the deposition of soil carried downstream by rivers originating from the Himalayas and southern plateau
  • Their texture is sandy loam to clay.
  • Their colour varies from ash grey to light grey.
  • Their profile shows no marked differentiation
  • Chemical Composition
    1. These soils are rich in potash, phosphoric acid, lime and carbon compounds 
    2. But they are deficient in nitrogen and humus. (they need urea for cultivation)

They are of two types

Khadar Found in the floodplains of the rivers and contain fresh alluvial.  
They are rich in kankar or nodules of impure CaCO3.
Bhangar They are found well above flood plains and contain old alluvial
Khadar and Bhangar
  • They are found in 
    • Plains of Ganga-Indus river valleys of Punjab, Haryana, Uttar Pradesh, Delhi, Eastern Rajasthan, Bihar, West Bengal
    • Brahmaputra and Surma valleys of Assam
    • Mahanadi valley of Orissa
    • Narmada and Tapti valleys of Madhya Pradesh 
    • Deltaic areas of Godavari, Krishna and Cauvery in the South
  • Crops grown in it includes Rice, Wheat, Sugarcane and Oilseeds

2. Black Soil

  • 29.69% of the total area of India consists of black soil. 
  • They are also known as ‘Regur Soil’. 
  • Black soil has formed due to the disintegration of basalt volcanic rocks of the Deccan Traps
  • The black colour of these soils is due to the presence of iron and aluminium. 
  • Their texture is clayey
  • Chemical composition 
    1. They are rich in iron, potash, aluminium, lime and magnesium. 
    2. But they are deficient in nitrogen, phosphorus and organic matter.
  • They have two unique properties.
    1. Self-Ploughing Nature: It has high clay content & as a result, cracks are developed when it is dry & becomes sticky when wet. Cracks allow air to reach depth. Aeration, usually done by ploughing the field, happens naturally. 
    2. It has a high water retention ability. Hence, it is suitable for cotton cultivation. (Note: cotton grows in dry areas because a dry climate is required for boll formation, but roots need a good water supply, which is ensured by the high clay content of black soil) .
  • They are found in 
    1. Maharashtra and Malwa plateaus,
    2. Kathiawar peninsula
    3. Kaimur hills
    4. Telangana and Rayalaseema region of Andhra Pradesh 
    5. Northern part of Karnataka
  • Crops grown in it include Cotton (most important), Millet, Tobacco and Sugarcane.

3. Red Soil

  • 28% of the total area of India consists of Red soil. 
  • These soils have been formed by the disintegration of ancient crystalline and metamorphic rocks like granites and gneisses.  
  • The red colour of these soils is due to the presence of iron.
  • Their texture is sandier and less clayey.
  • Chemical composition 
    1. They are rich in iron, magnesium, aluminium and potash.
    2. But they are deficient in humus, nitrogen and phosphorous.
  • They practically encircle the entire black soil region of the Deccan plateau on all sides and are found in 
    1. Whole of Tamil-Nadu,
    2. Parts of Karnataka
    3. North-east Andhra Pradesh
    4. Orissa
    5. South Bihar,
    6. eastern Madhya Pradesh 
    7. North-eastern hilly states.
    8. Aravalli mountain regions of Rajasthan.
  • They are found in arid regions with low rainfall. But under irrigation, these soils provide good production with the application of ammonia, superphosphate, and compost fertilizers.
  • Since they are rich in magnesium, iron and aluminium, so can produce excellent crops like bajra, pulses, cotton, tobacco, jowar and fruits.

4. Laterite Soil

  • 2.62% of the total area of India consists of laterite soil. 
  • These are soils of warm wet tropical regions, where due to heavy rain (more than 200 cm), lime, silica and salts are leached away, and oxides of iron and aluminium are left behind.
  • The word laterite means brick type. It is named so because it hardens like Brick when dry. However, it is soft when it’s wet. 
  • They are red in colour due to the presence of Iron oxide.
  • Their texture is heavy loam and clay.
  • Chemical Composition 
    1. They are rich in Iron and Aluminium oxides and hence are acidic.
    2. But they are poor in nitrogen, lime, potash, phosphorus and organic matter. The Humus content of the soil is removed fast by bacteria that thrive well in high temperatures.
  • These are found on 
    1. Hills of Satpura and Vindhya 
    2. Eastern Ghats region of Orissa,
    3. Hills of Western Ghats of Karnataka
    4. South Maharashtra
    5. Malabar in Kerala 
    6. North & Eastern parts of the Shillong plateau in the northeastern states
  • It is not very suitable for agriculture because of its high iron content. But it is suitable for crops that need iron for growth, i.e. Tapioca, Cashew nuts, Coffee and Rubber.

5. Arid and Desert Soils

  • 6.13% of the total area of India consists of Arid and Desert Soils. 
  • They are also called Sierozem soils.
  • They are formed under arid & semi-arid conditions, high temperatures and accelerated evaporation when the soil becomes dry.
  • Their texture is sandy.
  • Chemical Composition 
    1. They contain a high proportion of salts
    2. But they are deficient in humus, nitrogen & moisture.
  • As a result of the “Kankar” layer formation in the bottom layers, water infiltration doesn’t happen. But in case water is made available by irrigation, the soil moisture is easily accessible to the plants their sustained plant growth
  • They are found in
    1. Rajasthan
    2. Northern Gujarat  
    3. Southern Punjab and Haryana (Desert soil reaches here from Rajasthan under the influence of sand storms, in the form of ‘Bhur’ soils)
  • With irrigation facilities, crops like bajra, jowar, cotton, wheat, sugarcane, and some vegetables can be grown.

6. Forest and Mountain Soils

  • 7.94% of the total area of India consists of Forest and Mountain soil. 
  • As the name suggests, this type of soil is found in the mountains. 
  • The thickness of the upper layer is very low on mountain slopes, although it can be up to 2 metres in valleys and gently sloping hillsides. These are less developed immature soils.
  • Their colour and character change with height.   
    1. Up to an elevation of 1800 metres: brown-coloured, acidic forest soils are found due to the decomposition of deciduous vegetation. 
    2. Between 1800 and 3000 metres: Low temperatures and poorly decomposed coniferous vegetation convert these soils into grey-brown podzolic soils. 
    3. Above 3000 mAlpine meadow soils occur above the timberline. These are shallow, dark in colour and sandy-loam or sandy-silica in texture. The organic matter is not decomposed in these soils due to a sharp fall in temperature.
  • These are found in 
    1. Lower and middle ranges of the Himalayas, especially in Assam, Ladakh, Lahaul –Spiti, Kinnaur, Darjeeling, Dehradun, Almora, Garhwal etc 
    2. Nilgiri hills in the south.
  • These soils can be used to grow Coffee, tea, maize, potato, fruits and various types of spices
  • Apart from that, forestry and lumbering activities are also done here. 

7. Saline and Alkaline Soils

  • 1.29% of the total area of India consists of Saline and Alkaline soil. 
  • They are also known as Usara soils.
  • These soils can be formed due to many reasons in
    • In the interior areas, saline soils originate due to bad drainage, over-irrigation or canal seepage. It causes water logging, and the capillary action transfers injurious salts from the subsurface to the topsoil.
    • In dry agricultural areas, relying on excessive irrigation. Such conditions promote capillary action resulting in the deposition of salts in the top layer.
    • In coastal areas, saline soils form due to Sea water intrusion. 
  • Their structure ranges from sandy to loamy. 
  • Chemical Composition
    1. They have excessive amounts of sodium, potassium & magnesium. It makes such soils infertile, and they can’t support vegetative growth.
    2. They lack nitrogen and calcium. 
  • They are found in
    • Deltas of the Eastern coast, Sundarbans of West Bengal and Western Gujarat due to seawater intrusions  
    • Areas of Green Revolution like Punjab (locally called Kallar or Thur), Haryana and Uttar Pradesh

8. Peaty and Marshy Soil

  • 2.17% of the total area of India consists of Peaty and Marshy soil. 
  • Such soils are found in areas with heavy rainfall, high humidity, and good vegetation growth. Hence, excessive dead organic matter is present in such areas, providing humus and organic content to the soil. Organic matter in such soils can range between 40 to 50 per cent.
  • This soil is heavy and black in colour. 
  • They are found in 
    1. Sundarbans Delta
    2. Coastal areas of Orissa
    3. South-Eastern coastal parts of Tamil Nadu
    4. Central Bihar 
    5. Almora district of Uttar Pradesh

Nagaland Issue

Nagaland Issue

This article deals with the ‘Nagaland Issue.’ This is part of our series on ‘Internal Security’, an important pillar of the GS-3 syllabus. For more articles, you can click here.


Nagas

Naga people are a conglomeration of several tribes inhabiting the North Eastern part of India (Nagaland, Assam, Manipur and Arunachal Pradesh) and north-western Burma. They belong to Indo-Mongoloid race. As of 2012, the state of Nagaland officially recognizes 17 Naga tribes. 

Prominent Naga tribes include Poumai, Sumi, AngamiAo, Chakhesang, Chang, Khiamniungan, Konyak, Liangmai, Lotha, Pochury, Rongmei, Zee and Mao. The language of the Nagas differs from each tribe and even from one village to another.


Greater Nagalim

Nagalim is the region carved out by integrating all Naga-inhabited contiguous areas under one administrative umbrella. It includes Nagaland along with several districts of Assam, Arunachal, Manipur and a large tract of Myanmar. The map of “Greater Nagalim” has about 1,20,000sq km, while the state of Nagaland consists of 16,527 sq km.

Nagaland Issue

Timeline in Naga Struggle

1826 Britishers annexed Assam.
1881 Naga hill became a part of British India.
1918 The root of the conflict can be traced back to 1918 in the formation of the ‘Naga Club’ by 20 members of the Naga French Labour Corp, who had served in World War I. The wartime knowledge motivated the few who had come in contact with the European battlefield to organize themselves as distinct ethnic political entity.  
1929 The club submitted a memorandum to the Simon Commission in 1929, stating that the people of Naga areas and of mainland India had nothing in common. Therefore, it would benefit both to stay separate and form their own political entity as and when the British left India.    
1946 The club was further reinforced with the formation of the Naga National Council (NNC) under A.Z Phizo, a charismatic leader of the Angami tribe.  
Phizo had been trained by the British, especially Major General Wingate, during World War II on the Burma Front against Japanese forces & he utilized knowledge to impart training in guerrilla warfare to NNC members.    
1947 – Nine-Point Agreement, known as the Akbar Hydari Agreement, was signed between NNC leaders and the Governor of Assam, Sir Akbar Hydari, on June 29 1947. The Agreement gave the Nagas rights over their land and executive and legislative powers but within the ambit of the Indian Constitution. 
Phizo rejected the Agreement. On August 14 1947, the NNC led by Phizo declared independence.   
1952 Naga Federal Government and Naga Federal Army formed, which were involved in violent clashes with the Indian state.   
1950s, 1960s and 1970s The 1950s, 1960s and 1970s were tumultuous in Naga history with the rise of militancy coupled with the state’s military response propelled by acts like the Armed Forces (Special Powers) Act 1958, amended in 1972.   
1963 The Union Government made efforts for peace, resulting in the grant of statehood to Nagaland in 1963 and the establishment of a peace mission in 1964.   
1975 The loss of bases in East Pakistan in 1972, with the emergence of a new nation-Bangladesh, as well as the constant pressure from Indian security forces, motivated the NNC under Z. Huire to sign  Shillong Accord, under which Nagas accepted the Indian Constitution.
The Shillong Accord, however, repeated the tragic story of the 9 Point Agreement as it split the Naga rebel movement. The Shillong Accord was the proximate cause for forming the original unified National Socialist Council of Nagaland (NSCN).   
1980 Some radical leaders rejected the accord and formed the Nationalist Social Council of Nagaland (NSCN).
1988 Due to intense differences with existing leadership, Isak Chisi Swu and Thuingaleng Muivah formed NSCN (Isak Muivah) or NSCN (IM) on January 31 1988.
It was followed by the further spilt of the S. S. Khaplang-led faction and the formation of the NSCN (Khaplang), named after its leader.    
1990s NSCN(IM) becomes the largest insurgent outfit in Nagaland, demanding Greater Nagalim.   
1997 NSCN(IM) signs ceasefire. This ceasefire has been in place till now.  
2001 NSCN (K) (Khaplang) signs ceasefire.  
2012 A new NSCN (Khole-Kitovi) group was formed as the NSCN (K) breakaway faction and is at war against the Indian state.   
2015 NSCN (K) also breaks ceasefire  
Aug 2015 Naga Peace Accord was signed with NSCN (IM). No details are out yet, but NSCN (IM) ‘s demands include
1. Recognition of unique Naga History
2. Creation of Greater Nagalim consisting of all the Naga inhabiting areas in India
3. Recognition of a separate flag for the Naga areas

According to the statement given by the Governor to Parliamentary Committee on Home Affairs, the Peace Accord has accepted the demand for recognition of unique Naga history. But there is no provision regarding touching the boundaries of Indian states. Instead, a special arrangement will be made for Nagas residing outside the state of Nagaland.

Main Insurgent Groups

1. NSCN (Isak-Muivah) or NSCN (IM)

  • It was formed in 1988 by Isak Chisi Swu and Thuingaleng Muivah.
  • It is the most important faction of NSCN. 
  • Aim: To establish a greater Nagaland based on the Maoist ideology of the principle of socialism and equitable economic development for the people.
  • Its major source of funding is drug trafficking and financial support from ISI. Apart from that, they run a parallel government in their area of influence and levy a sort of tax on the businesses. 
  • A ceasefire agreement has been signed between NSCN (IM) and the Government of India since 1997. It was also involved in a peace dialogue with the Indian government, culminating in the Naga Peace Accord of August 2015. 
  • But NSCN (IM), which views itself as the sole representative of the Naga people in peace dialogue, is being increasingly threatened on its home turf by the NSCN (Khole and Kitovi) faction.  
    • While NSCN (Khaplang) is a significant threat to the NSCN (IM) as a rival armed actor, its influence in terms of social legitimacy in Naga-inhabited areas in India has been limited at best since its Chairman Khaplang belongs to Myanmar. 
    • The Khole-Kitovi faction is a real challenge to the NSCN (IM) ‘s sphere of influence, given that both leaders are from Nagaland. 

2. NSCN (Khaplang) or NSCN (K)

  • It is the second most important faction. 
  • It is based in Myanmar and is very active in Indian Naga-inhabited regions.
  • Although a ceasefire was signed between NSCN (K) and the Indian government in 2001, NSCN(K) unilaterally broke the ceasefire in 2015 and carried out an attack on Indian forces, killing 20 soldiers. 
  • They have kept away from talks with the Indian government.