This article deals with ‘Human Development Report’ This is part of our series on ‘Economics’ and ‘Society’. For more articles , you can click here .
Introduction
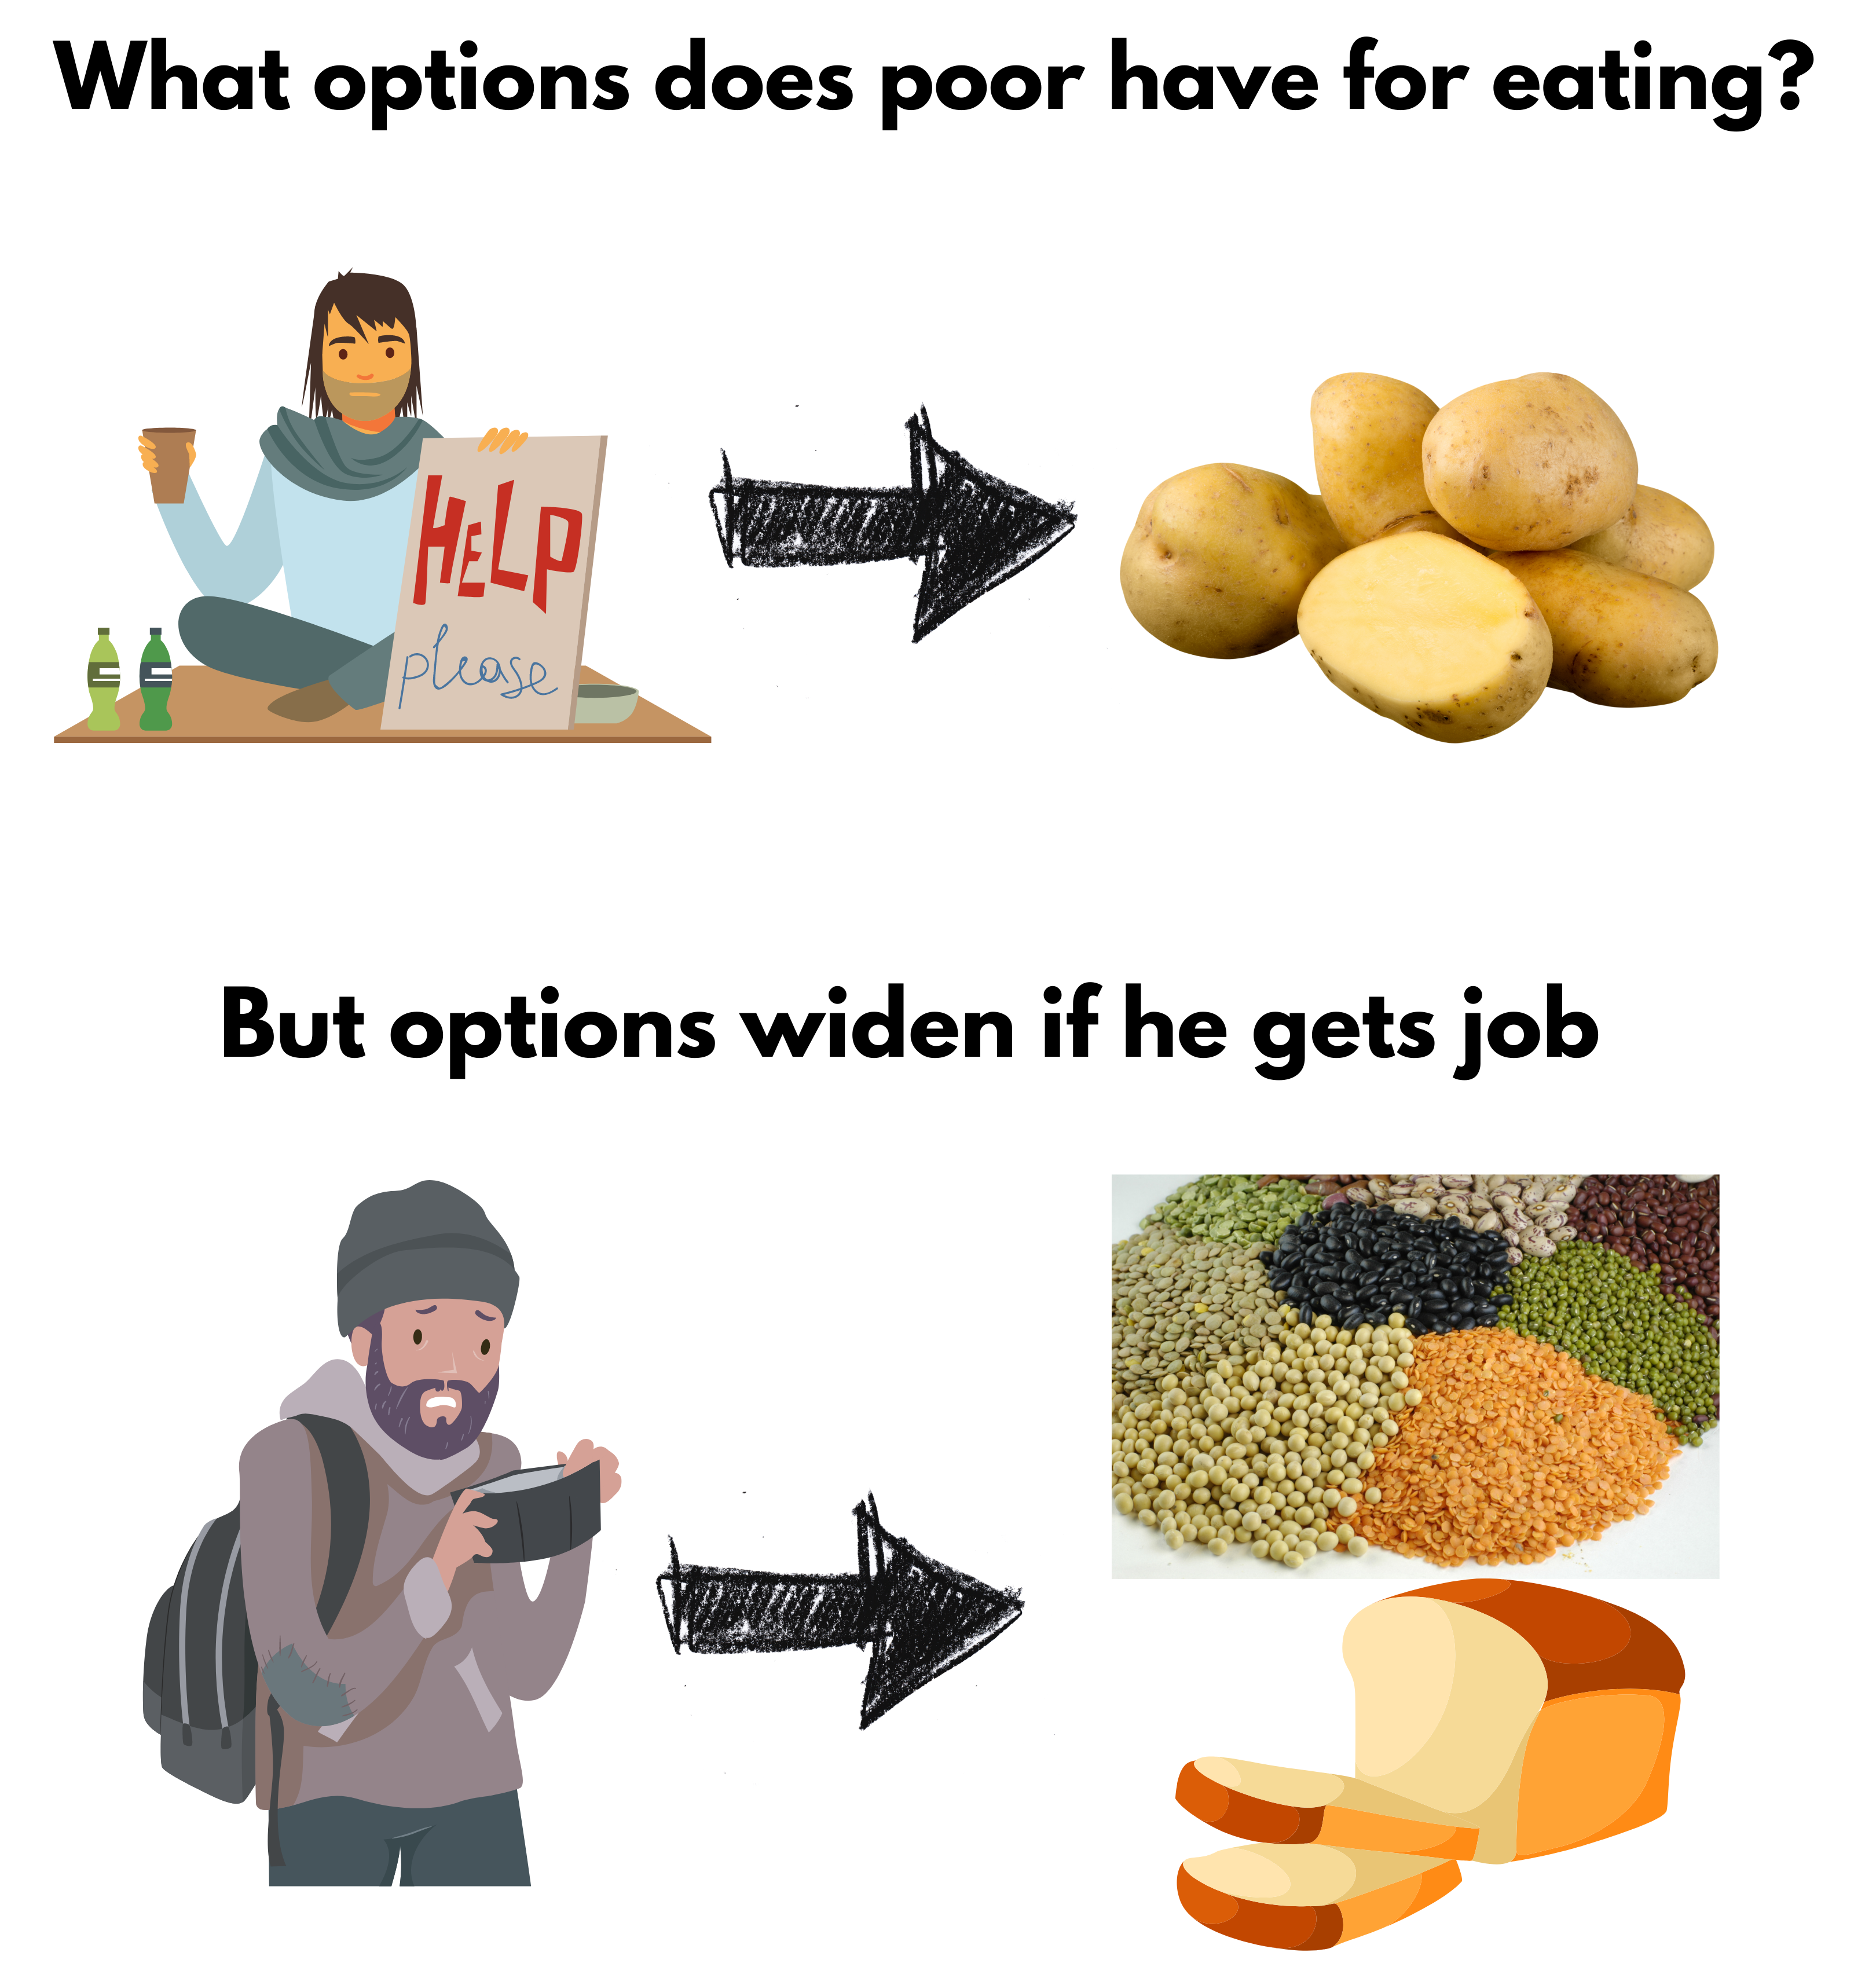
UNDP defines Human Development as the process of widening people’s choices and raising the level of well-being.
For instance, look at
the following example.
Human Development is
the critical enabler for upward social mobility.
Human Development Report
It is prepared by the United Nations Development Program (UNDP) which provides a comprehensive analysis of human development across countries.
In 1990, Mahbub-ul-Haq of Pakistan and Amartya Sen of India gave the concept of HDI.
In various reports, it has been found that the Human Development of everyone is not taking place.
The human development of males is 20 points greater than females in South Asia.
Everywhere, the Human Development of elites and religious majorities is more than others.
Due to Climate Change, the Human Development of the present generation is more than what can be achieved by future generations.
In Human Development Report, there are 5 Indexes.
Human Development Index (HDI)
HDI – Inequality Adjusted
Gender Development Index(GDI)
Gender Inequality Index
Multi-dimensional Poverty Index (MPI)
The
latest report for 2021/22 was released in 2022
1. Human Development Index (HDI)
It was developed by United Nations Development Program (UNDP) in 1990 by a team headed by Prof. Mahbub ul Haq. Prof Amartya Sen was also a prominent member of this.
Dimensions of HDI
Dimension
Indicator
Health
Life Expectancy at Birth
Knowledge
– Mean Years of Schooling – Expected Years of Schooling
Standard of Living
GNI per capita
Switzerland topped the ranking in the latest report (2021/2022). India was ranked 132.
Indian Ranking
Indian Ranking
HDI Score
1990
0.429
–
–
–
2015
130
0.624
2016
131
0.624
2017
130
0.643
2018
129
0.647
2019
131
0.645
2021/22
132
0.633
Based
on a report by the United Nations Development Program (UNDP), approximately 90%
of nations have witnessed a decline in their Human Development Index (HDI)
value during either 2020 or 2021. It signifies that global human development
has come to a halt for the first time in 32 years.
2. Inequality-adjusted Human Development Index (IHDI)
Human Development Index is Geometric Mean. Hence HDI masks internal inequalities.
UNDP releases another Index which also accounts for inequalities.
HDI (Inequality adjusted) = HDI -(minus) HDI (lost due to Inequality), i.e. Human Development which is lost because of inequalities present in the country wrt gender is adjusted in this.
IHDI (2022) Ranking
Rank
Country
HDI Score
HDI-Inequality
Adjusted Score
1
Iceland
0.959
0.915
2
Norway
0.961
0.908
——
—–
108
India
0.633
0.475
When there is perfect equality, the HDI and the Inequality Adjusted HDI (IHDI) are equal. However, as the difference between the two increases, it indicates greater levels of inequality within the country.
Note: SDG Goal 10 calls for ‘reducing the Inequalities.’
3. Gender Development Index
The Gender Development Index (GDI) is a separate measurement released by the UNDP to complement the Human Development Index (HDI) to address females’ development specifically.
While the HDI does not provide specific information on female development, the GDI calculates the ratio of Female HDI to Male HDI.
GDI = Female HDI/ Male HDI.
If the Development Index for females exceeds that of males, the GDI can be greater than 1.
4. Gender Inequality Index
The Gender Inequality Index (GII) has been calculated since 2010.
Despite improvements in life expectancy and access to education for women, they still face specific forms of inequality, such as early pregnancies, lack of representation, and limited participation in economic activities. Therefore, the United Nations Development Programme (UNDP) introduced a specialized index to examine gender inequality.
Dimensions of Gender Inequality Index
Dimension
Indicator
Reproductive Health
– Maternal Mortality Rate – Adolescent Birth Rate
Empowerment
– Parliament Seats occupied by Women – Higher Education Attainment Levels
Economic Activity
– Female Labour Force Participation
The calculations used for the Gender Inequality Index (GII) are represented on a scale of 0 to 1, with 0 indicating no inequality (i.e., women fare equally to men) and 1 representing complete inequality (i.e., significant disparities between women and men).
GII (2022) Ranking
India is Ranked = 122 (Score: 0.490)
This score is better than that of the South Asian region (value: 0.508) and close to the world average of 0.465. This reflects the Government’s initiatives and investments towards more inclusive growth, social protection, and gender-responsive development policies.
5. Multidimensional Poverty
In India, we calculate poverty
using Tendulkar Method based on household consumption.
But UNDP takes a
holistic view of poverty and measures it differently.
The report has been released
since 2010.
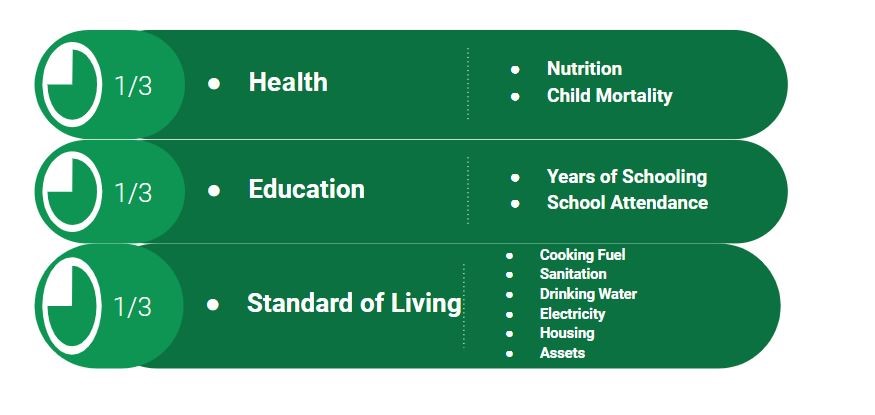
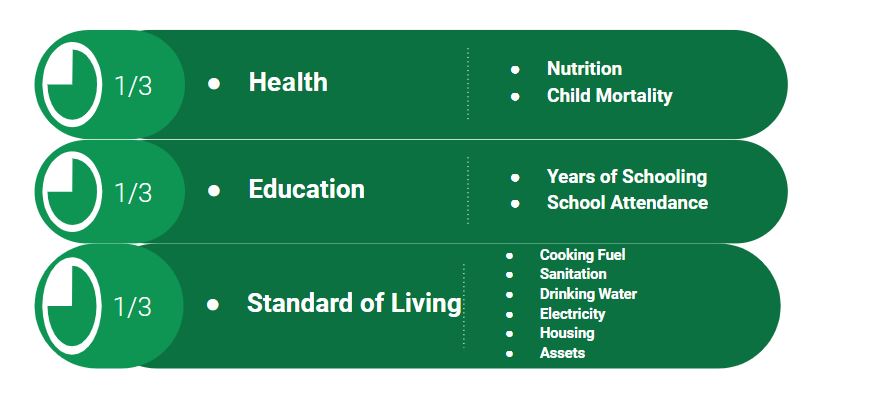
In
Multidimensional Poverty, they look into the following components to
measure poverty (HES)
Health with components like
child mortality
Education with components like
years of schooling
Standard of Living with
components like electricity, water etc.
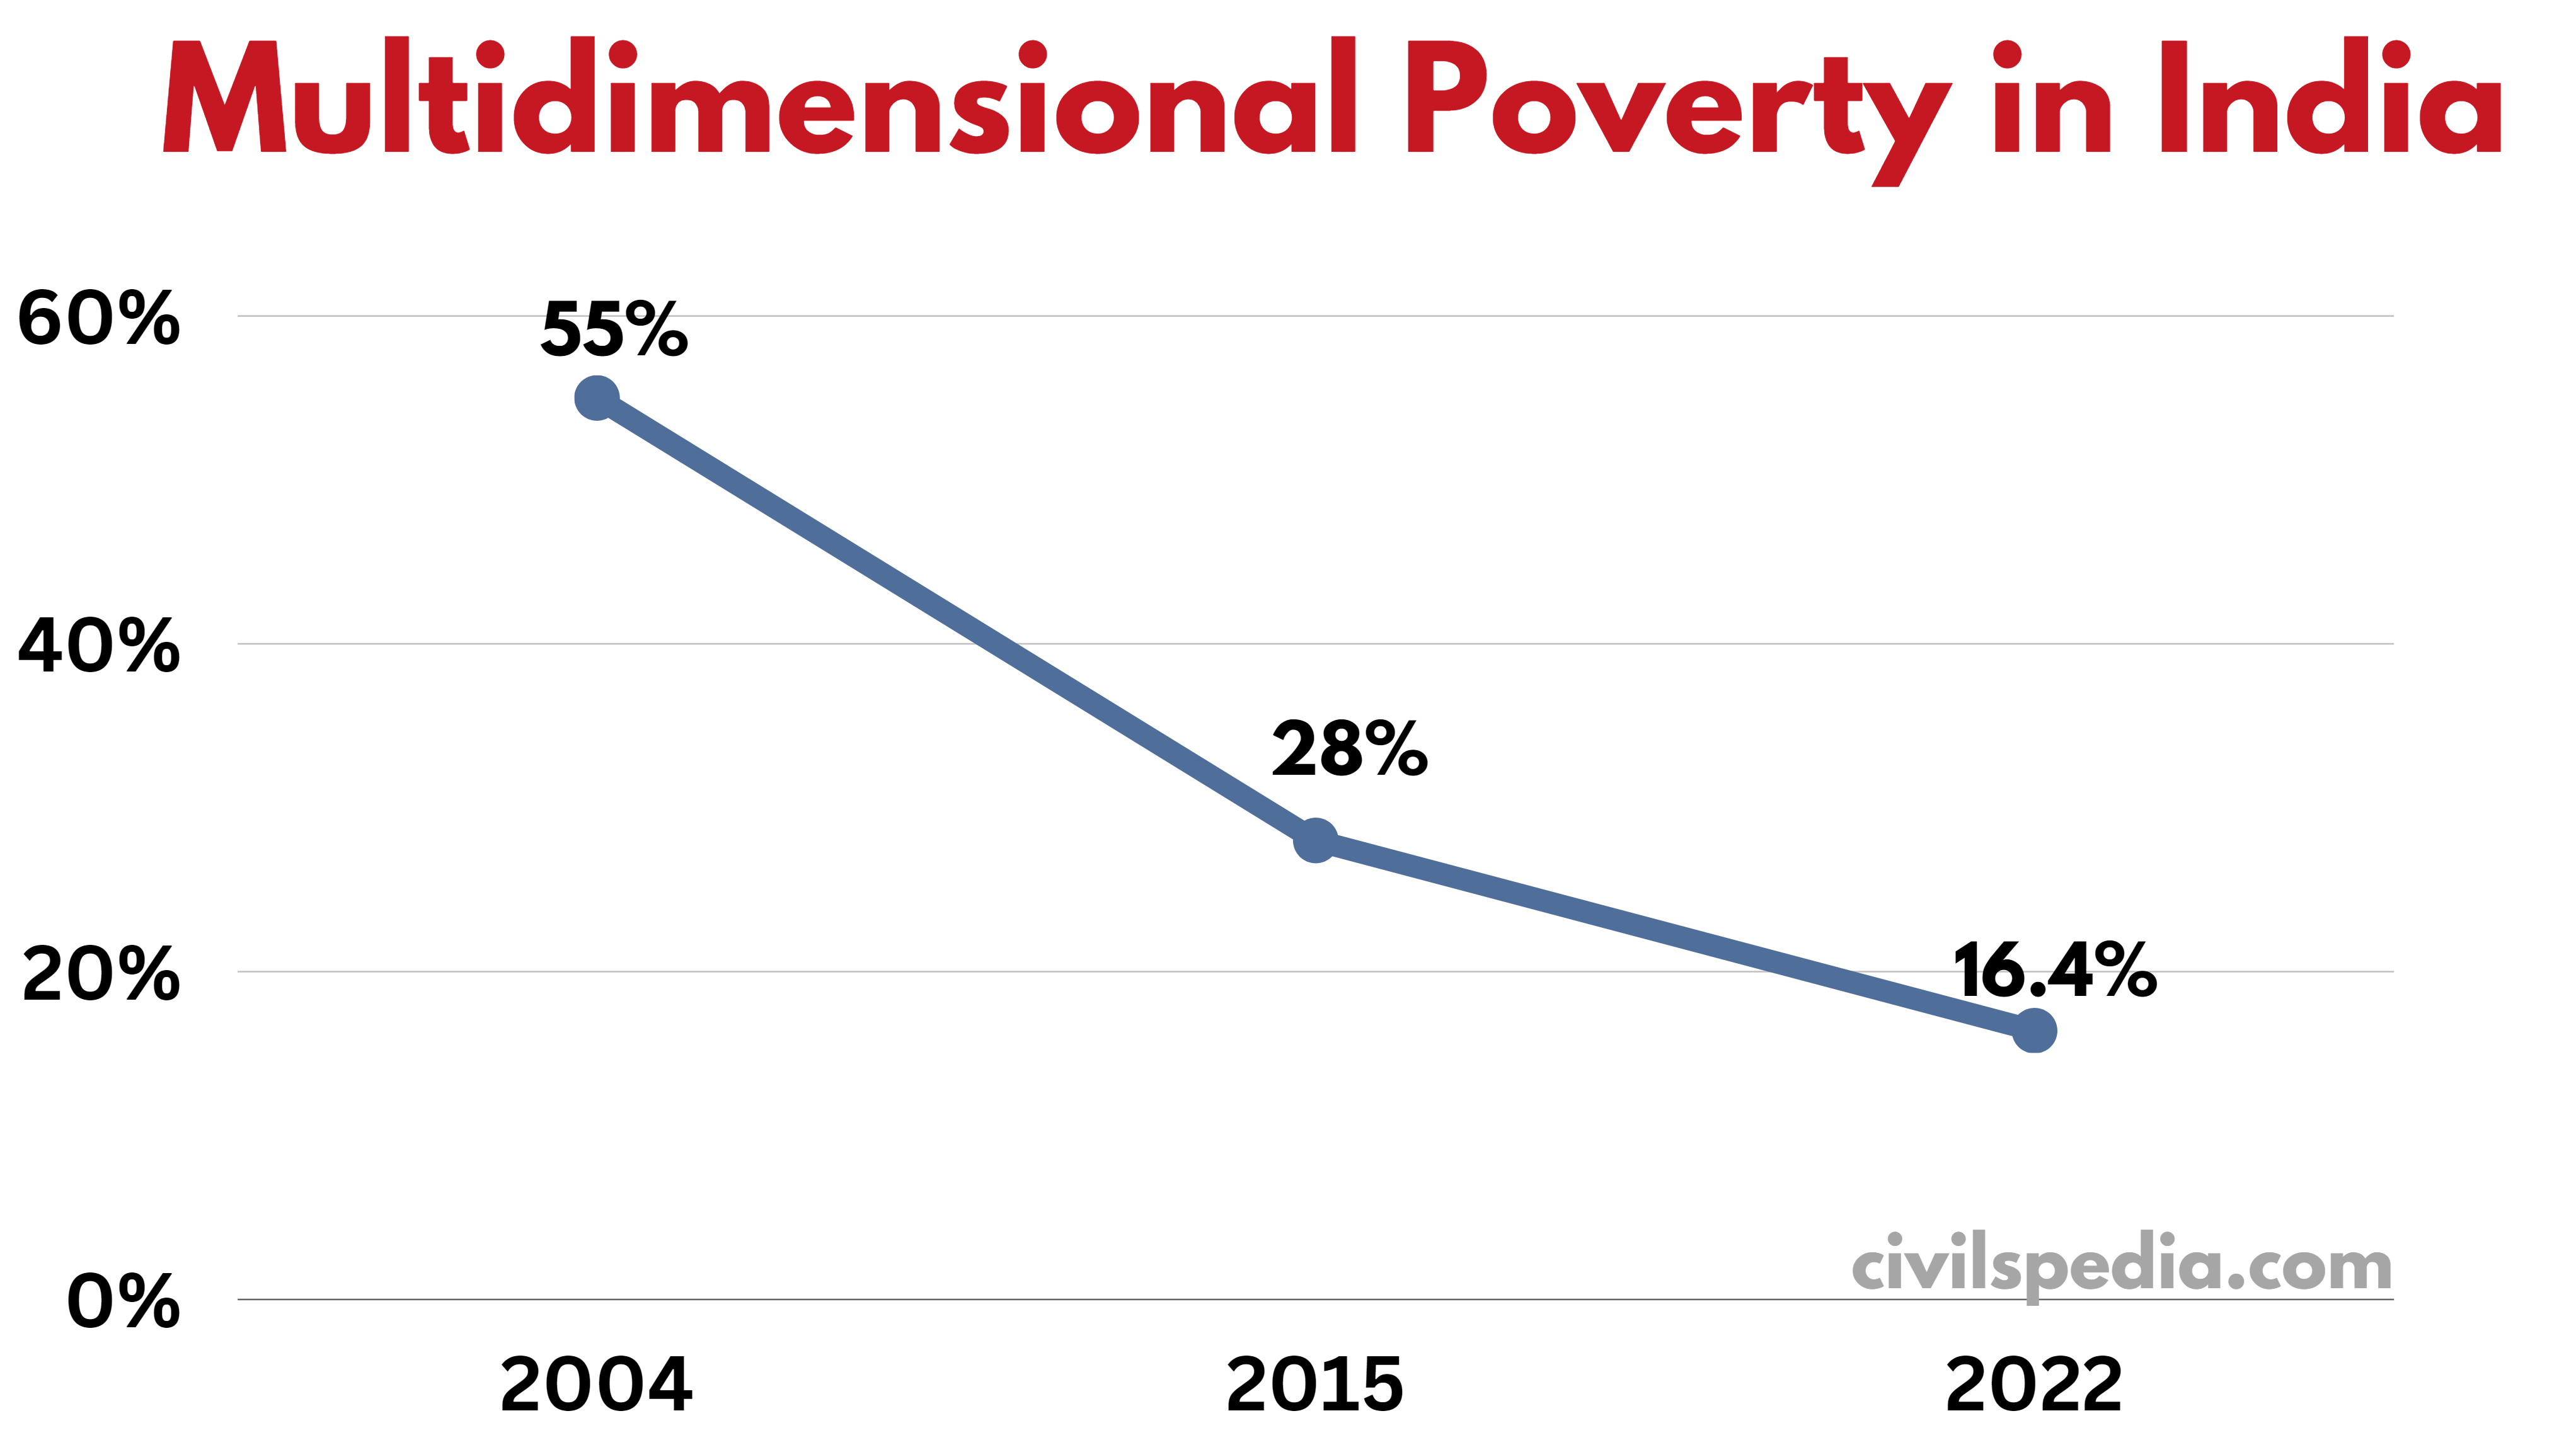
According to the 2022 Report, 16.4 per cent of the Indian population (22.8 crores) is Multidimensionally Poor
Additionally, Multidimensional Poverty is continuously decreasing in India.
This article deals with the‘Issue of Poverty.’ This is part of our series on ‘Governance’ and ‘Economics’ series, which is an important pillar of the GS-2 and GS-3 syllabus respectively. For more articles, you canclick here.
Introduction
What is Poverty?
Poverty is a social concept which results due to unequal distribution of benefits of socio-economic progress.
How does it manifest itself?
Poverty manifests itself in the following ways
Hunger & Malnutrition
Lack of access to education and health care
Social Discrimination
Lack of participation in decision making
World Bank definition
World Bank
defines extreme and moderate poverty in the following way
Extreme poverty
Living on less than $ 1.25 per day.
Moderate poverty
Living on less than $ 2 per day.
Note – Poverty is measured in Purchasing Power Parity(PPP) exchange rate & not absolute exchange rate.
A recent World Bank Report has shown that extreme poverty in India more than halved between 2011 and 2019 – from 22.5 per cent to 10.2 percent.
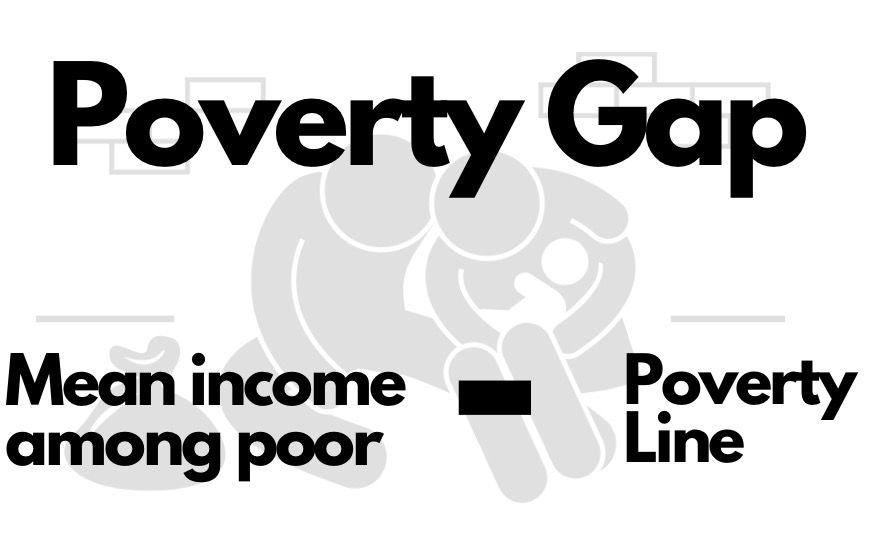
Poverty Gap
It measures the Depth of poverty
It is also called Foster-Greer-Thorbecke (FGT) Index.
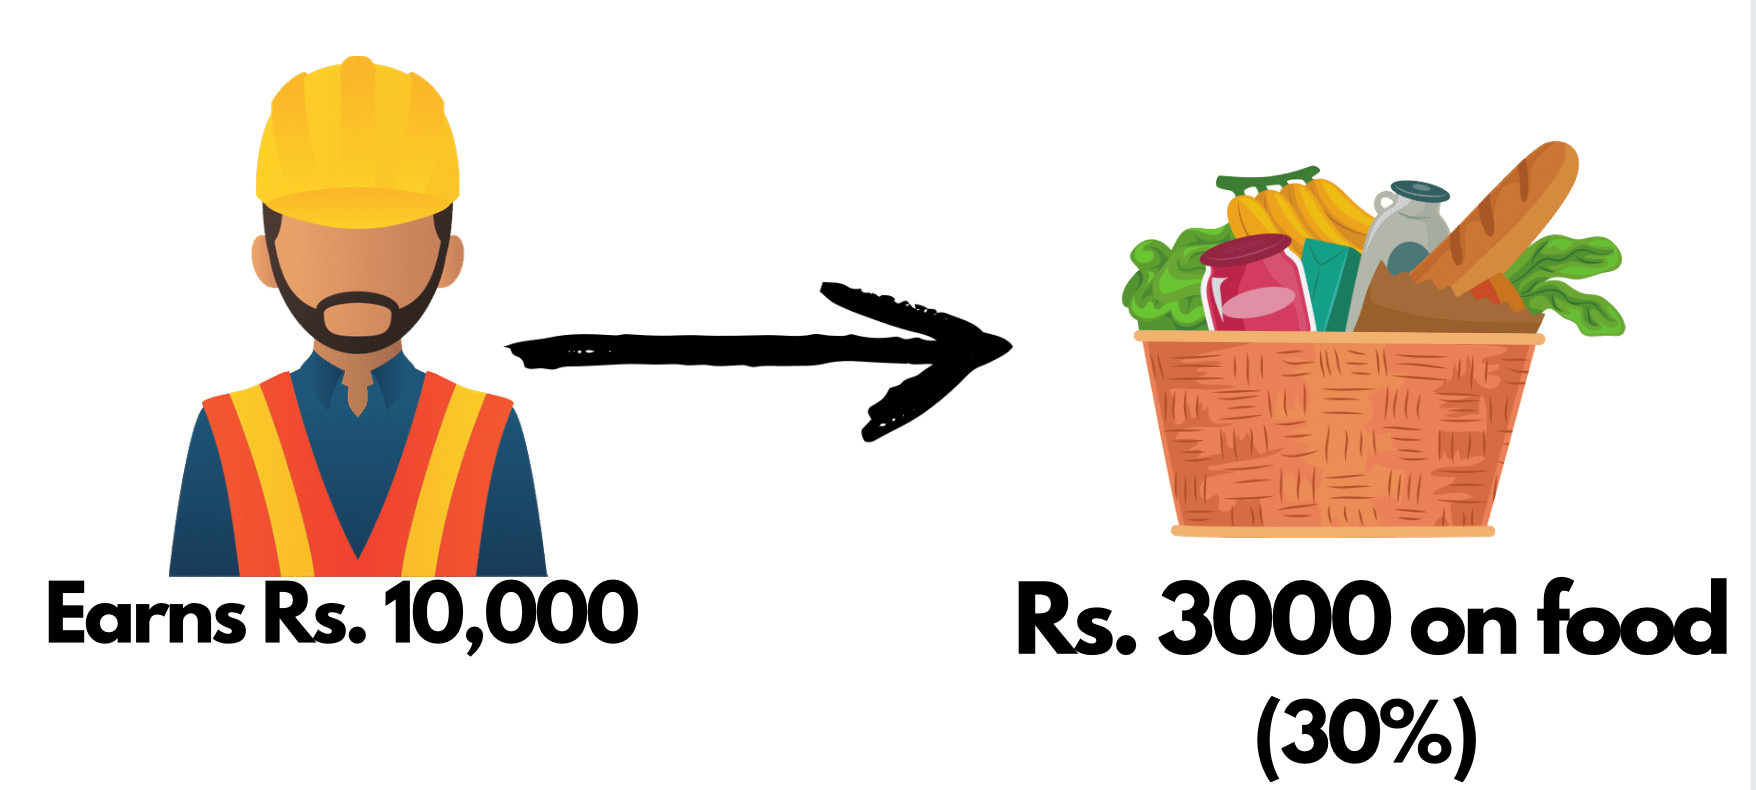
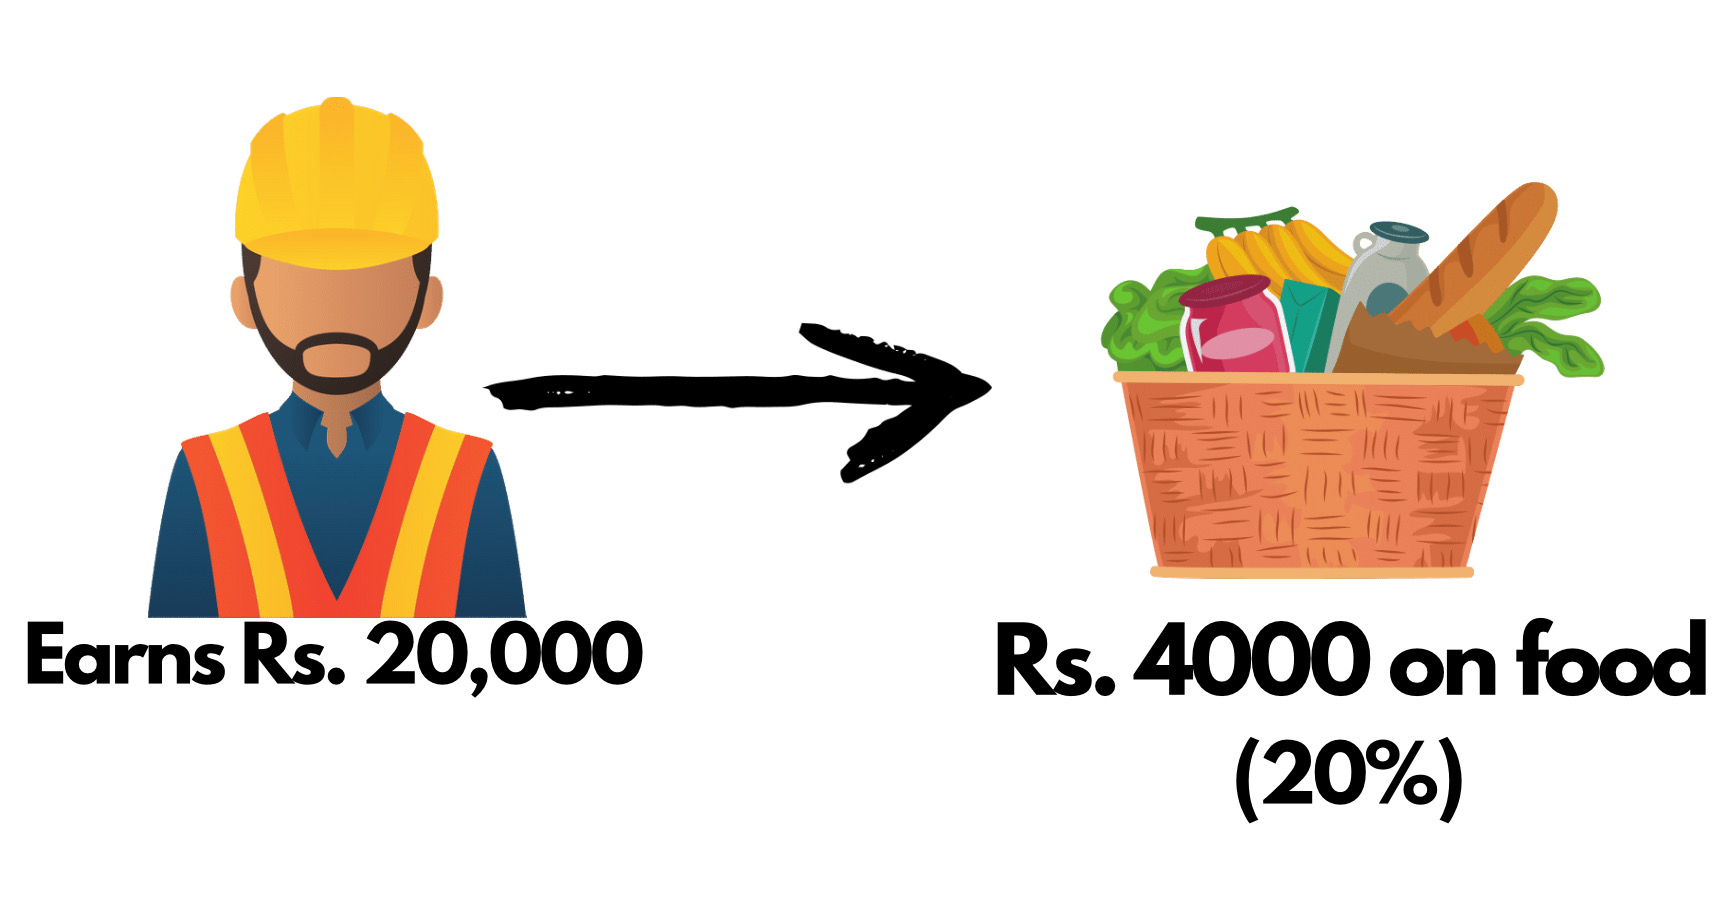
Engel’s Law
Engel Law states that when incomes rises, percentage of overall
income spent on food items decreases. This is known as ENGEL’S LAW.
SDG & Poverty
Sustainable Development Goals gives utmost importance to poverty. The First SDG talks about ending poverty in all its forms everywhere by 2030.
India is home to 26% of the global extreme poor. Hence, the Indian role in achieving that goal is most important.
Causes of Poverty
Economic Reason
Growth Model not conducive to poverty alleviation: India chose a capital-intensive model in a labour-intensive country, which was a great fault.
Widespread reliance on agriculture (42% population is dependent on sector contributing 17% to the GDP)
Lack of formal institutional credit pushes a large number of Indians into poverty every year.
MATTHEW EFFECT: The phenomenon, widely spread across advanced welfare states that the middle class tends to be the primary beneficiary of social benefits & services targeted to the poor (India is trying to rectify this using Targeted Delivery of Subsidy with the help of Jan Dhan-Aadhar-Mobile).
Demographic Factors
Rapid Population growth in India is also the primary cause of poverty as enough resources were not available for all.
Social Cause
Caste system: The subordination of low caste people by the high caste people caused poverty of the former.
Joint family system: Joint Family System, followed by many families in India, provides social security to its members. As a result, some people take undue advantage of it and live upon the income of others. They become idlers. Their routine of life consists in eating, sleeping and begetting children.
Social Customs: Ruralites spend a large percentage of annual earnings on social ceremonies like marriage, death feasts etc., which force them to take debt and remain trapped in poverty.
Climatic Factors
Drought, Floods, Cyclones etc. perpetuate poverty.
Historical Factors
Historical reasons such as colonialism & imperialism led to the exploitation of Indian people. India’s wealth was drained to metropole Britain for two centuries.
Institutional Factors
Withdrawal of Government from Social Security, especially after LPG Reforms.
Anti-poverty schemes are not successfully implemented due to institutional inadequacies.
Poverty Line
What is Poverty Line?
The poverty line is the threshold income and households earning below this threshold are considered poor.
Different countries define the poverty line in different ways depending on local socio-economic needs.
Different approaches to define the poverty line
There are two approaches regarding this
Nutritional Approach: It is based on specific minimum criteria of nutrition intake
Relative Deprivation Approach: It doesn’t take into account just nutritional deficits, but in comparison to the progressive section, the person is not that progressed. E.g., a person earning less than 60% of the country’s per capita income
Developing countries generally follow the nutritional Approach. But
now the time has come that India should move from the Nutritional Approach to
the Relative Deprivation Approach to ensure sustainable and equitable
development.
Poverty line in India is decided by
Earlier it was used to be determined by erstwhile Planning Commission
Now NITI Aayog determines the Poverty Line. NITI Aayog made the Commission under Arvind Panagariya recommend Poverty Line in India.
Panagariya has suggested that
Tendulkar Committee’s report should be accepted for poverty line estimation.
But socio-economic indicators, say, as collected by Socio-Economic Caste Census, should be used to determine entitlement for benefits.
Various Committees constituted for Poverty Line Determination
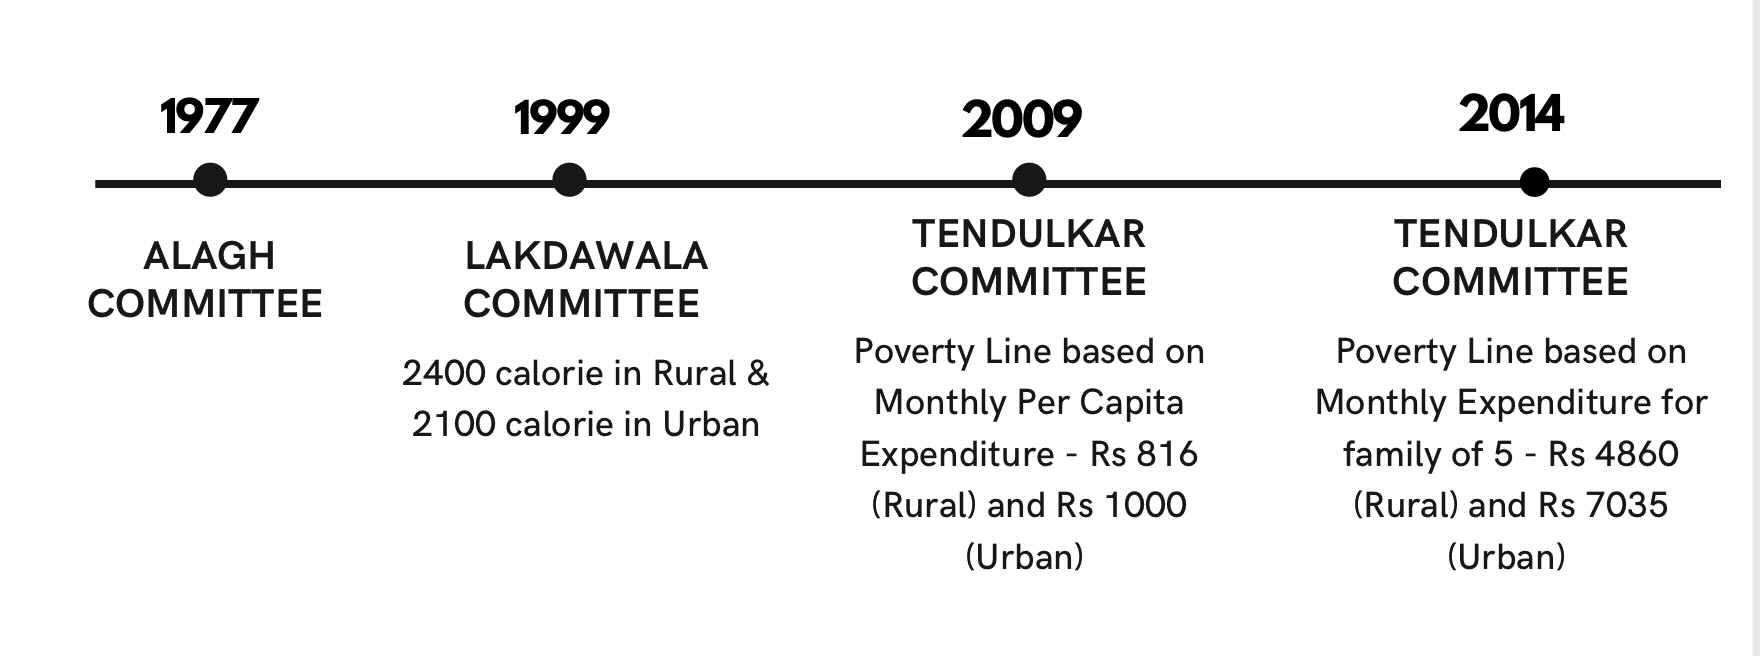
1. Lakdawala Committee
In books, we frequently come across the Poverty Line defined as 2400 calories in Rural & 2100 calories in Urban. This definition of the Poverty Line was based on the recommendations of the Lakdawala Committee (1999).
2. Tendulkar Committee
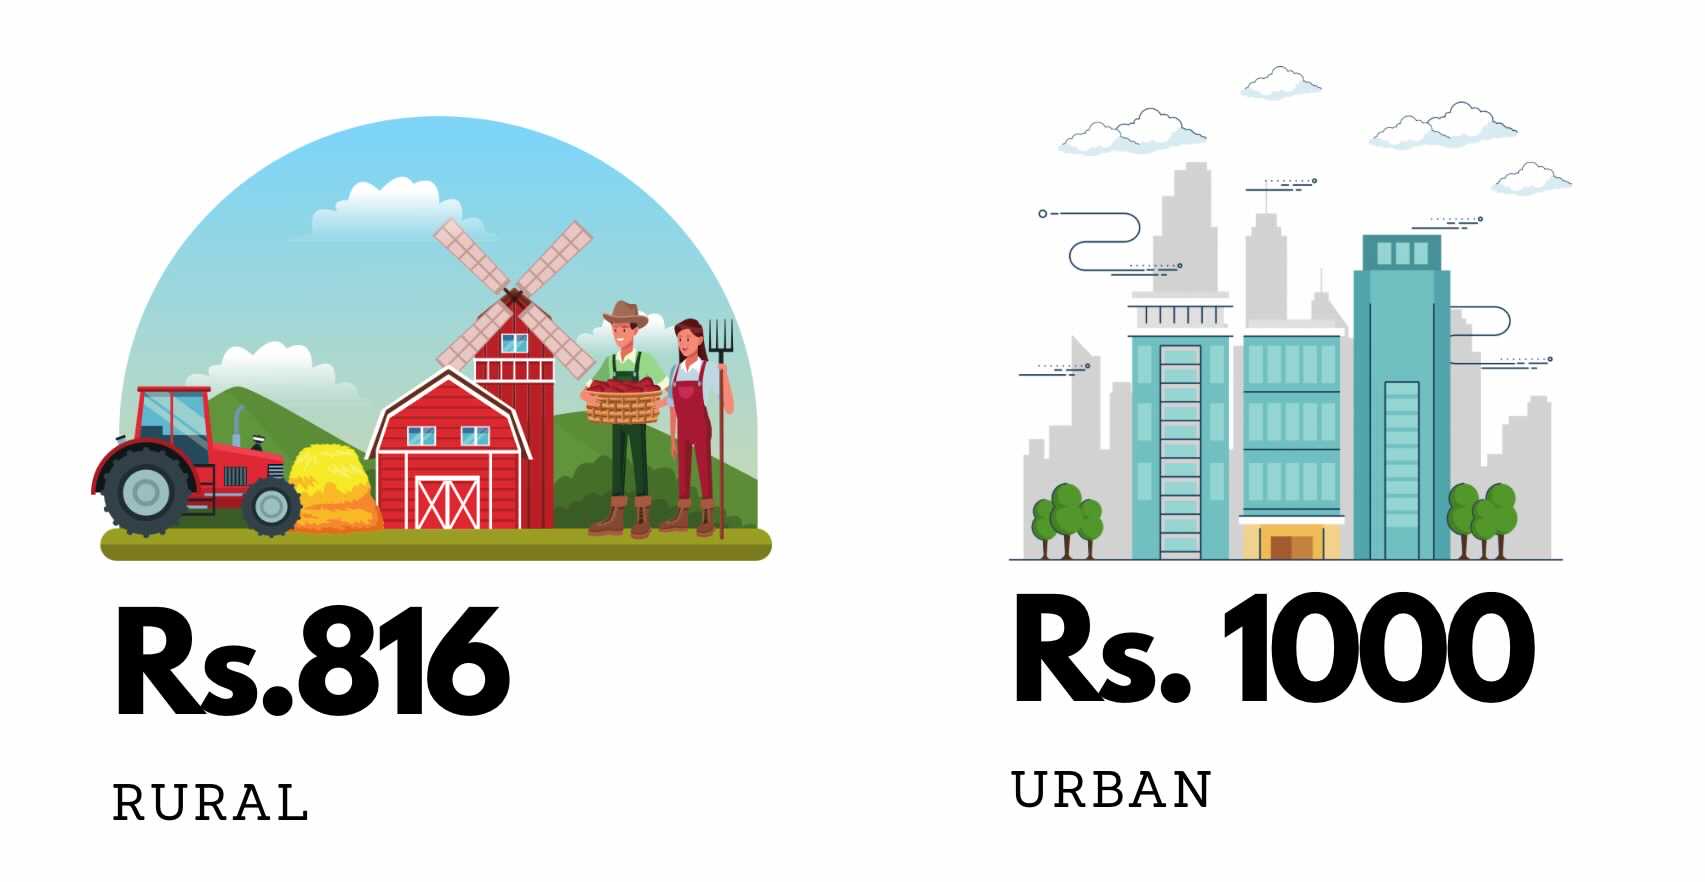
Tendulkar Committee
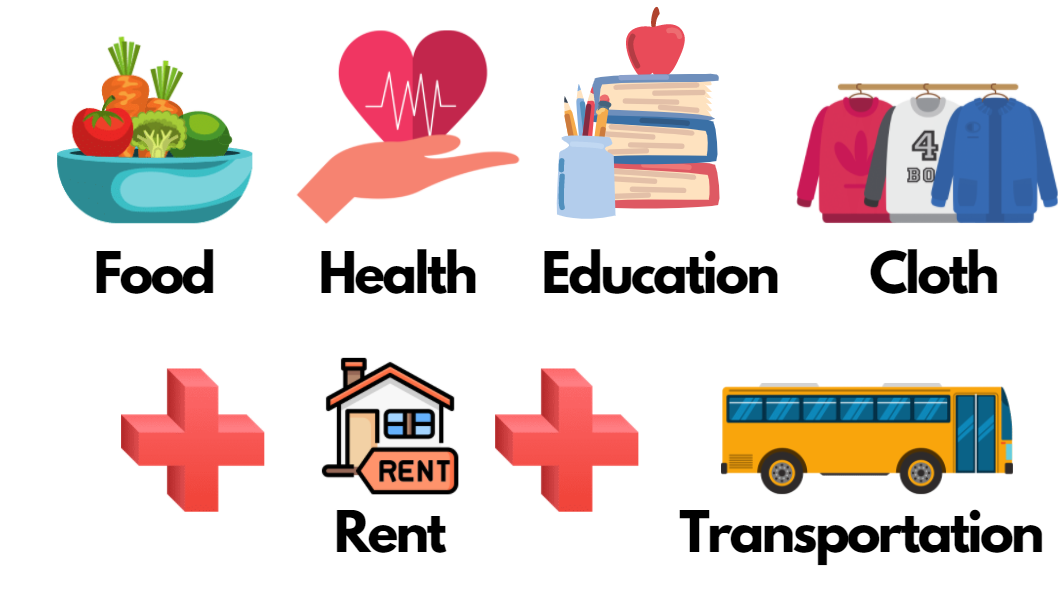
defined Poverty Line based on per capita monthly expenditure.
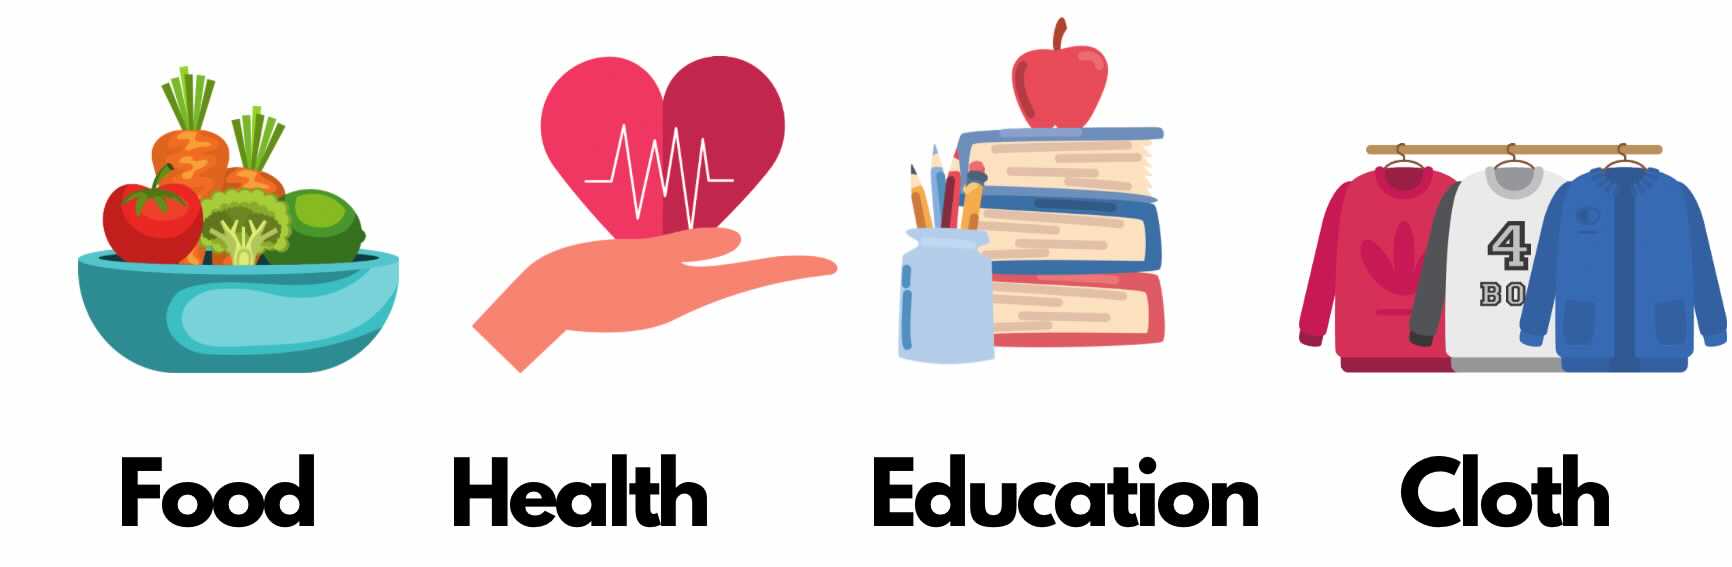
While calculating, Tendulkar Committee based its recommendation on food, health, education and clothing.
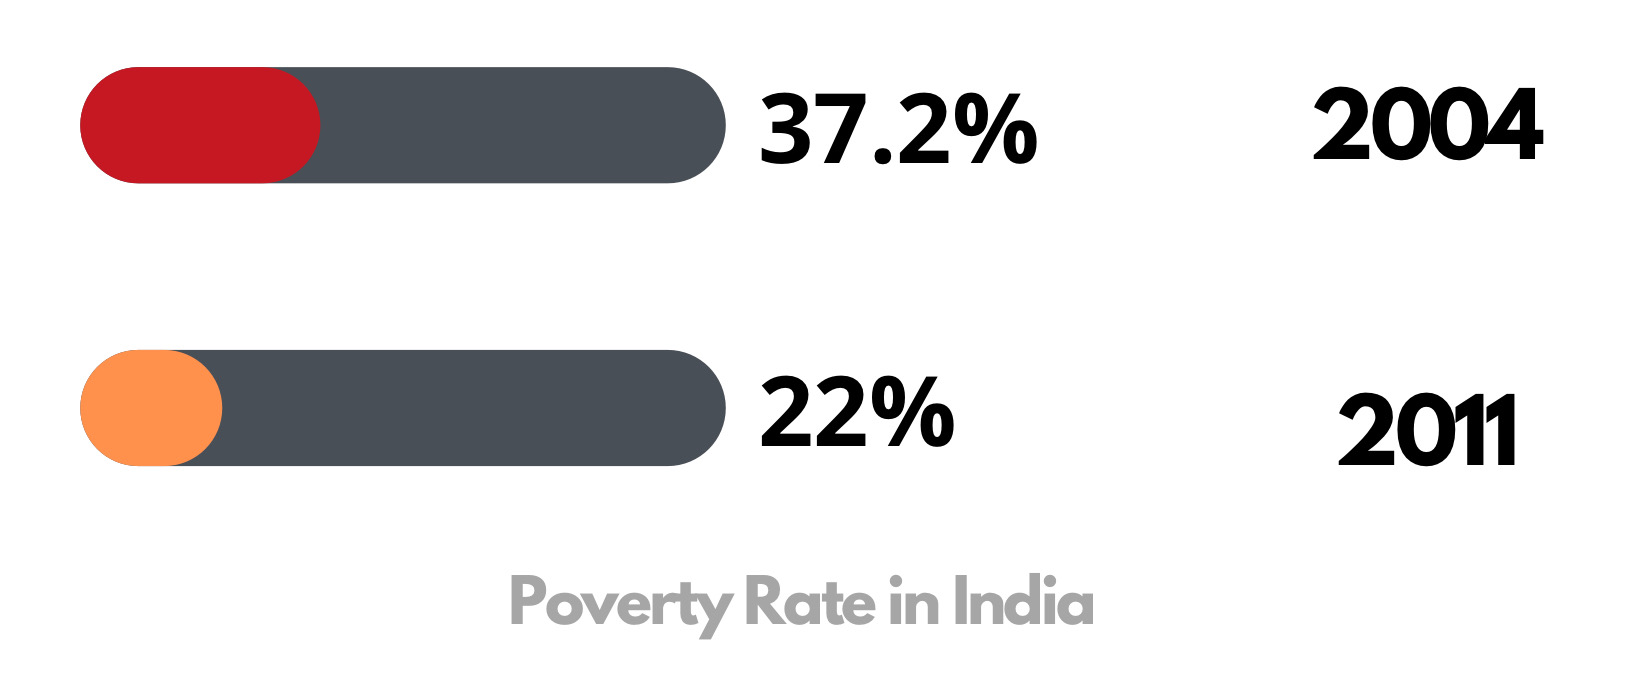
According to Tendulkar Committee Report, Poverty has declined in
India from 37.2% in 2004 to 22% in 2011.
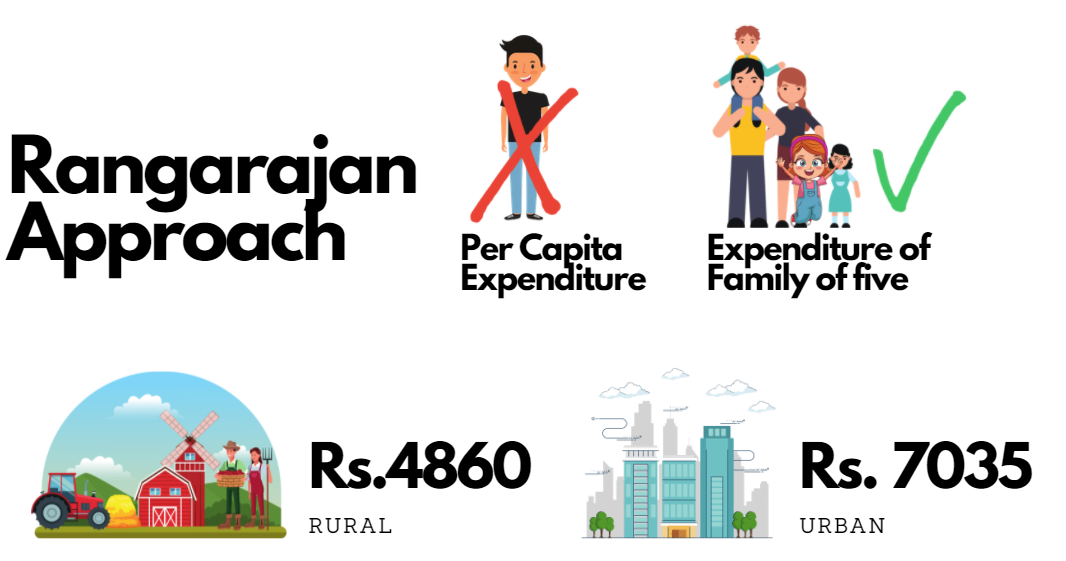
3. C Rangarajan Committee
C Rangarajan Committee defined Poverty Line based on Monthly Expenditure of family of five.
Rangarajan Committee took more things than Tendulkar Committee into its calculations
Rangarajan Committee
also recommended delinking the
Poverty line from the Government entitlement benefits. Food Security benefits
should be given as per Social and Caste dimensions and not BPL.
4. Saxena Committee on Rural Poverty (2009)
When Tendulkar Committee Report came, the Ministry of Rural development hurriedly set up a committee known as the SAXENA COMMITTEE in 2009 to review the methodology for inclusion of a person in the BPL Category to include them in government schemes.
Recommendation of the Committee
Committee gave the famous Automatic Inclusion and Automatic
Exclusion principle.
The automatic inclusion criterion for the most vulnerable sections of society (E.g. homeless people, persons with disabilities etc.)
Automatic Exclusion: Those having motorbikes etc.
Apart from being Automatically included, find other using scores of various deprivations.
5. Hashim Committee on Urban Poverty (2012)
To suggest a methodology for inclusion of a person in the BPL category in Urban Areas to include them in government schemes.
Recommendations of the Committee
Automatic Exclusion
Automatic Inclusion
Scoring Index: remaining households will be assigned scores from 0 to 12 based on various indicators. They should be considered eligible for inclusion in the BPL List in the increasing order of higher scores.
Multidimensional Poverty Index
In India, we calculate poverty using Tendulkar Method based on household consumption.
But UNDP takes a holistic view of poverty and measure it differently.
The report has been released since 2010.
In Multidimensional Poverty, they look into the following components to measure poverty (HES)
Health with components like child mortality
Education with components like years of schooling
Standard of Living with components like Electricity, water etc.
Andhra Pradesh is already using this approach.
Capability Approach to Poverty by Amartya Sen
Traditional Approach
Poverty is defined by an individual’s income.
E.g., Extreme Poverty is defined as those who live on $1.25 per day or less.
As a result, following this approach, governments centre their Poverty Removal Policies on job creation, GDP growth and other economic policies.
Capability Approach
In richer countries, all are fortunate enough that they can earn a good income. Does that mean they are not poor?
Amartya Sen’s Capability approach defines poverty in a Holistic Way. A better approach to look at poverty is the deprivation of a person’s capabilities to live the life they value.
Well Being Approach
Given by Erik Allard, it
includes three dimensions as:
Having (Material),
Loving (Social), and
Being (Spiritual-emotional)
World Poverty Clock
The World Poverty Clock was developed by World Data Lab to monitor global progress toward ending extreme poverty.
The latest data (released in March 2024) shows that India has managed to reduce extreme poverty to below 3% of its population.
Critique of these Poverty Lines
Experts argue that the Indian way of calculating poverty is incorrect. It is simply what some call a “starvation line”. Critics argue that governments around the world keep the poverty line at low levels to show that millions have been moved out of poverty.
India should be using some relative measure as opposed to the absolute measure to define poverty. In most Europe, a family with a net income of less than 60% of the “median net disposable income” is counted as poor. A poverty line “relative” to the national average also gives an idea about the state of inequality.
A comparison shows that India’s poverty line is abysmally low than even African Poverty Lines. Even the poverty line of Rwanda is higher than that of India. The per capita poverty line of a rural adult Rwandan in Indian terms comes out to be Rs. 900/ month, more than Rs. 816 for a person in rural India.
Another critique that Poverty Line faces is that once decided, the PL remains the same for years & don’t take into account inflation. It needs to be updated every year by applying a cost inflation index to keep it realistic.
Multidimensional Poverty Index: We define poverty in a minimal way by just looking at household consumption. UNDP defines poverty using the Multidimensional Poverty Index, which takes a holistic view and considers indicators like Health, Education, and Standard of Living. India should move toward that.
Reduction of Poverty in India
According to Tendulkar Committee Report,
poverty in India has reduced from 37.2% in 2004 to 22% in 2011.
Reduction in poverty is attributed to
Increase in employment in the non-agriculture sector – The construction sector absorbed the landless labourers & daily wage earners from villages
Schemes like MGNREGA, National rural livelihood mission also reduced the stress during the lean season by creating employment opportunities during the non-agricultural season.
India’s demographic bulge provided more working population compared to dependents (Children and elders).
Social welfare schemes like PDS, AAY, MGNREGA, NRLM, Pension schemes and others provided a safety net to the poor
Inward remittances – Large emigration of the citizen to the US, EU etc. and to west Asian destinations like UAE, Saudi, Qatar etc. generated huge inward remittances for India, which directly benefited dependents in India
Quality jobs in the Service sector like BPO, Hospitality, Retail chain, E-commerce supply chain provided heavy wages.
The rapid growth of the economy provided better opportunities to come out of poverty through better employment opportunities, increased demand for services etc.
Chinese Case Study
According to World Bank, people living below the poverty line reduced from 770 million in 1978 to 5.5 million in 2019.
In 2021, China declared that it had eradicated extreme poverty.
Steps taken by Government in this regard
Targeted Approach: China identified the poorest region to allocate more resources there.
Economic Development: China’s economic development generated a lot of jobs, helping people to come out of poverty
Social Welfare Programs: The government provided healthcare coverage, education, housing assistance etc.
Agriculture and Rural Development: China focused on agricultural reforms, modernization, and supporting farmers.
Impact of LPG Reforms on Poverty
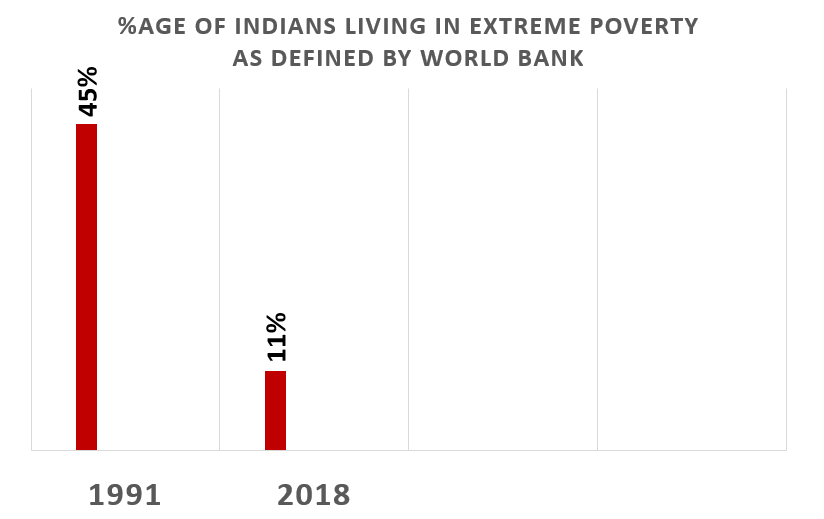
Poverty has decreased: Consider any Poverty Line, all points to the fact that Poverty in India has declined. Take the example of the extreme poverty line as defined by the World Bank.
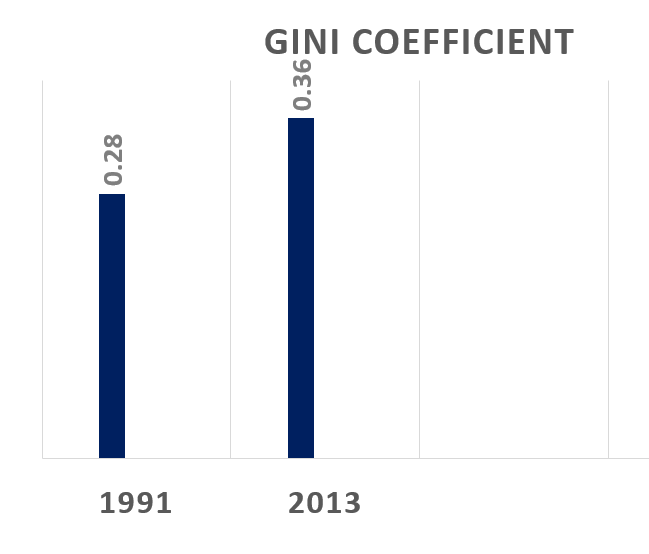
Inequality: Inequality in India has increased after LPG Reforms.
The
rich section has reaped the benefits of LPG Reforms. This is the leading cause
of the increase in Inequality.
The above Paradox can be explained by the Redistribution of Income by Government. Because of the increase in income of richer sections, the government is getting more taxes. Therefore, redistribution of this source has ensured that Poverty has decreased.
Impact of Poverty
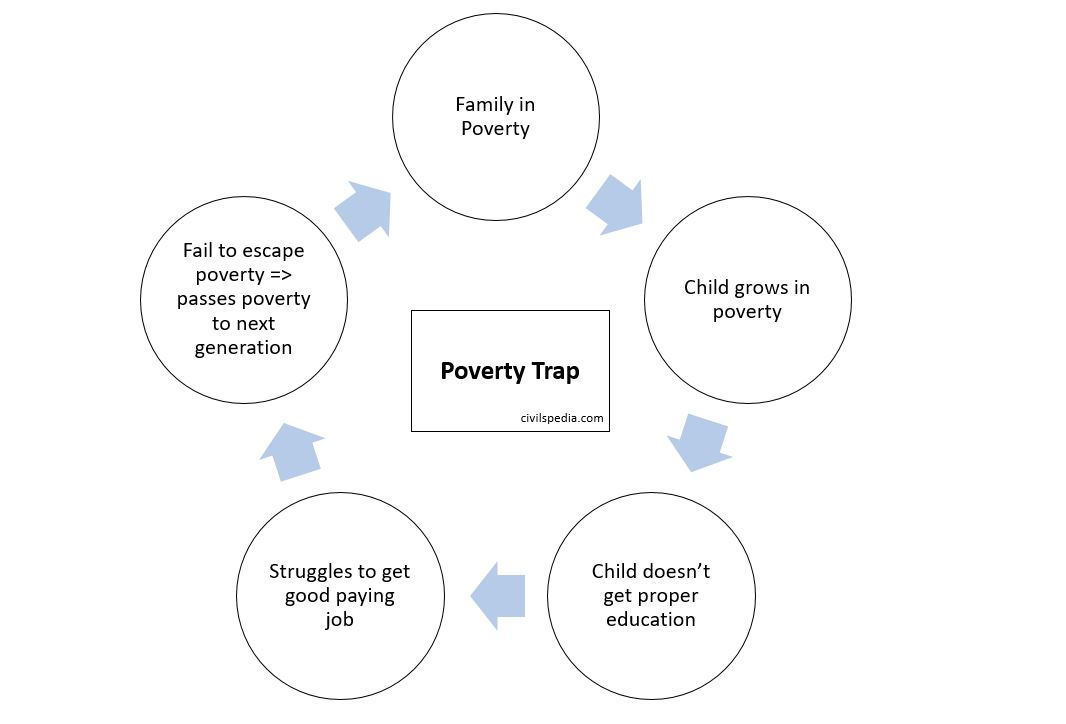
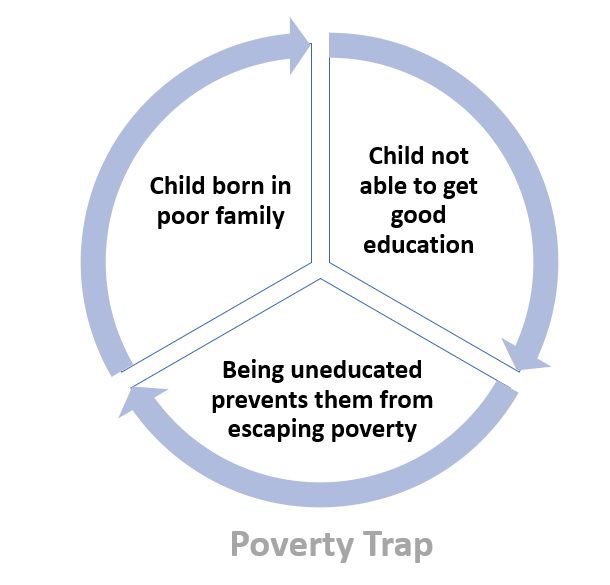
Several issues like hunger, illness and thirst are both causes and effects of poverty. Hence, the term known as poverty trap is usually used for this i.e. bad cycle is created not allowing people to come out of poverty
On Society
Poverty results in inequalities which can culminate into violent upheavals like Arab Spring. Various Revolutions in Arab Spring started because of the lack of jobs and high poverty levels.
On Children
Poverty leads children to build antisocial behaviour and social exclusion.
Terrorism
Most of the time terrorists do come from poor countries with high unemployment.
Diseases
Diseases are very common in people living in poverty because they lack the resources to maintain a healthy living environment.
Education
Those living below the poverty line cannot attend schools and create a vicious cycle in which poverty prevents people from getting a good education, and being uneducated prevents them from escaping poverty.
How can India reduce poverty?
Even though India has grown rapidly, its growth has been less effective at reducing poverty than in some of India’s middle-income peers such as China, Vietnam, Brazil and Turkey. The following can be done in this respect.
In Agricultural sector
With 4
out of every 5 of India’s poor living in rural areas, progress will need to
focus on the rural poor. Hence, the government should focus on following to
increase the income of those involved in the agriculture sector.
Value addition through food processing
Organic farming
Cooperation farming, milk cooperatives, and farmer producer organizations.
In Manufacturing Sector
Create Jobs in India via
Skill development
Make in India
Startup India
In Service Sector
Creation of quality jobs in BPO, IT and ITES for youth
Promotion of tourism
Promotion of higher job creation in e-commerce, supply chain, Hospitality and construction sectors.
In Governance
Implement Jan Dhan- Aadhar- Mobile (JAM) effectively to target subsidy to the poor and eliminate inclusion and exclusion errors.
Look into the feasibility of providing Universal Basic Income.