Human Development Report

Last Update: June 2023 (Human Development Report)

Human Development Report

This article deals with ‘Human Development Report’ This is part of our series on ‘Economics’ and ‘Society’. For more articles , you can click here .


Introduction

UNDP defines Human Development as the process of widening people’s choices and raising the level of well-being.

For instance, look at the following example.

Human Development Report

Human Development is the critical enabler for upward social mobility.


Human Development Report

  • It is prepared by the United Nations Development Program (UNDP) which provides a comprehensive analysis of human development across countries. 
  • In 1990, Mahbub-ul-Haq of Pakistan and Amartya Sen of India gave the concept of HDI. 
  • In various reports, it has been found that the Human Development of everyone is not taking place.
    • The human development of males is 20 points greater than females in South Asia.
    • Everywhere, the Human Development of elites and religious majorities is more than others.
    • Due to Climate Change, the Human Development of the present generation is more than what can be achieved by future generations. 

In Human Development Report, there are 5 Indexes.

  1. Human Development Index (HDI) 
  2. HDI – Inequality Adjusted 
  3. Gender Development Index(GDI) 
  4. Gender Inequality Index 
  5. Multi-dimensional Poverty Index (MPI)

The latest report for 2021/22 was released in 2022


1. Human Development Index  (HDI)

  • It was developed by United Nations Development Program (UNDP) in 1990 by a team headed by Prof. Mahbub ul Haq. Prof Amartya Sen was also a prominent member of this. 

Dimensions of HDI

Dimension Indicator 
Health Life Expectancy at Birth 
Knowledge Mean Years of Schooling
Expected Years of Schooling
Standard of Living GNI per capita
  • Switzerland topped the ranking in the latest report (2021/2022). India was ranked 132.

Indian Ranking

  Indian Ranking HDI Score
1990   0.429
2015 130 0.624
2016 131 0.624
2017 130 0.643
2018 129 0.647
2019 131 0.645
2021/22 132 0.633

Based on a report by the United Nations Development Program (UNDP), approximately 90% of nations have witnessed a decline in their Human Development Index (HDI) value during either 2020 or 2021. It signifies that global human development has come to a halt for the first time in 32 years.


2. Inequality-adjusted Human Development Index (IHDI)

  • Human Development Index is Geometric Mean. Hence HDI masks internal inequalities.
  • UNDP releases another Index which also accounts for inequalities.
  • HDI (Inequality adjusted) = HDI -(minus) HDI (lost due to Inequality), i.e. Human Development which is lost because of inequalities present in the country wrt gender is adjusted in this. 

IHDI (2022) Ranking

Rank Country HDI Score HDI-Inequality Adjusted Score
1 Iceland 0.959 0.915
2 Norway 0.961 0.908
—— —–    
108 India 0.633 0.475

When there is perfect equality, the HDI and the Inequality Adjusted HDI (IHDI) are equal. However, as the difference between the two increases, it indicates greater levels of inequality within the country.

Note: SDG Goal 10 calls for ‘reducing the Inequalities.’


3. Gender Development Index

  • The Gender Development Index (GDI) is a separate measurement released by the UNDP to complement the Human Development Index (HDI) to address females’ development specifically. 
  • While the HDI does not provide specific information on female development, the GDI calculates the ratio of Female HDI to Male HDI. 

GDI = Female HDI/ Male HDI.

  • If the Development Index for females exceeds that of males, the GDI can be greater than 1.

4. Gender Inequality Index

  • The Gender Inequality Index (GII) has been calculated since 2010.
  • Despite improvements in life expectancy and access to education for women, they still face specific forms of inequality, such as early pregnancies, lack of representation, and limited participation in economic activities. Therefore, the United Nations Development Programme (UNDP) introduced a specialized index to examine gender inequality.

Dimensions of Gender Inequality Index

Dimension Indicator 
Reproductive Health Maternal Mortality Rate
Adolescent Birth Rate
Empowerment Parliament Seats occupied by Women
Higher Education Attainment Levels
Economic Activity Female Labour Force Participation

The calculations used for the Gender Inequality Index (GII) are represented on a scale of 0 to 1, with 0 indicating no inequality (i.e., women fare equally to men) and 1 representing complete inequality (i.e., significant disparities between women and men).

GII (2022) Ranking

  • India is Ranked = 122 (Score: 0.490)
  • This score is better than that of the South Asian region (value: 0.508) and close to the world average of 0.465. This reflects the Government’s initiatives and investments towards more inclusive growth, social protection, and gender-responsive development policies. 

5. Multidimensional Poverty

  • In India, we calculate poverty using Tendulkar Method based on household consumption.
  • But UNDP takes a holistic view of poverty and measures it differently. 
  • The report has been released since 2010.
  • In Multidimensional Poverty, they look into the following components to measure poverty (HES)
    • Health with components like child mortality
    • Education with components like years of schooling
    • Standard of Living with components like electricity, water etc.
Multidimensional Poverty
  • According to the 2022 Report, 16.4 per cent of the Indian population (22.8 crores) is Multidimensionally Poor
  • Additionally, Multidimensional Poverty is continuously decreasing in India.
Multidimensional Poverty  in India - Trend

Anti-Microbial Resistance

Anti-Microbial Resistance

This article deals with ‘Anti-Microbial Resistance – for UPSC.’ This is part of our series on ‘Society’, which is an important pillar of the GS-1 syllabus. For more articles, you can click here.


What is Anti-Microbial Resistance?

Anti-Microbial Resistance (aka Antibiotic Resistance) happens when microorganisms (such as bacteria, parasites, viruses and fungi) evolve when they are exposed to the antibiotic and develop resistance mechanisms to it or acquire that resistance from another bacterium. 

Anti-Microbial Resistance

History

2010 It became a topic of debate in India when the British journal Lancet named an enzyme as New Delhi Metallo-beta-lactamase-1 or NDM-1, which had antimicrobial resistance  
2016 Resistance to Colistin was detected in China. Colistin is the last resort of antibiotics.   
Sept 2016 United Nations held a high-level meeting to tackle Antimicrobial Resistance.  

Note: It was only the fourth time the general assembly held a high-level meeting for a health issue (previously, it was for HIV non-communicable diseases such as heart disease and diabetes and Ebola).
2017 A US woman died from an infection that was resistant to all 26 available antibiotics. 
2023 Muscat Conference on Antimicrobial Resistance held.  Muscat Manifesto was released, calling for
1. Accelerating the political commitments in the implementation of One Health Action
2. Recognize the impact of AMR on humans as well as Animals. 

Causes of Anti-Microbial Resistance

Causes of Anti-Microbial Resistance

Significant sources of resistance: 

  • Overuse of antibiotics by human beings  (over prescription)
  • Self-medication
  • Overuse of antibiotics in the veterinary sector
  • Environmental antibiotic contamination due to pharmaceutical companies and hospital discharge. 
  • Lack of new antibiotics being developed
  • Patients not finishing treatment 
  • Poor infection control in hospitals 

Ways to control Anti-Microbial Resistance

Prescriber

Prescriber should 

  • Follow guidelines
  • Perform Antimicrobial susceptibility tests
  • Maintain hygiene, disinfection and sterilization in the hospital

Farmer

Farmers should

  • Follow guidelines.
  • Use only animal-specific antibiotics
  • Maintain hygiene

Public 

Public should 

  • Follow the prescription and don’t self-medicate himself
  • Public awareness and education should be carried out 

Politician 

Politician should

  • Establish Antibiotic Resistance related laws
  • Make National Plans and Guidelines 
  • Invigorate the antibiotic development of pharmaceutical companies

Researcher 

Researcher should 

  • Develop a new generation of antibiotics 
  • Develop Molecular Techniques for identifying resistance genes.

Initiatives taken by Government 

1. Red Line Campaign

Red Line Campaign for Anti Microbial Resistance

2. National Surveillance System for Anti-Microbial Resistance 

  • The program keeps a close watch on such cases.

3. National Action Plan on Anti-Microbial Resistance

  • The program was started April 2017  
  • It focused on
    1. Hand Hygiene and Sanitation programs
    2. One Health Strategy

4. National Health Policy, 2017

  • It had specific guidelines for the use of antibiotics and limiting the use of antibiotics.

5. Schedule H1 of Drugs and Cosmetic Rule, 1945

Schedule H1 was added to the Drugs and Cosmetic Rule 1945. Drugs in Schedule H1 are required to be sold in the country with the following conditions:-

  1. Their sale has to be registered in the register with the name of the prescriber and patient  
  2. Drugs shall be labelled with the symbol Rx & drug warning.   

International Steps

1. By WHO

  • WHO is providing technical assistance to countries to develop national action plans to combat Antimicrobial Resistance and strengthen their surveillance systems. 
  • One Health Approach: The One Health approach recognizes the interconnectedness between human, animal, and their shared environment. It emphasizes the importance of addressing health issues comprehensively by considering the interdependencies and interactions between humans, animals, and their shared environments. The ‘One Health’ approach calls for optimal antibiotic use in both humans and animals.

2. UNO

  • A high-level meeting on antimicrobial resistance was held at the United Nations General Assembly.  

3. New Antibiotics 

  • For example, ODLs are a new class of antibiotics discovered by the University of Illinois and Nosopharm, a French company.

Soils of India

Soils of India

This article deals with ‘Soils of India ’ This is part of our series on ‘Geography’ which is an important pillar of the GS-1 syllabus. For more articles, you can click here


Introduction

Indian Council of Agriculture Research (ICAR) divides the soils of India into the following eight major groups

Soils of India
Soils of India (percentage of different soils)

1. Alluvial Soil

  • 22.16% of the total area of India consists of Alluvial soil. 
  • Alluvial soil formation results from the deposition of soil carried downstream by rivers originating from the Himalayas and southern plateau
  • Their texture is sandy loam to clay.
  • Their colour varies from ash grey to light grey.
  • Their profile shows no marked differentiation
  • Chemical Composition
    1. These soils are rich in potash, phosphoric acid, lime and carbon compounds 
    2. But they are deficient in nitrogen and humus. (they need urea for cultivation)

They are of two types

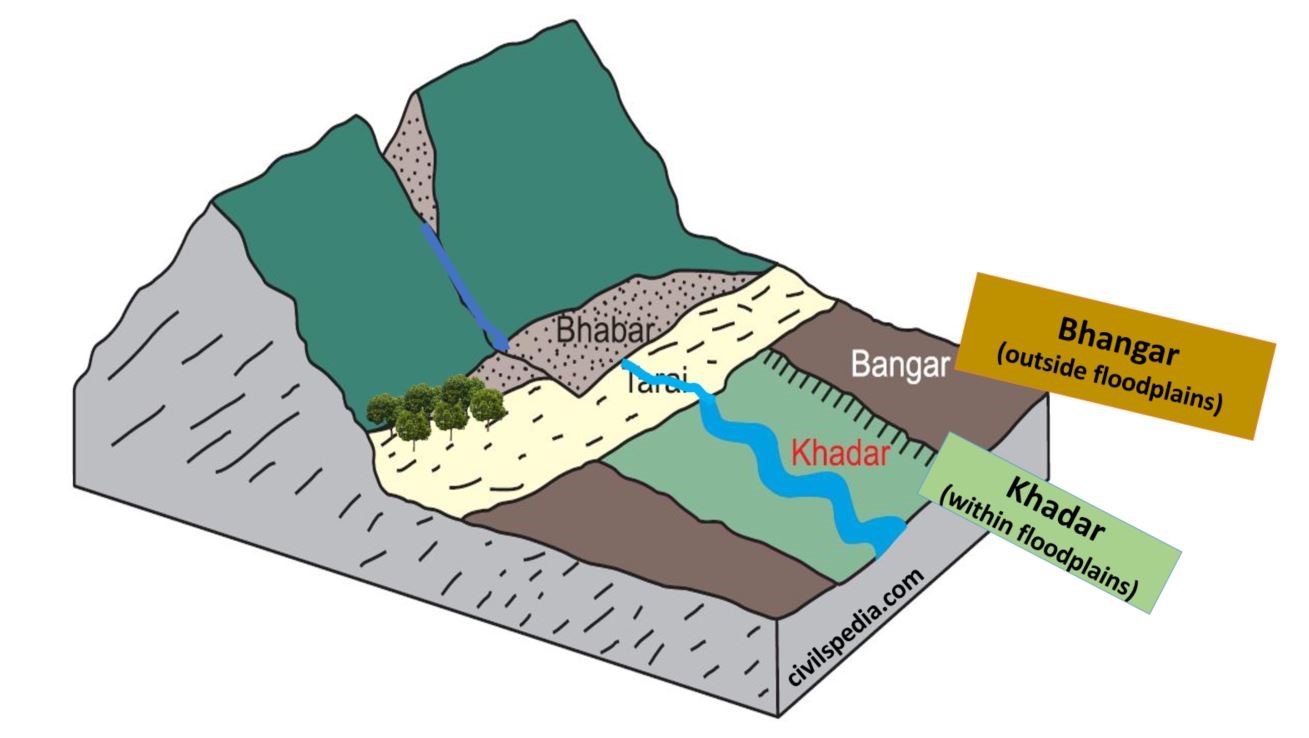
Khadar Found in the floodplains of the rivers and contain fresh alluvial.  
They are rich in kankar or nodules of impure CaCO3.
Bhangar They are found well above flood plains and contain old alluvial
Khadar and Bhangar
  • They are found in 
    • Plains of Ganga-Indus river valleys of Punjab, Haryana, Uttar Pradesh, Delhi, Eastern Rajasthan, Bihar, West Bengal
    • Brahmaputra and Surma valleys of Assam
    • Mahanadi valley of Orissa
    • Narmada and Tapti valleys of Madhya Pradesh 
    • Deltaic areas of Godavari, Krishna and Cauvery in the South
  • Crops grown in it includes Rice, Wheat, Sugarcane and Oilseeds

2. Black Soil

  • 29.69% of the total area of India consists of black soil. 
  • They are also known as ‘Regur Soil’. 
  • Black soil has formed due to the disintegration of basalt volcanic rocks of the Deccan Traps
  • The black colour of these soils is due to the presence of iron and aluminium. 
  • Their texture is clayey
  • Chemical composition 
    1. They are rich in iron, potash, aluminium, lime and magnesium. 
    2. But they are deficient in nitrogen, phosphorus and organic matter.
  • They have two unique properties.
    1. Self-Ploughing Nature: It has high clay content & as a result, cracks are developed when it is dry & becomes sticky when wet. Cracks allow air to reach depth. Aeration, usually done by ploughing the field, happens naturally. 
    2. It has a high water retention ability. Hence, it is suitable for cotton cultivation. (Note: cotton grows in dry areas because a dry climate is required for boll formation, but roots need a good water supply, which is ensured by the high clay content of black soil) .
  • They are found in 
    1. Maharashtra and Malwa plateaus,
    2. Kathiawar peninsula
    3. Kaimur hills
    4. Telangana and Rayalaseema region of Andhra Pradesh 
    5. Northern part of Karnataka
  • Crops grown in it include Cotton (most important), Millet, Tobacco and Sugarcane.

3. Red Soil

  • 28% of the total area of India consists of Red soil. 
  • These soils have been formed by the disintegration of ancient crystalline and metamorphic rocks like granites and gneisses.  
  • The red colour of these soils is due to the presence of iron.
  • Their texture is sandier and less clayey.
  • Chemical composition 
    1. They are rich in iron, magnesium, aluminium and potash.
    2. But they are deficient in humus, nitrogen and phosphorous.
  • They practically encircle the entire black soil region of the Deccan plateau on all sides and are found in 
    1. Whole of Tamil-Nadu,
    2. Parts of Karnataka
    3. North-east Andhra Pradesh
    4. Orissa
    5. South Bihar,
    6. eastern Madhya Pradesh 
    7. North-eastern hilly states.
    8. Aravalli mountain regions of Rajasthan.
  • They are found in arid regions with low rainfall. But under irrigation, these soils provide good production with the application of ammonia, superphosphate, and compost fertilizers.
  • Since they are rich in magnesium, iron and aluminium, so can produce excellent crops like bajra, pulses, cotton, tobacco, jowar and fruits.

4. Laterite Soil

  • 2.62% of the total area of India consists of laterite soil. 
  • These are soils of warm wet tropical regions, where due to heavy rain (more than 200 cm), lime, silica and salts are leached away, and oxides of iron and aluminium are left behind.
  • The word laterite means brick type. It is named so because it hardens like Brick when dry. However, it is soft when it’s wet. 
  • They are red in colour due to the presence of Iron oxide.
  • Their texture is heavy loam and clay.
  • Chemical Composition 
    1. They are rich in Iron and Aluminium oxides and hence are acidic.
    2. But they are poor in nitrogen, lime, potash, phosphorus and organic matter. The Humus content of the soil is removed fast by bacteria that thrive well in high temperatures.
  • These are found on 
    1. Hills of Satpura and Vindhya 
    2. Eastern Ghats region of Orissa,
    3. Hills of Western Ghats of Karnataka
    4. South Maharashtra
    5. Malabar in Kerala 
    6. North & Eastern parts of the Shillong plateau in the northeastern states
  • It is not very suitable for agriculture because of its high iron content. But it is suitable for crops that need iron for growth, i.e. Tapioca, Cashew nuts, Coffee and Rubber.

5. Arid and Desert Soils

  • 6.13% of the total area of India consists of Arid and Desert Soils. 
  • They are also called Sierozem soils.
  • They are formed under arid & semi-arid conditions, high temperatures and accelerated evaporation when the soil becomes dry.
  • Their texture is sandy.
  • Chemical Composition 
    1. They contain a high proportion of salts
    2. But they are deficient in humus, nitrogen & moisture.
  • As a result of the “Kankar” layer formation in the bottom layers, water infiltration doesn’t happen. But in case water is made available by irrigation, the soil moisture is easily accessible to the plants their sustained plant growth
  • They are found in
    1. Rajasthan
    2. Northern Gujarat  
    3. Southern Punjab and Haryana (Desert soil reaches here from Rajasthan under the influence of sand storms, in the form of ‘Bhur’ soils)
  • With irrigation facilities, crops like bajra, jowar, cotton, wheat, sugarcane, and some vegetables can be grown.

6. Forest and Mountain Soils

  • 7.94% of the total area of India consists of Forest and Mountain soil. 
  • As the name suggests, this type of soil is found in the mountains. 
  • The thickness of the upper layer is very low on mountain slopes, although it can be up to 2 metres in valleys and gently sloping hillsides. These are less developed immature soils.
  • Their colour and character change with height.   
    1. Up to an elevation of 1800 metres: brown-coloured, acidic forest soils are found due to the decomposition of deciduous vegetation. 
    2. Between 1800 and 3000 metres: Low temperatures and poorly decomposed coniferous vegetation convert these soils into grey-brown podzolic soils. 
    3. Above 3000 mAlpine meadow soils occur above the timberline. These are shallow, dark in colour and sandy-loam or sandy-silica in texture. The organic matter is not decomposed in these soils due to a sharp fall in temperature.
  • These are found in 
    1. Lower and middle ranges of the Himalayas, especially in Assam, Ladakh, Lahaul –Spiti, Kinnaur, Darjeeling, Dehradun, Almora, Garhwal etc 
    2. Nilgiri hills in the south.
  • These soils can be used to grow Coffee, tea, maize, potato, fruits and various types of spices
  • Apart from that, forestry and lumbering activities are also done here. 

7. Saline and Alkaline Soils

  • 1.29% of the total area of India consists of Saline and Alkaline soil. 
  • They are also known as Usara soils.
  • These soils can be formed due to many reasons in
    • In the interior areas, saline soils originate due to bad drainage, over-irrigation or canal seepage. It causes water logging, and the capillary action transfers injurious salts from the subsurface to the topsoil.
    • In dry agricultural areas, relying on excessive irrigation. Such conditions promote capillary action resulting in the deposition of salts in the top layer.
    • In coastal areas, saline soils form due to Sea water intrusion. 
  • Their structure ranges from sandy to loamy. 
  • Chemical Composition
    1. They have excessive amounts of sodium, potassium & magnesium. It makes such soils infertile, and they can’t support vegetative growth.
    2. They lack nitrogen and calcium. 
  • They are found in
    • Deltas of the Eastern coast, Sundarbans of West Bengal and Western Gujarat due to seawater intrusions  
    • Areas of Green Revolution like Punjab (locally called Kallar or Thur), Haryana and Uttar Pradesh

8. Peaty and Marshy Soil

  • 2.17% of the total area of India consists of Peaty and Marshy soil. 
  • Such soils are found in areas with heavy rainfall, high humidity, and good vegetation growth. Hence, excessive dead organic matter is present in such areas, providing humus and organic content to the soil. Organic matter in such soils can range between 40 to 50 per cent.
  • This soil is heavy and black in colour. 
  • They are found in 
    1. Sundarbans Delta
    2. Coastal areas of Orissa
    3. South-Eastern coastal parts of Tamil Nadu
    4. Central Bihar 
    5. Almora district of Uttar Pradesh