Last Update: September 2025 (India-Myanmar Relations)
Table of Contents
India-Myanmar Relations
This article deals with ‘India-Myanmar Relations.’ This is part of our series on ‘International Relations’, which is an important pillar of the GS-2 syllabus. For more articles, you can click here.
Historical Bonds
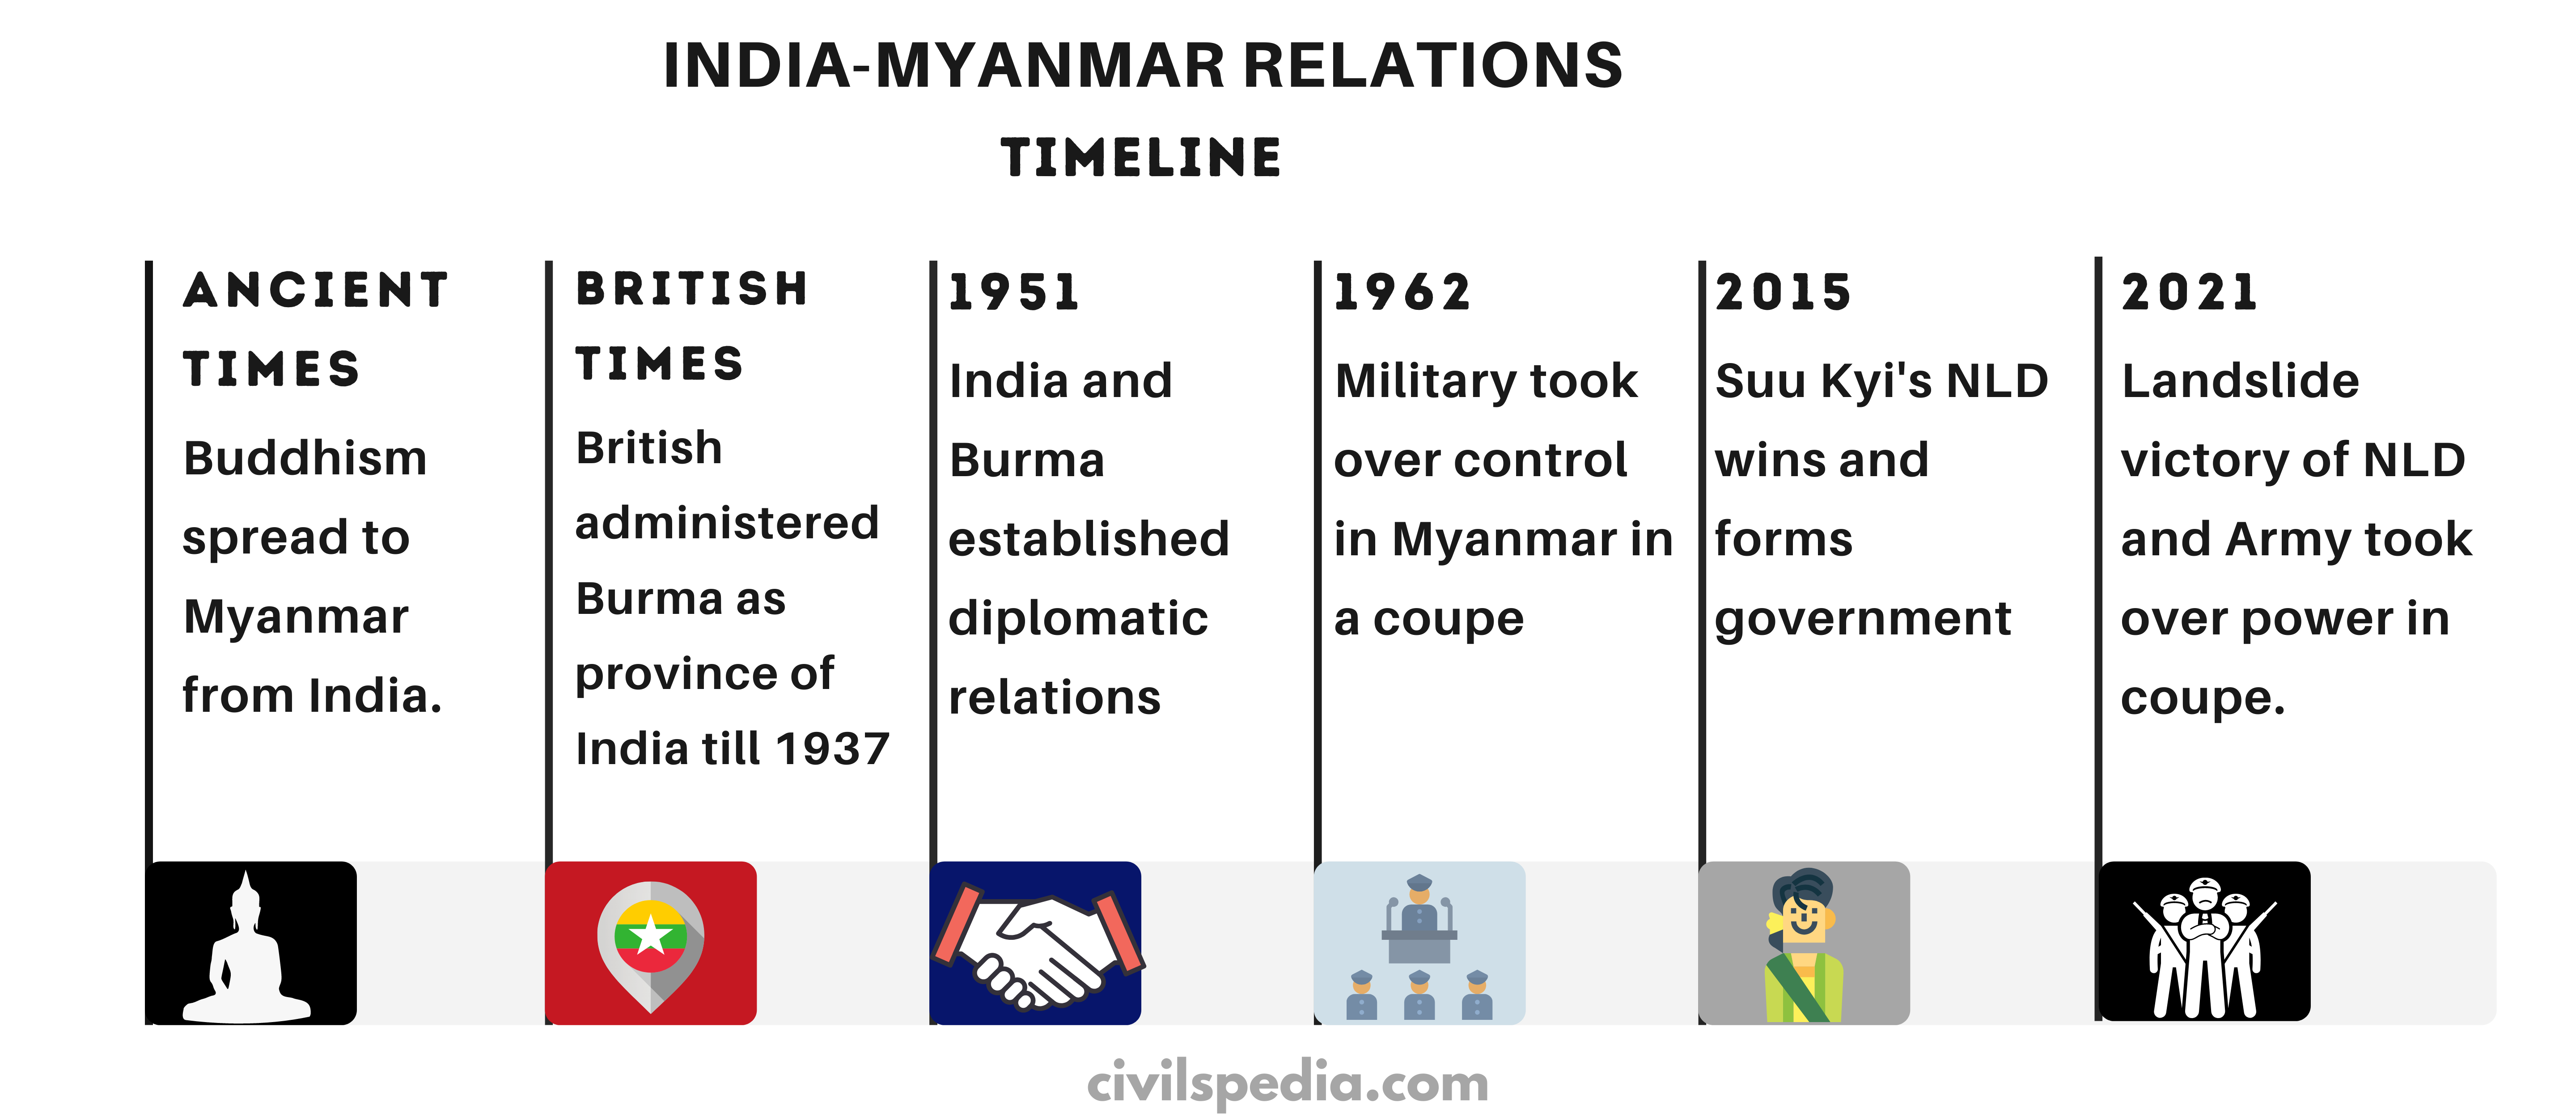
Two Indian monks named Tapusa and Bhallika promoted Buddhism in the Myanmar region in ancient times. Ashoka, during his reign, also sent missionaries to Myanmar or Burma.
Rulers of Myanmar, since ancient times, have been majorly Kshatriyas, and their origins can be traced back to India.
Britishers exiled Bahadur Shah Zafar, the last Mughal Emperor, to Yangon in Myanmar and the Konbaung King of Myanmar to Ratnagiri.
When Britishers annexed Burma in the 19th century, they administered Burma as the province of India until 1937, when Burma was separated from British India and made a separate colony.
Yangon was once a centre for India’s independence struggle. General Aung San, Burma’s independence hero, was a close friend of Netaji.
In 1951, India and Burma established diplomatic relations in modern times through a treaty of friendship.
Importance of Myanmar for India
Myanmar is vital for India because
Myanmar is an integral part of India’s Act East Policy.
Myanmar can act as transit for North East.
It is the only Indian neighbour of ASEAN. Hence, Myanmar can serve as India’s Bridge to ASEAN.
1. Connectivity
It can be seen in the following aspects
1 . Bridge to ASEAN
Projects
in which Myanmar is important include
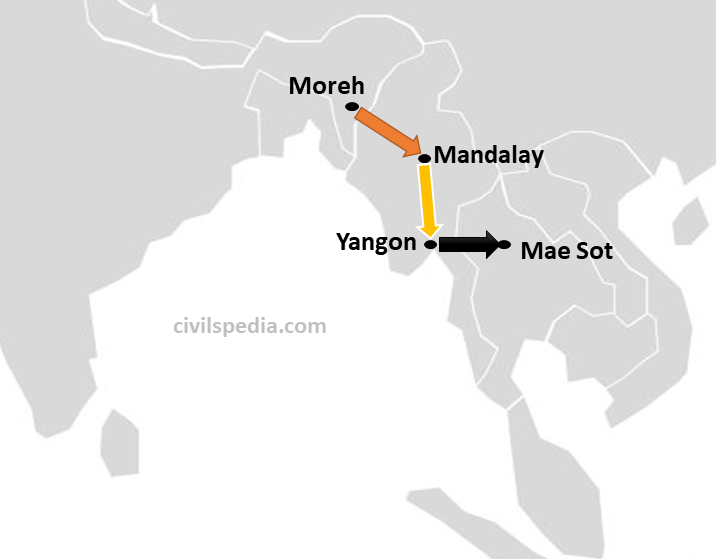
IMT Highway: Highway connecting Moreh in India to Mae Sot in Thailand and passing through India, Myanmar & Thailand.
BCIM Project: Bangladesh, China, India and Myanmar are part of this project.
2 . Important for connecting North East
Myanmar is essential for the connectivity of North-East India with the rest of the world.
The important projects in this regard include Kaladan Multimodal Transit Transport Project.
Side Topic: Kaladan Multimodal Transit Transport Project
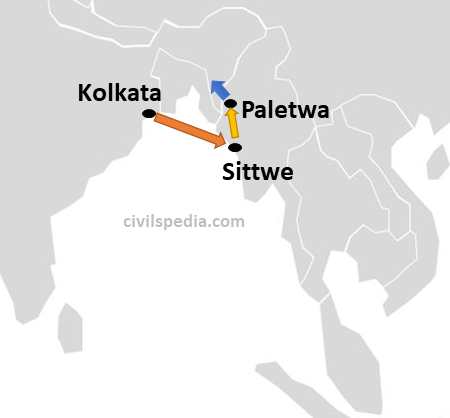
Kaladan Multimodal Project can act as an alternate outlet for North Eastern states and an alternate route to connect to mainland India.
It will connect Kolkata (port) => Sittwe (port in Myanmar) => Paletwa (river port on Kaladan river) => Mizoram (via road).
The project will boost employment and lower the food prices in the region, but the intrusion into the area will threaten local heritage.
Side Topic: BCIM Corridor
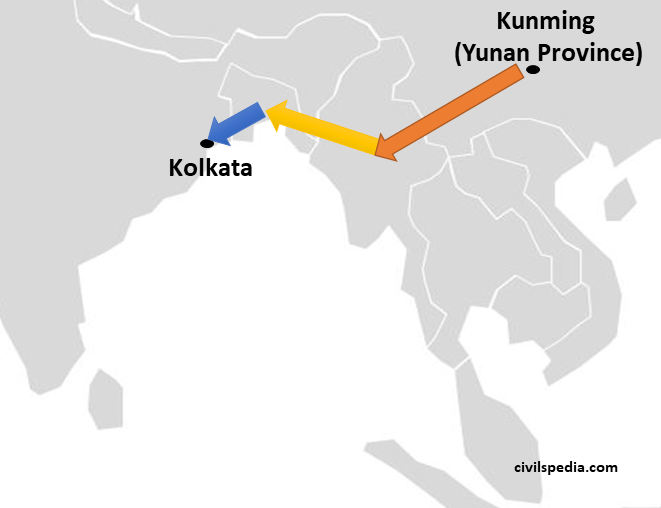
BCIM Corridor will start from Kunming and end at Kolkata, passing through Bangladesh, China, India and Myanmar.
Southwest China is landlocked & poor. China hopes, the BCIM corridor will
Provide an outlet to Yunan province
Boost trade & tourism in the region
Thereby reducing poverty and extremism in its southwest region.
Advantages of BCIM
For Act East Policy and North East
BCIM project is in line with India’s Act East Policy.
Indian states of the North East will come into the mainstream.
It can help in containing insurgency in North East by providing economic prosperity.
Exploiting each other’s trade complementarities, i.e. China’s manufacturing, India’s Service sector, Bangladesh’s low-cost manufacturing and Myanmar’s cheap labour and raw material.
BCIM project will help in creating Energy Corridor as
South-West China (Yunan Province), Bangladesh, Myanmar and Assam have petroleum resources.
This region has vast potential for Hydro-Electric Energy.
It will lead to a revival of Kolkata port. Earlier, Kolkata’s importance was lost due to its unnatural isolation from its natural eastern neighbourhood.
It will help exploit a huge market as the region hosts nearly 50 crore people & a growing middle class with increasing per capita income.
Tourism in the region will get a boost as well.
Problems
Ethnic insurgency :
Fighting between Myanmar Army and ethnic Kokang rebels based near the Chinese border.
United Wa State Army runs a parallel government in North Eastern Myanmar.
Indian North Eastern states are themselves hit by insurgency.
China insists on making it part of the Belt and Road Initiative (BRI), and India is not part of BRI.
Due to this project, India’s trade deficit with China will increase further.
The region is also hit by communal violence involving Buddhists and Rohingya Muslims.
It will connect Moreh in Manipur to Mandalay in Myanmar to Mae Sot in Thailand.
India and Thailand have constructed their part. Only Myanmar is lagging because of political instability.
2. LNG / Energy
Myanmar has extensive reserves of natural gas.
Myanmar’s gas is attractive for India because
Proximity: Easy to transport via pipelines.
Untapped: Indian Companies like ONGC Videsh can buy a stake.
It can usher prosperity in North-Eastern states.
ONGC has already invested $1.6 billion in Myanmar gas for a 30% stake in Shwe gas fields.
Jubilant Energy and Reliance are also working in shallow water blocks in Myanmar.
Note: China is far ahead as Chinese investments in the energy sector in Myanmar has been $ 8 billion.
3. Trade & Investment Opportunities
Myanmar’s economy is opening up. Hence, there are immense investment opportunities for Indian companies.
India imports beans, pulses and forest products from Myanmar while it exports steel and pharmaceutical products to Myanmar.
Myanmar is also helpful in ‘Make Outside India’ because of Free Trade Access to ASEAN Market.
There are extensive untapped Natural Resources (oil, gas, teak, copper & gemstone) in Myanmar, which can aid the growth of the Indian economy.
Myanmar is the second-largest supplier of beans and pulses to India.
There has been a massive presence of Indian companies in Myanmar. Tata Motors has established a truck assembly plant in Magway. Apart from that, GMR, TVS motors, Birla Corporation, ITC hotels, Shree cement and Bharti Airtel are the notable Indian companies in Myanmar.
State Bank of India has also acquired the commercial license for banking purposes in Myanmar.
India is also trying to build a Buddhist circuit in association with Myanmar, where India intends to promote tourism and create jobs.
4. Security
Insurgents in North East, especially Naga groups, find safe havens in Myanmar where the border is not fenced and free movement of people is permitted due to the 16 Km Free Movement Regime.
In 2015, Indian troops reportedly crossed into Myanmar to target an NSCN (Khaplang) military camp. India & Myanmar are now helping each other in containing insurgency by not allowing insurgents to take shelter in each other’s territories.
Myanmar is a part of the Golden Triangle (Myanmar, Thailand and Laos) and has become an important transit country for illegal drug trafficking. In 2010, India and Myanmar established the Mutual Legal Assistance Treaty on criminal matters, which has emerged as the core legal instrument to address issues related to drug smuggling.
India has been a significant arms supplier to Myanmar. India has supplied T-55 tanks, transport planes and naval crafts to Myanmar.
In 2006, both concluded an MoU on intelligence sharing and training of Myanmar military personnel.
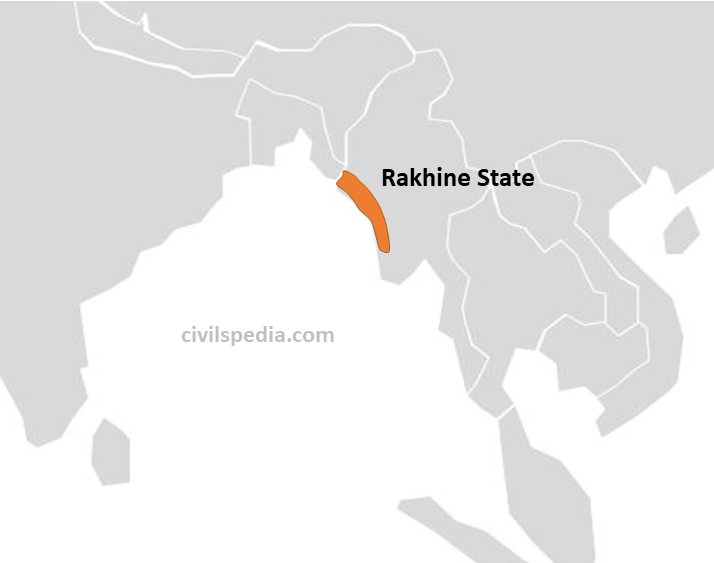
Side Topic: Rohingya Issue
Many Muslims were taken by the Britishers from Bengal to Burma from 1823 onwards when the British occupied the Rakhine state of Myanmar. After the independence of Burma in 1948, these Muslims stayed back in Burma. These are known as Rohingyas in Myanmar.
According to the 1982 Citizenship law of Myanmar, the Rohingyas were not recognized as an official ethnic group and, since then have become stateless in Myanmar.
In 2011, ethnic violence broke against the Rohingyas under a radical and rightist Buddhist monk known as Ashin Wirathu. It led to the mass exodus of Rohingyas to Bangladesh, India and Thailand. Those who remained in Myanmar were ghettoized and persecuted.
There are around 40,000 Rohingyas in India. The Indian government has decided to deport the Rohingya Muslims as
They have immigrated to India illegally.
These illegal immigrants, living majorly in Kashmir, are susceptible to recruitment by terrorist groups and thus constitute a security threat to India.
The influx of Rohingya Muslims to India also disturbs society’s demographic pattern and social, political, and cultural stability.
5. People to People Contacts
Buddhism reached Myanmar from India.
Both nations had excellent relations for centuries. Even during British colonialism, both Myanmar and India had almost a free movement of people & goods.
Many Tribes in the North East, like the Nagas, have a population on both sides of the border.
India has a two-million diaspora in Myanmar.
India was one of the first countries to send relief in response to the 2025 earthquake. India sent NDRF personnel and monetary and medical help.
6. Multilateral Engagements
ASEAN: Myanmar is the only ASEAN country that shares a land border with India.
BIMSTEC: Myanmar is a member of BIMSTEC.
India and Myanmar are part of the Mekong Ganga Cooperation.
SAARC: Myanmar was given the observer status in SAARC in August 2008.
Issue: China Factor
Myanmar shares a 2,100-km border with China.
Myanmar is part of OBOR, and China is building a following in Myanmar
Kyaukpyu port
Pipelines and Rail connecting Kyaukpyu to Yunan.
Myanmar is important to provide an outlet to the underdeveloped South Western Province (Yunan).
Energy: China has invested $ 8 billion in the Energy sector.
Debt Trap Diplomacy: China holds 40% of Myanmar’s debt.
Myanmar’s military equipment is 80% Chinese.
With Ethnic conflict going on in Myanmar & its porous borders with China, Myanmar requires Chinese assistance to cope with the situation.
Advantages of India over China in Myanmar
India prefers to give ‘Development & Human Capital Formation loans” while China indulges in ‘Debt Trap Diplomacy’.
India can help Myanmar in building up strong democratic institutions.
India is investing heavily in Myanmar. E.g., Sittwe Port and Kaladan Multimodal Project .
Both are part of Multilateral Forums like BIMSTEC and the Indian Ocean Rim Association.
Cultural Ties: India is the birthplace of Buddhism, and most of Myanmar’s population follow this tradition.
Constraints
1. Military Coupe
In a Coupe in February 2021, the Military (Tatmadaw) has taken the control into its hand and has placed “State Counsellor” Aung San Suu Kyi under house arrest. It was in response to her party’s landslide victory in the general elections in which the military-backed party was defeated badly.
In the absence of strong democracy, India cant invest freely in Myanmar. Apart from that, the coupe will strengthen the Chinese presence in Myanmar as Western pressure on Myanmar to restore democracy will force the military leaders to go near China.
2. Rohingya Problem
A large number of these refugees have also fled to India.
Sittwe port and Kaladan Multimodal Project also passes through Rakhine Province.
Due to state persecution of Rohingyas, an insurgent group in the firm of the Rakhine Rohingya Salvation Army has arisen.
3. Chinese Factor
China is investing in large projects in China as part of its ‘Debt Trap Diplomacy’. Ports like Kyaukpyu are alleged to be part of China’s String of Pearls strategy to contain India.
4. Project Delays
There is widespread discontent against India over continuing delay in the completion of flagship projects — Kaladan and the India-Myanmar-Thailand trilateral highway.
5. Insurgencies
India’s North-East is hit by insurgencies, making the completion of projects with Myanmar extremely difficult.
Sittwe port lies in the Rakhine province, which has been destabilised due to the Rohingya crisis.
Moreover, the Kaladan project is disrupted by the activities of the Arakan Army.
6. Economic Development
Myanmar is one of the poorest nations in Asia. Infrastructure in Myanmar is almost non-existent. Hence, Private Indian capitalists hesitate to invest.
This article deals with ‘Class System in India’ . This is part of our series on ‘Society’ which is important pillar of GS-1 syllabus . For more articles , you canclick here.
Introduction
Class is an economic concept which is decided by economic factors like income, wealth, and occupation of a person.
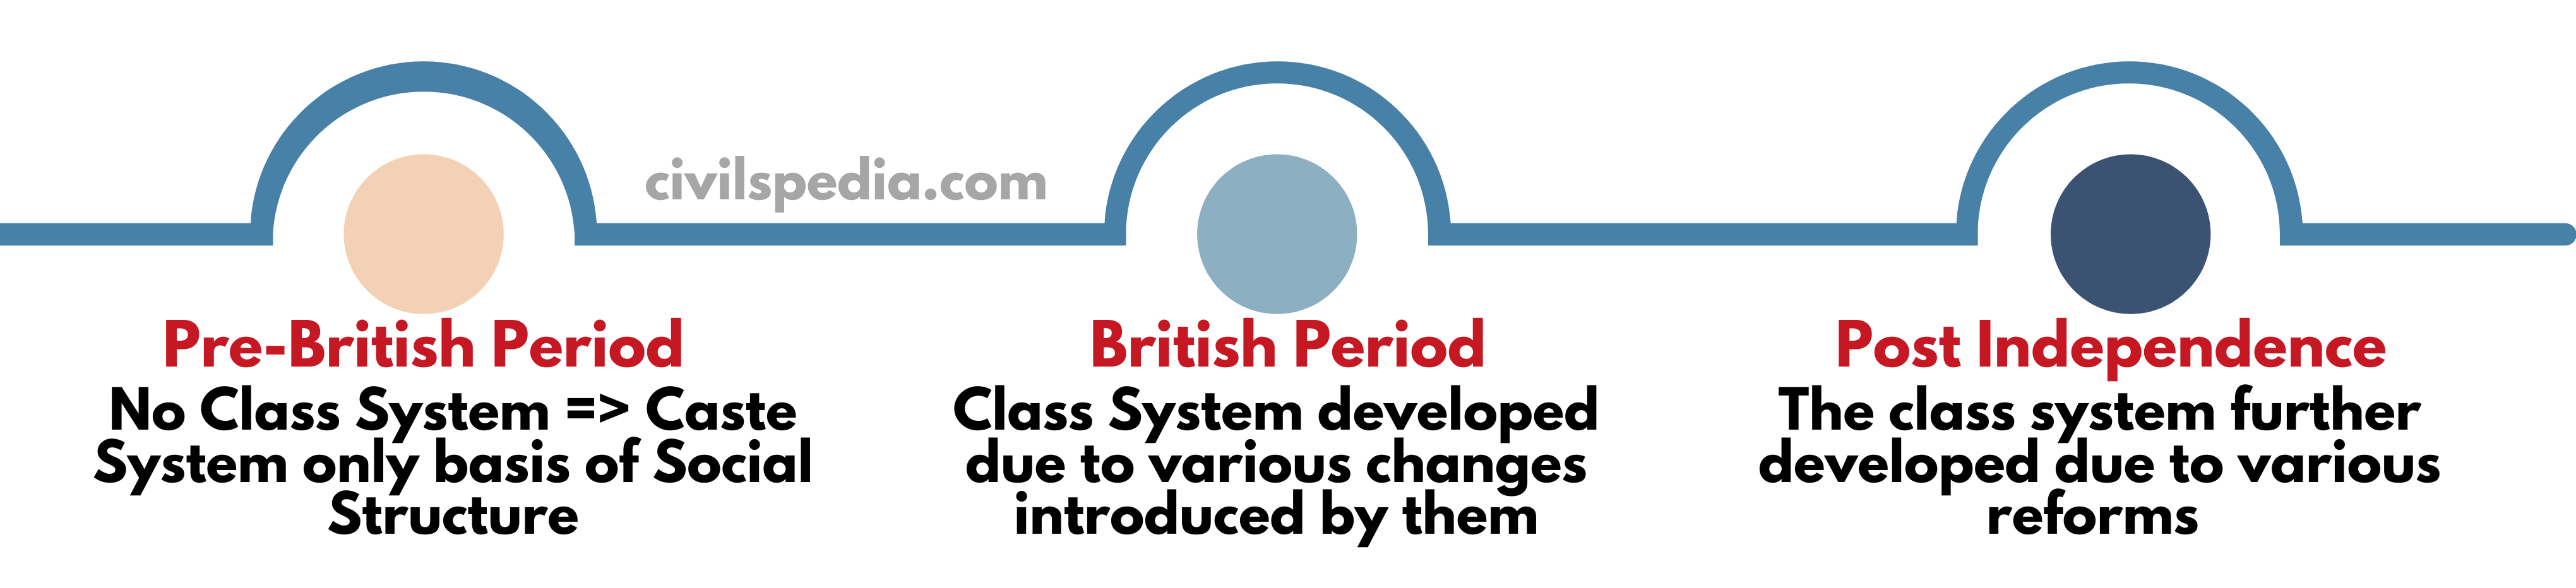
Before the arrival of the British, there were no vivid classes, as the caste system was the basis of social structure. The caste system was synonymous with the class system.
British rule & emergence of Class System
After
the arrival of the British class system developed in India due to
Agricultural reforms
Urbanization
Industrialization
Education
Agricultural Reform: After the arrival of
the Britishers, the Indian revenue system was overhauled into Ryotwari,
Mahalwari and Permanent system, which divided rural society into two classes
Zamindars & Mahajans
Farmers, Ryot, Small Animal Husbands and Landless Labourers
Industrialization and urbanizationdivided society into
Industrialists and investors
Labour class
Post-Independence
After
independence, the class system further developed in India due to reasons
like
Green revolution
IT revolution
LPG Reforms
Vocational education
After 1990 , even
three classes were subdivided thrice each
into lower, middle and upper.
Upper class(upper, middle and lower),
Lower class (upper, middle and lower
Middle class(upper, middle and lower)
Generally,
three classes broadly identified in India have the following characteristics
Upper Class: Those people who control and regulate wealth & investment and gain profit from wealth & investment.
Middle Class: Those people who do white collared jobs or are in technical or administrative sectors.
Lower Class: These people do unskilled or semi-skilled work.
Middle Class
The
middle class in India is decided mainly by three factors.
Income: Income ranges from Rs. 15,000 to 1.5 lakh/month. Income is such that basic requirements of life like food, housing, clothing, education and even entertainment are easily met.
Occupation: Middle class generally do white collared, technological or administrative jobs.
Education: They are well-educated and ambitious.
The
reasons for the expansion of the middle class in India are
Macaulay’s education policy
Industrialisation and urbanisation
Green revolution: Middle class created in OBC
Reservation and education: middle class in SC and STs
LPG reforms: middle class in women as a separate identity
Globalization: Middle class in states like Kerala, Punjab etc., with the help of remittances sent from abroad.
The
structure of the middle class in India is quite complex, and around 35 crore people come under it, double the
US population.
Importance of Middle Class
Initiator of Reforms: Historically, Middle Class has always been the initiator of reforms. French Revolution was the result of the Middle Class. Middle class acts as the opinion makers in the society and challenge the status quo.
Economic Development: Demands of the Middle Class are highest. Apart from that, they are the main tax contributors in the economy.
Political Accountability: Middle Class demands accountability, making government responsive and transparent.
Promotes the formation of human capital (as they spend on their children’s education).
But Indian Middle Class is criticized because
Self-Centric: The middle class is always interested in preserving and promoting their interests.
Self-Exclusivism: Instead of demanding accountability from the political system, they have started living in gated communities.
Not paying back to society: This is due to the fact that the middle class doesn’t accept that they have benefited from the highly subsidized education system.
Excessive indulgence: Middle class has indulged in excessive indulgence as consumerism has plagued it.
But
even after that, most social movements are led by the Middle Class.
This article deals with the ‘Mauryan Empire’. This is part of our series on ‘Ancient History’ which is an important pillar of the GS-1 syllabus. For more articles, you canclick here.
Introduction
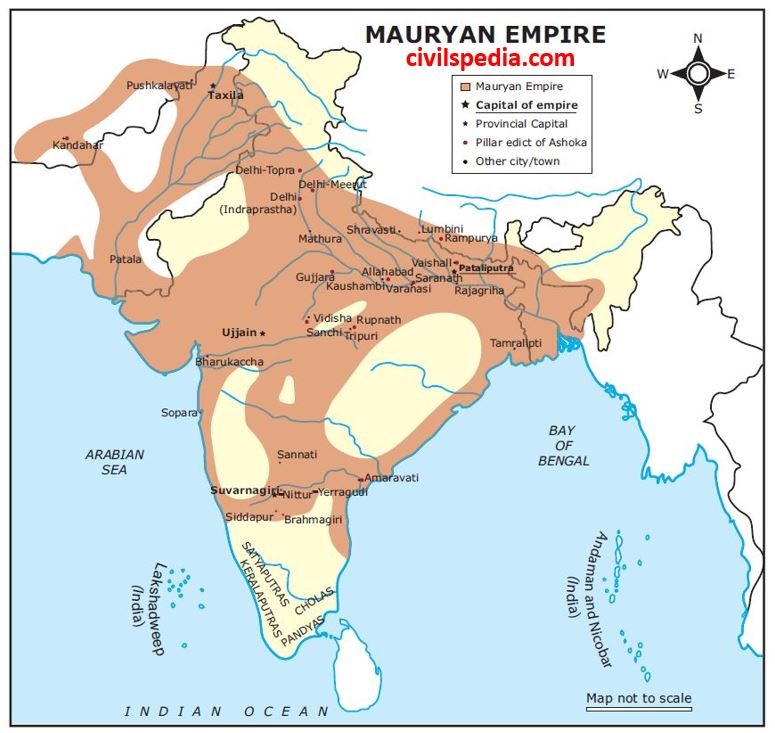
The Mauryan Empire is the first largest empires that were ever established on Indian soil.
Sources of Mauryan Empire
The sources include literary sources, epigraphical sources, foreign accounts and other materials obtained from archaeological excavations.
1 . Literary Sources
1.1 Arthashastra
Arthashastra means ‘science of statecraft‘.
It was written by Kautilya / Chanakya in the 4th century BCE during the reigns of Chandragupta Maurya (although there is debate about the authorship).
It consists of 15 books dealing with Internal Administration, Inter-state relations and miscellaneous topics.
It gives us information like the administrative system, officers, the role of King etc.
However, it must be remembered that the Arthashastra was a prescriptive text, which laid down the guidelines for good administration.
1.2 Megasthenes Indica
Megasthenes was the Ambassador of Seleucus Nikator (Indo-Greek king) in the court of Chandragupta Maurya.
Megasthenes wrote the book INDICA. Although the original book has not survived & fragments are preserved in later Greek works (of Diodorus, Strabo, Arrian, Plutarch & Pliny ).
But we have to keep in mind that India is seen through a double filter – first through Megasthenes interpretation of what he saw or heard & second Graeco-Roman writers interpretations of Megasthenes accounts.
1.3 Puranas
Puranas include a list of Mauryan Kings.
Eg: “Vishnu Purana’ throws light on the origin of Nandas and their overthrow by Chandragupta with the assistance of Kautilya.
1.4 Buddhist Texts
Ashoka was a celebrated figure in Buddhist texts because he was a patron of Buddhism.
He figures in later Buddhist texts like Divyavadana, Ashokavadhana, Mahavamsa and Deepavamsa.
But all the information from Buddhist texts can’t be accepted at face value because these books tend to exaggerate the accomplishments of Ashoka as he was their patron.
1.5 Jaina Texts
Jaina text named ‘Parisisthaparvan‘ by Hemachandra throws light on the early life of Chandragupta, the conquest of Magadha, his conversion to Jainism and famine during the later part of his reign.
1.6 Patanjali’s Mahabhashya
It was written in the last phase of the Maurya Period.
Mahabhashya is a major commentary on Panini’s Grammar by Patanjali.
1.7 Mudrarakshasa
Mudrarakshasa is a 5th-century historical drama written by Vishakhadatta.
It revolves around a clever plot of Chanakya against Rakshasa, minister of Nanda.
In the drama, Vishakhadatta referred to Chandragupta as ‘Vrishala’ and ‘Kulahina’ which means he was a person of humble origin.
But the historicity of this drama remains uncertain.
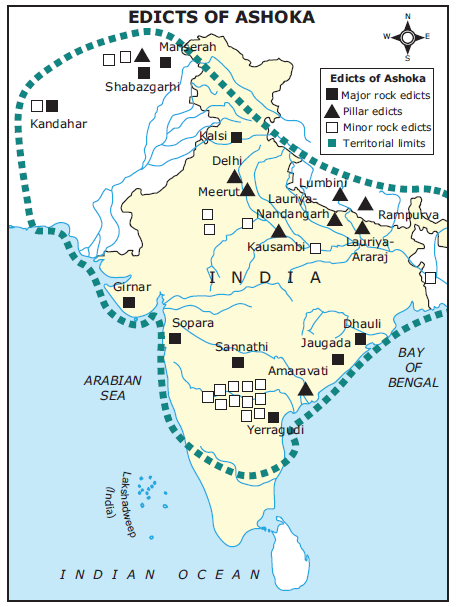
2 . Ashoka’s Inscriptions
There are 14 Major Rock Edicts, 7 Pillar Edicts and some Minor Rock Inscriptions.
– Delhi (originally located at Topara near Ambala) – Meerut – Kausambi – Lauriya Araraj – Lauriya Nandangarh – Rampurva – Lumbini / Rummindei – Amravati
Minor Rock and Minor Pillar
They were many but had an unusually large concentration in Deccan.
The geographical
spread of the edicts essentially defines the extent of the vast empire over
which Ashoka ruled.
What do these inscriptions contain
Explanation of Dhamma.
King’s efforts to propagate it.
Own assessment of his success in doing so.
His allegiance to Buddha’s teachings & a close relationship with Sangha.
They also offer insights into Ashoka’s idea about his role as king, his administration and various social & economic aspects.
Content of Rock Edicts
1st Major Rock Edict
Prohibition of animal sacrifice.
2nd Major Rock Edict
Related to measures of social welfare.
3rd Major Rock Edict
Respecting one’s parents.
4th Major Rock Edict
Impact of Dhamma, Non-violence towards animals.
5th Major Rock Edict
Appointment of Dhamma-Mahamattas to spread Dhamma.
6th Major Rock Edict
Welfare measures of efficient administration.
7th Major Rock Edict
Peace, the balance of mind, faith and tolerance.
8th Major Rock Edict
Details of Bodhi tree.
9th Major Rock Edict
Ceremony of Dhamma.
10th Major Rock Edict
Ashoka’s desire to popularize Dhamma.
11th Major Rock Edict
Appraisal of Dhamma and Religious tolerance.
12th Major Rock Edict
Promoting religion of different faith.
13th Major Rock Edict
Kalinga’s destruction and mention of Greek rulers.
14th Major Rock Edict
Nature of all other rock edicts.
Language and script used in Inscriptions
These inscriptions
were written in
Prakrit Language and Brahmi Script
Most of the scripts found in India.
Prakrit Language and Kharosthi Script
North-western regions (like Manshera and Shahbazgarhi).
Aramaic Language and Greek Language (bilingual)
Lampaka and Kandahar.
Aramaic Language and Aramaic Script
Laghman and Taxila.
Mystery of name Devampiya & Priyadarsi
James Princep decoded Brahmi script but the mystery remained regarding the king to which these inscriptions were referring. Name Ashoka doesn’t appear in the inscriptions. Ashoka was mentioned as Devampiya (beloved of Gods) & Priyadarsi (pleasant to behold).
This mystery was solved when a minor edict at Masaki (Karnataka) was found containing the personal name of Ashoka along with the prefix Devampiya and Priyadarsi.
3 . Archaeological evidences
The remains of the palaces of Chandragupta have been excavated at Kumrahar and Bulandibagh.
Number of caves of Mauryan
period have been found in the ranges of Barabar Hills and Nagarjuna.
Stupas have been found at
Banaras, Prayag, Kannauj etc. which were built during Mauryan period and
give us detailed information on the
religious condition during the Mauryan period.
Middle & late Northern Black Polished Ware
(NBPW) pottery belong
to Mauryan period .
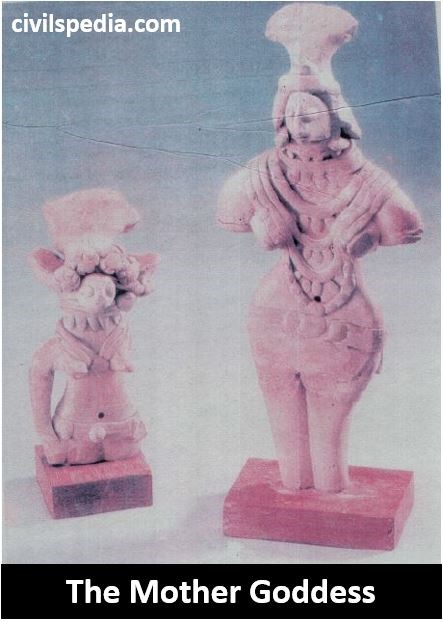
Statues like that of a woman
at Besnagar and the elephant statue at Dhauli reveal an indigenous
technique in sculpture during the Mauryan times.
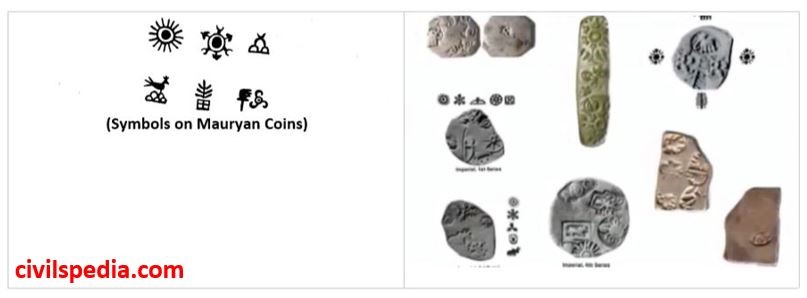
4. Numismatic Evidence
‘Punch marked coins’ were in circulation during the Mauryan period. They do not bear the name of any ruler nor carry any date. But they were issued by a central authority indicated by the uniformity of symbols used.
These punched marked coins have been found at Atranjikhera, Sanchi, Patna, Hastinapur, Taxila, Tripuri and Sarnath.
Controversy about the origin of Mauryas
According to various sources, the origin of Mauryas was as follows
Buddhist books like Digha Nikaya, Mahavamsa and Divyavadana
Belonged to the Kshatriya clan called Mauryas who ruled Pippalivana.
Parishishtaparvan
Chandragupta was the son of the daughter of the chief of a village of peacock tamers.
Mudrarakshasa
Refers Chandragupta to be belonging to a low caste.
Dundiraja
(Commentator of Vishnu
Purana)
Chandragupta was the eldest son of Nanda king Sarvarthasiddhi by Mura, daughter of a hunter.
Vaishya
Origin theory
Following facts point towards the fact that Mauryas were Vaishyas 1. Name ending ‘Gupta’ in Chandragupta’s name. 2. Asoka’s marriage to the daughter of a merchant of Vidisha.
Kings of Mauryan Empire
1 . Chandragupta Maurya (324 -297 BCE)
Chandragupta Maurya had ruled during the period of 324-297 BCE.
Chandragupta, with the help of Chanakya, defeated the last Nanda King and captured his empire. In this, Chandragupta took the advantage of the disturbances caused by the invasion of Alexander and his sudden death in 323 BCE in Babylon. With the help of Kautilya, Chandragupta raised a large army
First of all, Chandragupta launched campaigns against the Nandas.
Later, he shifted his concentration against Indo-Greek Governors / Kshatrapas ruling over north-western India.
In 305 BCE, he defeated the army of Seleucus Nikator who was ruling the eastern part of Alexander’s empire after his death. After the defeat of Seleucus, a treaty was signed between Chandragupta Maurya and Seleucus Nikator under which territories of Kandahar, Kabul, Herat and Baluchistan was given to Chandragupta. Chandragupta presented 500 elephants to Seleucus. Apart from this, a matrimonial alliance was also signed and Seleucus married his daughter to Chandragupta Maurya. An ambassador named Megasthenes was also sent to the court of Chandragupta Maurya.
Chandragupta expanded his empire westward as far as Gujarat corroborated by the Junahgarh / Girnar inscription.
Detailed information about the rule of Chandragupta Maurya is obtained from Kautilya’s Arthashastra. Kautilya was the Prime Minister of Chandragupta Maurya and is considered the real architect of the Mauryan Empire.
Megasthenes came in the court of Chandragupta Maurya as an ambassador of the Seleucus Nikator (an Indo-Greek King).
The “Sandrakottus” or “Sandrakoptus”, mentioned in the Greek literature has been identified as Chandragupta Maurya.
According to Plutarch, he had an army of 600,000.
According to Jaina tradition, Chandragupta Maurya abdicated his throne and retired to Shravanabelagola in Karnataka with his teacher Bhadrabahu (Jain ascetic) where he committed Sallekhana.
More about Chanakya
Chanakya = renowned teacher at Taxila University.
He saw Chandragupta when he was passing by his village. He was attracted by his personality and trained him for 8 years for war against Greeks & overthrowing Dhanananda. Earlier, Dhanananda insulted Chanakya when he approached him for help against the Greeks.
Contemporary Jain and Buddhist texts hardly have mention Chanakya. But popular oral tradition ascribes the greatness of Chandragupta and his reign to the wisdom and genius of Chanakya.
Chanakya, also known as Kautilya and Vishnugupta, was a Brahmin and a sworn adversary of the Nandas. He is credited with having devised the strategy for overthrowing the Nandas and helping Chandragupta to become the emperor of Magadha.
He is celebrated as the author of the Arthashastra, a treatise on political strategy and governance.
His intrigues and brilliant strategy to subvert the intended invasion of Magadha is the theme of the play, Mudrarakshasa.
2 . Bindusara (297 – 273 BCE)
He was the son of Chandragupta Maurya and ascended the throne after his father.
He is also known as ‘Amitraghata’ in Indian texts or ‘Amitrochates’ in Greek texts.
According to Tibetan historian named Taranath and Jain scholar named Hemachandra, Chanakya continued as the minister of Bindusara after the death of Chandragupta Maurya as well.
During his reign, a revolt broke out in Taxila. Ashoka was sent to suppress the revolt and restore peace.
Greek Texts refer to his diplomatic relations with western kings.
Antiochus (king of Syria) sent an ambassador named Deimachus to his court.
Ptolemy II (ruler of Egypt) sent an ambassador named Dionysius.
Famous Story: Bindusara requested Antiochus (king of Syria) to buy & send some sweet wine, dried figs & sophist (philosopher specialised in debate & argumentation). He sends wine & dried figs & replied that Greek laws didn’t permit sophist to be bought.
He died in 273 BCE.
3. Ashoka (273 / 269 – 232 BCE)
There is a general agreement that Ashoka was not the crown prince (Yuvaraja). He sat on the throne after winning 4 years-long war of succession following Bindusara’s death.
According to various texts, Susima was the crown prince but Ashoka was supported by Ministers especially Radhagupta. Ashoka killed 99 brothers sparing only one named Tissa.
During Bindusara’s reign
He served as a Viceroy at Ujjain and also at Taxila.
He was sent to Taxila to quell a revolt.
In Ujjain, he married the daughter of the merchant of Vidisha. Two children i.e. Mahinda and Sanghamita were born out of this union. His stay at Ujjain is described in the Sri Lankan chronicles as his son Mahinda introduced Buddhism in Sri Lanka.
Until hundred years ago in India, Ashoka was merely one of the many kings mentioned in the Mauryan dynastic list. In 1837, James Princep deciphered an inscription written in Brahmi but King was referred to as Devampiya Piyadassi (the beloved of the gods, pleasant to behold). We came to know about Ashoka in 1915, from Masaki Edict where King calls himself Devampiya Ashoka.
Kalinga War and its impact
Rock Edict XIII describes the horrors and miseries of the Kalinga war.
Although Ashoka’s predecessors brought Deccan and South under control Kalinga was still outside Mauryan control.
Kalinga had strategic importance as it controlled the routes to South India both by land and sea.
Kalinga war took place eight years after Ashoka’s consecration.
According to the inscription, one lakh people were slain in the war. These figures are likely to be exaggerated, nevertheless, war was very devastating. Although on the battlefield Asoka, was victorious, the inscription goes on to describe his remorse. The violence of the war completely changed the personality of Ashoka and he left the policy of aggression. The policy of conquest through the war was given up and replaced by a policy of conquest through Dharma/Dhamma i.e. Dhammavijaya.
Ashoka and Buddhism
Ashoka had close connection with Buddhism . Buddhist tradition considers him exemplary king & devout Upasaka .
His generosity as patron of Sangha is reflected in following things
He is credited with redistributing relics of Buddha & enshrining them in stupas in important towns .
84,000 Stupas were built by him .
He undertook pilgrimage to all major places connected with Buddha’s life .
Ashoka was ardent follower of Buddha’s teachings
He had position of influence
vis-a-vis Sangha .
In Bairat Edict , Ashoka greets Sangha & profess his deep faith in
Buddha , Dhamma & Sangha .
Schism Edict warns members of the order against
causing any division in the
ranks .
Rummindei & Nigali Sagar
inscriptions point towards fact that
Ashoka visited Lumbini & announced tax concessions .
Ashoka in
Buddhist texts
Buddhist texts
present Ashoka as vile & evil man until he came under influence of
Buddha’s dhamma & represent Ashoka’s following of Buddhism as sudden
transformative event .
Ashoka & 3rd Buddhist Council
According
to Theravada
Chronicles, Ashoka convened great
(3rd) Buddhist council in 250 BCE at Pataliputra presided by Moggaliputta Tissa in order to purge Sangha of certain
unacceptable practices .
An important outcome of this
Council was the decision to expand the reach of Buddhism to other parts of
the region and to send missions to convert people to the religion.
Buddhism thus became a proselytizing religion.
Buddhist
Missions by Ashoka were sent to following places
Sri
Lanka
Mahinda and
Sangamitta (son and daughter of Ashoka).It is believed that they took
a branch of the original bodhi tree to Sri Lanka.
Suvarnabhumi
(South Easy Asia)
Under
Sona
Himalayas
North
West
Central
India
Ashoka’s Dhamma
Contents
of Dhamma were selected in a way that it should
be acceptable to majority of people of different communities .
It stressed on
Showing consideration towards
slaves and servants .
Obedience to elders .
Generosity towards needy Brahmanas and Sramanas.
Tolerance of different religious sects to create harmony.
Non-violence was to be practised by giving up war and
conquests and restraint on killing
of animals.
Welfare measures, like planting of trees, digging of wells,
etc.
Attack on ceremonies and
sacrifices practised regularly on various occasions like birth,
marriage etc .
Officers
known as Dhamma
Mahamattah were instituted to implement & publicise various aspects of Dhamma.
Interpretations of Dhamma
Ashokan policy of Dhamma has
been issue of debate &
controversy .
Buddhist
records credit him with the propagation of Buddhism in India and abroad.
But one cannot, however, lay the charge of being partisan against Ashoka.
There are two strong arguments
to prove that Ashoka, as an Emperor, did not favoured Buddhism
at expense of other faiths.
Creation of institution of Dhammamahamattas – Had it been to promote Buddhism ,
organisation of Sangha could be used to
propagate Dhamma.
Careful study
of Rock Edicts depicts that Ashoka wanted to promote tolerance & duty of Dhammamahamattas included working for
the Brahmanas and the Sramans.
Some historians believe that
Ashoka’s banning
of sacrifices and the favour that he showed to the Buddhists led to a Brahmanical reaction. This in turn led
to the decline of the Mauryan Empire (HC RAYCHAUDARY) .
Others believe
that the stopping
of wars and emphasis on non-violence crippled the military might of the Empire.
This led to the collapse of the empire, after the death of Ashoka.
It has been shown
by Romila Thapar that Ashoka’s
Dhamma, apart from being a superb document of his essential humaneness was
also an answer to the socio-political needs of the contemporary situation.
That it was not
anti-Brahmanical is proved by the fact that respect for the Brahmanas and
Sramans was an integral part of his Dhamma.
His emphasis
on non-violence did not blind him to the needs of the state. Thus,
addressing the forest tribes he warns
them that although he hates to use coercion he may be required to resort
to force if they continue to create trouble.
By the time Ashoka stopped war, the entire
Indian sub-continent was under his control. In deep
south he was on friendly terms with the Cholas and Pandyas. Sri Lanka was an
admiring ally. Thus, Ashoka’s no to war came at a time when his empire had
reached its natural boundaries.
4. Post Ashoka rulers
The subsequent history of the
Mauryas under his successors is very inadequately known. This is because a
state of disintegration seemed to have set in immediately after Ashoka’s
death.
The tenth and the last of the
Mauryas was Brihadratha who was murdered by his general Pushyamitra
and who ascended the throne in 187 BCE. The empire founded by him is known
as Sunga Dynasty.
With Brihadratha’s death (187
BCE) this historic rule of the Mauryas came to an end within less than
half a century of Ashoka’s death and 137 years since its foundation by
Chandragupta Maurya.
Polity and Administration of Mauryan State
Mauryan state was
an Empire. Empire is a
political system which has vast
expanse of territories under it’s control, not all of which is culturally
homogeneous . They are different from the Kingdoms in following
ways :-
Kingdoms draw maximum profit from existing
resources and do not make attempt
at restructuring access to resources.
Pressures on the Empire are many as
administrating a large empire with vast administrative machinery requires
huge financial resources . According to the Arthasastra, the salary of
chief minister, the purohita and the army commander was 48,000 panas, and
the soldiers received 500 panas. If we multiply this by the number of
infantry and cavalry, we get an idea of the enormous resources needed to
maintain the army and the administrative staff. Hence, Empires try to
restructure economy in order to increase the revenue base of the state .
Mauryan Empire tried to
increase their revenue base by
Extension of agriculture
Setting new cities
Promoting trade
Although they
rarely succeed, Imperial Systems
attempt to erase variation in favour of homogeneity . Ashoka’s
dhamma was an attempt to bring homogeneity .
1 . Central Administration
King
Maurya Empire was a Monarchy
with king as Supreme authority .
He took all important
decisions concerning the empire.
He was assisted by a council
of ministers who acted as the king’s advisors.
King started to have paternal
attitude towards his
subjects. In the Dhauli inscription Asoka states , “All men are
my children and just as I desire for my children that they should obtain
welfare and happiness both in this world and the next, the same do I
desire for all men.”
By adoption of the title Devanampiya (beloved of the Gods) by Asoka; according to Romila
Thapar, “an attempt was made to emphasize the connection
between kingship and divine power.”
Council of Ministers
Arthashastra & Ashokan inscriptions mention Council of Minister. Megasthenes also mentioned
SUMBOULAI
.
Arthashastra quotes that it
was impossible for King to rule single handedly (like Single Spoke cant
turn wheel) .
Primary role
of Council of Minister was that of an advisory body. Final authority was vested with the King.
We do get references about 18 departments of the central government in the
Arthasastra.
2. Regional Administration
After its territorial
expansion , state established administrative control at the Provincial and
Local Levels.
Provincial Administration
Each province
was headed by – Kumara (Royal
Prince) , who was
King’s representative in Province .
Eg Ashoka was Kumara of Ujjain & Taxila .
Kumara was assisted by Mahamatyas & a Council of
Ministers.
From Asokan edicts
– names of four
provincial capitals were
Tosali (in the east)
Ujjain (in the west)
Suvarnagiri (in the south)
Taxila (in the north)
District Administration
Province was further divided
to Districts .
Officials listed at the level
of district during this period were
Pradeshta (overall incharge of
district),
Rajuka : Survey of lands (rajuka derived from rajju,
meaning rope)
Yukta
King was in direct
touch with these officers. In the 4th Pillar Edict -Ashoka grants to the
Rajuka “independent
authority” to carry out some of his instructions in relation to public
welfare.
Village Administration
Local people were involved in
the Village Administration.
Village head was known as Gramani. He was assisted by Gram Sabha .
Apart from that, there were
intermediaries between district and village administration . These were Gopa
(administer 5-10 villages) and Sthanika (administers 800 villages) .
3. City Administration
City Administration according to Megasthenes
Megasthenes
has described administration in Palibothra (Patliputra).
According to Megasthenes, there was 30
membered city council divided into six committees of 5 members each to administer city. These were
3rd Committee looked after registration of births and deaths.
4th
Committee looked after inspection of weights and measures .
5th Committee looked after inspection of manufactured goods .
6th Committee collected taxes on goods sold at rate of
1/10th.
City Administration according to Arthashastra
No mention of such committees is found in the Arthashastra . But reference of equivalent Officers in Arthashastra were present . Eg :
Work of 4th committee was performed by Pautavadhyaksa .
Collection of taxes (Sixth Committee) was performed by Sulkadhyaksha .
According to Arthashastra
Head of the urban administration was Nagariaka.
He was assisted by two subordinate officials called Gopa and Sthanika.
Law enforcers in the city were called Rakshina .
4. Army
Retreat of Seleucus, descriptive account of army administration in Arthashastra and the violent Kalinga war point towards a large and well organized military of Mauryas.
According to Pliny’s account , Chandragupta’s army consisted of 9,000 elephants, 30,000 cavalry and 6,00,000 infantry.
According to Megasthenes
There were 6 Branches of army – infantry, cavalry, elephants, chariots, transport & admiral of fleet .
Each branch was looked after by a committee of 5 members.
Kautilya has referred to Chaturangabala (i.e. infantry, cavalry, chariots and elephants) as the main components of the army –each under a commander . Eg
Rathadhyaksha headed chariots .
Hastyadhyaksha headed elephant force.
5. Espionage System
Espionage was important part
of Mauryan Administration.
Main tasks of
the spies recruited involved:
Keeping an
eye over ministers
Reporting on
government officials
Collecting
impressions regarding the feelings of citizens
Know the
secrets of foreign rulers, etc.
Arthashastradivided Spies (Gudhapurusha) into three type
Samsthan
Positioned at
one place
Sanchara
Roamed about
Ubhayavetana
Doubly Paid
6. Law & Justice
Arthasastra is full of codes listing punishments for various offences.
There
were various kinds of courts to settle disputes at various
levels.
Gramani
Had judicial powers at village level .
Dharmasthiya
Courts to decide civil cases .
Kantakasodhana
Courts to decide criminal cases.
Kanhkmaba
Courts which decided upon matters related to
individuals and the state.
Punishment
for crimes range from fines to mutilation of limbs to death.
Ashokan
edicts mention that each 5th year king would despatch a gentle officer , neither
fierce nor harsh on a tour to ensure
that justice was being done
.
7. Revenue Administration
According to Arthashastra
, different resources from where
revenue flowed into the state treasury (Kosa) were rural areas, cities,
roads , pastures , plantations, forests and mines.
Tax on agricultural produce
constituted the most important source of revenue. Usually, the king was
entitled to one-sixth of the produce.
Kosa/ Treasury was
looked after by an official Sannidhata (Chief Accountant)
.
The state was also empowered
to impose taxes in case of emergency for increasing its earnings.
King had the
right of granting remission of land revenue as Ashoka reduced the Bhaga of the village
Lumbini to 1/8
and scrapped Bali altogether.
8. Public Works
State took keen interest
in public works. Account of
Megasthenes and Arthasastra corroborate
this
Irrigation : Tanks like Sudarshan Tadaga in
Junahgarh .
Medical facilities were available to both men
and animals.
State also helped its citizens
during natural calamities like floods, famines, etc.
Laying down and
repair of roads
and opening of inns.
Society in Maurayan Empire
Arthashastra
recommended 4 fold varna
system in society but how far that was followed is debatable.
Eg : Pushymitra Shunga
, a Brahmin who overthrew Mauryan Empire was Commander in Chief of Mauryas
.
Megasthenes divided Indian people into 7 strata i.e. Philosophers, Farmers, Herdsmen
& Hunter, Artisans & Traders, Soldiers, Overseers & King’s
Counsellors . It
seems Megasthenes’s own creation although it is possible to be
modelled on Herodotus’s classification of Egyptian society into similar 7 strata.
Untouchability
There was significant hardening
of Brahmanical position on untouchability .
Well of Chandalas could only be used by them &
none else .Chandalas were known as
Antavasayin
(living at end) suggesting that they lived on margins of settlement .
Women
There reference of king’s women bodyguard in Arthashastra .
Women were also employed
by the state as spies and performers.
Women of the upper
castes who had become widowed, deserted wives or ageing prostitutes could get work
from the state, such as spinning yarn .
Female ascetics were known, but were few and far between .
Kautilya in
his Arthashastra argued that prostitutes
should also be taxed .
Surprisingly, there is no mention of either varna or jati in the Ashokan edicts, which may
suggest that they were not yet so prominent as social categories.
Tensions in
Society
Ashoka’s emphatic plea for social harmony and repeated calls for equal respect towards brahmans and shramanas suggest that there were social tensions.
Economy during Mauryan Times
1. Agriculture
Mauryan State was producing substantial
agriculture surplus because of use of iron
in agriculture started and
start of paddy cultivation in North India
.
The Greeks noted with wonder
that two crops could be raised annually in India because of the fertility
of the soil.
Due to growth
in agriculture, cultivator assumed
important role. Megasthenes in his seven classes
mentions the farmers as the second class suggesting it was numerically
large class .
Essential
resources needed for Mauryan State could
only be got from land revenue. Hence, Arthasastra is careful in designing efficient
revenue system of the State.
Bhaga
– King’s share of produce . – Levied at the rate of 1/6th of the produce.
Bali
– Tax on the area of land cultivated .
Udaka Bhaga
– Water tax if irrigation facility of state is used . – 1/6 to 1/3 of produce
Lumbini(Rummindei) Edict states that when Ashoka visited
Lumbini i.e. birthplace of the Buddha, he exempted payment of Bali and reduced the payment of Bhaga to 1/8. Even Asoka’s great respect for the Buddha did not prompt
the emperor to exempt the village totally from the payment of taxes.
State took steps to provide Irrigation . Eg: Pushyagupta, governor of Chandragupta Maurya, built a dam in Girnar (Saurashtra) known as Sudarshana
tadaga (water tank).
2. Trade & Urban Economy
Mauryan state
wanted to expand trade and commerce . For this, they established new state
founded walled towns and markets .
Improved Transport
River transport was improved because forests
around the Valleys were cleared .
There was an officer called Agronomoi whose function was to maintain
Royal Road and
put distance markers after every 10 Stadia (10 Stadia = 0.5 Mile) .
State Control on Trade
The sale of
merchandise , in
theory, was strictly supervised. Goods were required to be stamped (to distinguish
between the old and the new) .
According to Megasthenes , tax was one-tenth of the sale proceeds and failure to pay this tax
was punishable with death.
Arthashastra recommends appointment of following officers
related to Trade
Panyadhyaksha
: Superintendent of Trade to fix price of goods
Pautavadyaksha :
Superintendent of weights and measures
Navadhyaksha : Superintendent
of State boats
Sulkadhyaksha :
Superintendent of taxes , tolls and custom dues
Mining
According to Arthashastra, State enjoyed a monopoly in mines
and trade in mineral products.
Arthasastra provides for a superintendent of mines called Akara-dhyaksha – to look for
new mines & reopen old ones.
Causes of Decline of Mauryan Empire
Ashoka ruled for thirty-seven years and died in about 232 BCE . Subsequently, a political decline set in and the empire began to break up. The last of the Mauryas, Brihadratha, was assassinated during an inspection of the troops by the brahman Pushyamitra, the commander of the army. Pushyamitra founded the successor Shunga dynasty .
1 . Role of Ashoka
Debate 1: Revolt of the brahmans because of his pro-Buddhist policy ( by HP Shastri)
But this can be challenged because
His general policy was not an active proselytizing in favour of Buddhism at expense of Brahmanism.
Respect to both brahmans and shramanas was part of Ashoka’s Dhamma.
Buddhism’s more extensive spread happened in post Mauryan Period due to patrons in form of Mercantile Community and not due to Ashoka.
Debate 2 : Pacific policy of Asoka (by HC Raychaudhary)
It is argued that his obsession with non-violence led to the
emasculation of army, laying the
country open to invasion.
But
Edicts prove that this was not the case. His open threat to Tribals to
mend their ways otherwise they would be crushed & his advice to his
sons and grandsons on the use of violence prove that army was still
powerful .
However, a long reign marked by only one military campaign in the
early years may have adversely affected the preparedness of the army,
and this may have been a factor responsible for the success of the Greek
invasions.
More probable reasons are to be found elsewhere.
2. Pressure on Mauryan Economy (By DD KAUSAMBI)
There
was need for vast revenues to
Maintain large army
To finance the salaries of upper levels of bureaucracy
Cost of establishing settlements on
newly cleared land
This strained the treasury.Debasement of silver coins in later Mauryan period shows severe
pressure on economy and lack of
resource to maintain the structure .
3. Structure of Mauryan Administration (By Romila Thapar)
Mauryan bureaucracy was centralized, with the ruler – or king – as the key figure towards whom
loyalty was directed. A change of
king meant a re-alignment
of loyalty .
Recruitment
was arbitrary, with local governors choosing their officers hence, there was possibility of particular social groups
monopolizing administrative control in certain areas .
Lack of
representative institutions to stabilize public opinion . They used espionage to stabilise public opinion
which must have created manifold tensions in the administration.
4. Invasions in North-West
After the demise of Ashoka, North-West saw invasion by Bactrian Greeks (because they were pushed by Parthians & Scythians) which destabilized the Empire .
Absence of nationalism, the idea of loyalty to the state rather than to a particular king, and the lack of popular representative institutions and absence of Chinese-type examination system in Maurya India are not very helpful in explaining the decline of the Maurya empire.
All
empires rely on mechanisms of integration and control over territory,
resources, and people. These
mechanisms include military force, administrative infrastructure, and ideology.
In the case of the Mauryas, given the vast contours of the empire, all three
must have been strained to their utmost. It was just a matter of time
before the distant provinces broke away from the centre.
This article deals with ‘Persian and Macedonian Attacks’ . This is part of our series on ‘Ancient History’ which is important pillar of GS-1 syllabus . For more articles , you canclick here.
Persian Invasions
In 6th Century, Persian empire extended upto north-western borders of
subcontinent .
Greek historian Herodotus mentions that India (Indus Valley) was the 20th &
most prosperous satrapy of Persian empire & tribute from province was more
than tribute from all other provinces put together .
Cyrus
He was the founder of
the Achaemenid
Empire in
Persia .
He invaded Indian
borderland and captured the Gandhara region.
Darius (522 – 486 BCE)
Darius
I (522-486 BCE) made the real
advance in India. He invaded India and occupied the territories in the North-Western
Frontier Province, Sind and Punjab . These parts remained with the Persian
Empire till Alexander’s invasion of India.
According to
Herodotus (historian) , Gandhara formed the 20th satrapy of the empire of
Darius paying a tribute of 360 talents of gold dust. It was the most fertile and populous
province of the Achaemenian Empire. Herodotus has also recorded that
Darius sent a naval expedition probably in 517 BCE to explore the Indus
basin.
Xerxes
Xerxes kept the control of
Indian possessions but due to
requisitioning of large number of troops for invasion of Greece, failed to
make any advances in India.
Xerxes
suffered defeat in Greece which led to the decline of Persian Empire . However, the Achaemenid rule over India continued up to 330 BCE . In that year Darius
III, the last of the Achaemenid ruler summoned Indian troops to fight
against Alexander . With the fall of the Persian power under the impact of
the invasion of Alexander the Great, the Persian hold over India was lost.
Impact of Persian Invasions on India
Political Impact
India
learnt the necessity
of a strong and united empire to repel the foreign invasions and
realized how essential it was to join hands together to meet the common
enemy.
Encouragement to trade
The Persian rulers did much
to promote geographical exploration
and promote trade. The exploration of
the Indus and the Arabian Sea by Scylax opened a new water-route.
Settlement of Foreigners on Indian Soil
A
large number of foreigners, Greek, Persians
etc. settled down in the North-Western parts of India. With the
passage of time they were completely absorbed among the Indians.
On Architecture
Traces of the
Persian influence can be seen in the Mauryan sculptures and in the
Ashokan pillars. The polish of the
Mauryan pillars manifests the Persian influence. Ashoka also
followed the Iranian custom of preaching ideals by inscribing them on
the stone pillars. Similarly, the pillared remains of the
Palace in Pataliputra display a remarkable similarity to the pillared
hall in the Achaemenid capital.
Kharosthi Script
The Aramaic form of writing which
the Persians introduced in the north-western India after their
conquest, gradually developed into the Kharoshti script. It was written
from right to left .
On Coinage
The Persian silver coins
were in circulation in India. This affected Indian coinage. The Persian
coins were known for their refined minting and elegant looks. The Indian rulers adopted
similar techniques to mint their coins on the Persian model.
Alexander Invasion (327-26 BCE)
In 327-26 BCE , North West Indian Subcontinent suffered the invasion
of Alexander .
Persian hold over Indian
provinces was nominal or non existent at that time . Alexander defeated
the armies of Darius III (Persian king) established various outposts in
Afghanistan & ventured into India . Greek historians make great deal
of Alexanders siege of Hill fort of
Arnos because
tradition says that even god Herakles was unable to take that .
In
326 BCE , he ventured into India after crossing Indus . Ambhi, the ruler of
Taxila, surrendered and accepted the suzerainty of Alexander. The most
famous of Alexander’s encounters was with Porus, ruler of the region
between Jhelum and Beas. The two armies met in the battle of Hydaspes
(Jhelum) in which Porus was imprisoned. Later, impressed by the Porus’s
dignity, Alexander restored his throne on the condition of accepting his
suzerainty.
Alexander captured area till
Ravi but movement beyond Beas was prevented because of resistance of his own soldiers
who were tired by many years of wars & wanted to go back .
Alexander retreated back .
Areas lying west of Punjab were entrusted with Satraps (governors) & Macedonian garrisons were placed there.
Alexander died two
years later of a mysterious fever in Babylon.
One of the results of Alexander’s invasion was creation of Seleucid
principality in North-West & establishment of several Greek
settlements in that area including Boukephala, Nikaia & several
Alexandrias .
Effects of Alexander invasion
Trade routes opened up with
the West. As trade contact increased, many Greek settlements were
established in the northwest of India. Alexandria near Kabul, Boukephala
near Peshawar in Pakistan and Alexandria in Sindh were some of the
prominent Greek settlements.
Indirectly this invasion made
possible the establishment of Indo-Bactrian and Indo-Parthian states,
which at a later stage considerably influenced Indian architecture
(Gandhara school of sculpture), astronomy, coinage etc.
The invasion opened the eyes
of Indian politicians to the necessity of creating a unified empire
The date of the Invasion of
Alexander is the ‘first reliable date in early Indian
history’ and
considerably helps in solving chronological difficulties. Greek historians
began to write about India .
This article deals with ‘Rise of Magadha’ . This is part of our series on ‘Ancient History’ which is important pillar of GS-1 syllabus . For more articles , you canclick here.
Introduction
Among the 16 Mahajanapadas, Kasi was initially powerful. However, Kosala became dominant later. A power struggle broke out between Magadha, Kosala, Vrijji and Avanti. Eventually Magadha emerged as the dominant Mahajanapada and established the first Indian empire.
Rise of Magadha under the Haryanka Dynasty
1 . Bimbisara
Bimbisara is the first known
ruler of Magadha .
He was the first ruler to
introduce matrimonial alliances for strategic purposes . He married
following
Khema
Daughter
of Madra king of Punjab
Mahakosala
Sister
of Prasenjit of Kosala & got kashi
in dowry
Chellna
Lichchhavi
Princess
He had great
army (according to Jain texts).
Bimbisara was contemporary of both Mahavira & Buddha and met Buddha 7 years before enlightenment .
Buddha visited his capital after enlightenment as he promised earlier.
His capital
was Girivraja (identified as Rajgriha)
He was killed
by his son Ajatshatru .
2 . Ajatshatru
He killed Bimbisara & Mahakosala died in shock . Her brother,
King Prasenjit took back Kashi which was earlier given in dowry . This
led
to a military confrontation between Magadha and Kosala. The struggle lasted
until Prasenjit was overthrown .
Ajatashatru also
fought and won the battle against the Lichchhavis. During this war, he sent his minister Vassakara to create dissension . He also used new
weapons named (1) Mahshilakantaka i.e. catapult to throw large stones and (2) Rathamusala (chariot with blades attached on
wheels).
On Buddha’s demise
, Ajatshatru is said to have gone to Kusinagara to claim portion of his relics . He built many stupas around Rajgriha and
organised first buddhist council
When
Immediately after
death of Buddha
Where
At hall
erected by him outside Sattapani caves in Rajgir
Presided
by
Elder
Mahakasyapa
He was also killed by his own
son Udayen .
3. Udayen
Udayen developed
Pataliputra as city .
He was killed by his own son .
Later kings
Later kings like Anurudha and Nagadaska also suffered PATRICIDE .
Hence, revolt broke and
Haryanka dynasty was thrown away by Shishunaga Dynasty
Shishunaga Dynasty
1 . Shishunaga
Shishunaga was the Governor of
Haryanka & did coup d’état.
He ruled from Girivraja &
seemed to have second capital at Vaishali
.
2. Kalashoka
During his reign Pataliputra became capital of Magadha .
He organised & sponsored 2nd Buddhist
Council
Where
Vaishali
When
383 BC
Headed by
Sabakami
Disputes
There was dispute
on 10 points
Storing salt in horn
Eating after mid day
Eating once
Going to villages for alms
Eating sour milk after one’s
meal etc
Outcomes
No consensus emerged and Buddhist sects began to appear for first time.
Last king of this dynasty was
Nandivardhana . Shaishunaga dynasty came to bitter end . King and his sons
were killed , making way for Nanda dynasty
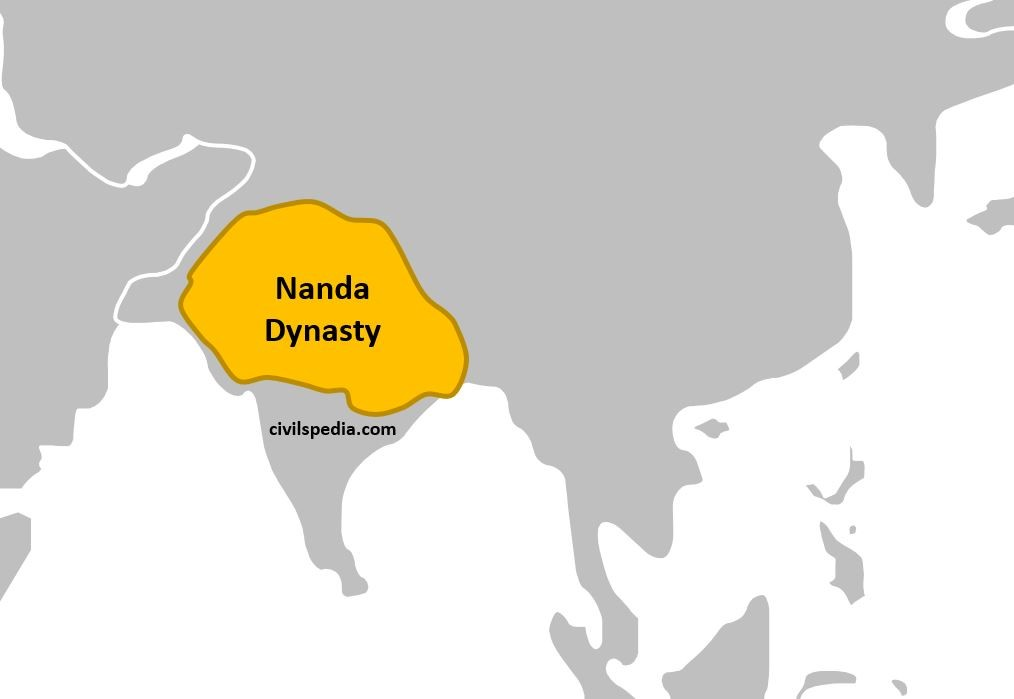
Nanda Dynasty (345-321 AD)
Puranic , Buddhist
& Jaina tradition agree that there were 9 Nanda kings . Mahapadma Nanda was succeeded by his eight
sons, and they were together known as the navanandas or the nine Nandas.
Nandas
build on the
foundations of Haryanka & Shishunaga dynasty
& emerged
as the first great empire in North India .
Nandas were thought of low
origin with some
sources stating that dynasty’s
founder, Mahapadma Nanda, was the son of a Shudra
mother.
Mahapadma Nanda = Empire Builder
Mahapadma Nanda usurped the
throne by murdering the last of the Shishunaga kings.
Mahapadma Nanda has been described in Puranas as “the destroyer of all the Kshatriyas”. He defeated many other kingdoms, including Panchalas, Haihayas, Kalingas, Asmakas, Kurus , Surasenas etc.
He is known as Ekrat (Sole king).
He conquered Kalinga . Hathigumpha inscription of Kharvela (of Kalinga) also mentions the conquest of Kalinga by Nanda.
He also expanded his territory south of the Vindhya range, into the Deccan plateau .
Mahapadma Nanda is described as the first empire builder in the recorded history of India.
He inherited the large kingdom of Magadha built by Haryanka & Shishunaga dynasty .
But he wanted to extend it to yet more distant frontiers. For this he built up a vast army. According to Diodorus and Rufus (Roman historian) , his army consisted of 2 lakh infantry, 20 thousand cavalry, 2 thousand war chariots and 3,000 war elephants.
Such was the fear of Nanda army that when Alexander invaded India (Dhana Nanda was the ruler at that time ), he confined his campaign to the plains of Punjab as his forces were frightened by the prospect of facing Nanda army & mutinied at Hyphasis River (the modern Beas River) .
Reasons why Magadha emerged as strongest of all Mahajanapadas
In Republics of North-eastern India (Malla, Vajji) , there was no centralisation due to common ownership of land by the kshatriyas . On the other hand, in the Monarchies of upper Ganga , Vedic sacrifices led to wasteful consumption . Magadha located in the mid Ganga plains had no such limitations.
Magadha had the advantage of
Rich soil & history of rice cultivation .
Good rainfall, irrigated land and bandhs used as water reserves .
It was close to the mines and minerals of Singhbhum .
Forest of Rajmahal hills for procuring timber and elephants.
Geographical Position
Old capital Rajgriha was surrounded by perimeter of 5 easily defendable hills .
New capital Pataliputra was protected due to location at Ganga & Son .
Both Uttarapatha & Dakshinapatha passed through Magadha leading to high volumes of trade . River Ganges which flowed through the heart of Magadha was the high route of trade .
Due to foreign invasions like
Achaemenians in 6th century B.C
Macedonians in 4th Century B.C.
infiltration of foreign races
Demands started to raise that there was need of central paramount power on the subcontinent to defend it from foreign invasions. It prepared the country to submit to Magadhan hegemony.
An unbroken chain of very able and extraordinary monarchs ascended the Magadhan throne like Shishunaga, Bimbisara, Ajatasatru, Mahapadma and Chandragupta . They were fortunate in having great ministers and diplomats like Vassakara, Kautilya and Radha Gupta .
This marks the end of our article on topic ‘Rise of Magadha.’
This article deals with ‘Mahajanapadas’ . This is part of our series on ‘Ancient History’ which is important pillar of GS-1 syllabus . For more articles , you canclick here.
Introduction
During
this period , people began to settle on lands and started to
call certain areas to be their own
. Hence, Janapadas emerged .
Kings, Monks and monarchs emerged on the stage of history.
This was the age of intense
philosophical speculation . Buddhism, Jainism and many
other heterodox sects emerged as well.
Sources of Information
1 . Literary Sources
Literary sources
include
Brahmanas: Brahmanas (eg Shatapatha Brahmana) are the category of Vedic texts which deals with the methods of performing Vedic rituals.
Puranas:Puranas provide useful dynastic history .
Upanishads: Upanishads deal with the philosophical problems of the period and were composed 800 BCE onwards.
Buddhist Texts : Sutta Pitaka and Vinaya Pitaka were composed during this period and they give us graphic descriptions of the contemporary society.
Ashtadhayayi: It is the book on Sanskrit grammar written by Panini in 5th-4th century BCE. Panini mapped out the grammatical rules as it existed in his time . His book became landmark in history of Sanskrit from Vedic Sanskrit to Classical Sanskrit . Ashtadhayayi is work of grammar but in order to illustrate the rules of grammar , Panini referred incidentally to many aspects of his time – places, people, customs, institutions, coins, weights & measures .
2. Archaeological sources
Iron objects such as hoes,
sickles, knives, hooks, nails, arrowheads, vessels and mirrors confirm the
widespread use of iron technology.
Northern Black Polished Ware (NBPW) is the characteristic pottery
of this period.
Textiles, beads,, ivory
objects, ceramics and glassware and artefacts of other metals are found.
A large number of terracotta
artefacts have also been found.
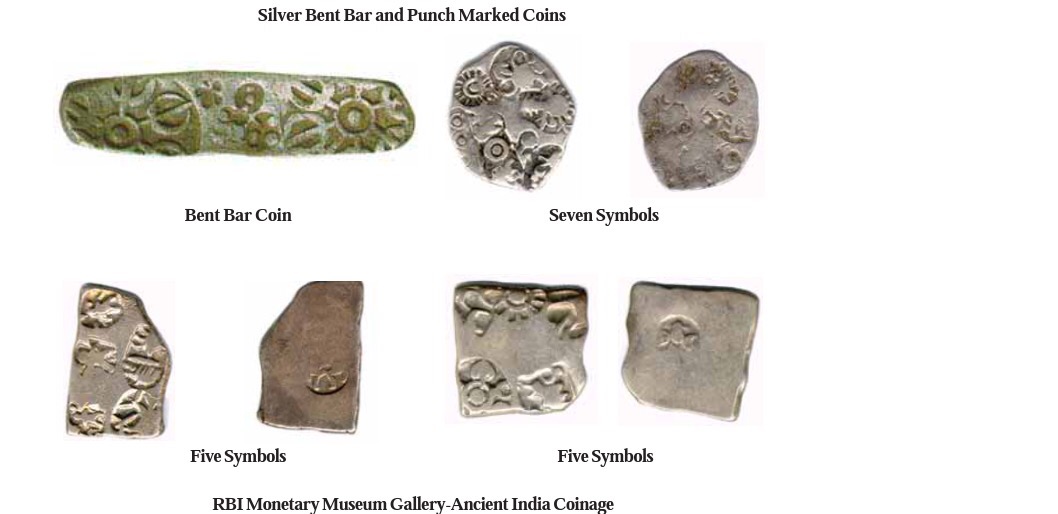
Sites belonging to this period include series of punch marked coins which
marked use of money in subcontinent .
Developments in the Gangetic Plains
Development of Agriculture
Agriculture improved during
this phase in the middle Gangetic plains creating the necessary surplus as
Wet rice cultivation began to
yield more produce of rice than other crops.
Iron technology also played a
crucial role.
Reasons for improvement of
agriculture were
Use of Iron
Iron axes could be used to clear
forests and iron
plough shares
could facilitate agricultural operations.
Iron ploughshare increased
the productivity of land .
Practice of wet rice cultivation
This was especially useful
in the Middle Gangetic Valley. Wet
rice cultivation is substantially higher than those of wheat or millet in
traditional agriculture, leading to creation of large surplus .
Rise of Organised State
State helped in establishment of new
settlements by shifting surplus
population from overpopulated areas, providing cattle, seed, money
and irrigational facilities and providing remission of taxes and other
concessions to peasants in new establishments
Role of Buddhism
Buddhism was against sacrifices . It
insisted on the protection of cattle and preservation of cattle wealth for
agricultural purposes was encouraged .
Leisure time provided by
agricultural surplus and technology led to growth of crafts, which in turn
aided vibrant trade.
Second Urbanisation
Agricultural surplus, the growth of crafts and trade, and the growing population led to the emergence of towns in the Gangetic plains. This is called the second urbanisation in Indian history after the first urbanisation evident in the Harappan Civilization.
Mahajanapadas
The Later Vedic period
(1000–600 BCE) witnessed the transition from a tribal polity based on
lineage to a territorial state. The
loyalty of the people shifted from
Jana (tribe or clan) to Janapada (territory). The Janapadas fought
with one another for resources and political dominance. Some Janapadas
extended their territories and brought various Janas within their
jurisdiction. Such Janapadas grew into Mahajanapadas .
In Mahajanapadas,
The king headed the
government aided by a centralised administration.
The king was also the
sovereign ruler.
The king levied taxes out of
agricultural surplus and redistributed it and ensured maintenance of law
and order in a hierarchical society by force and coercion.
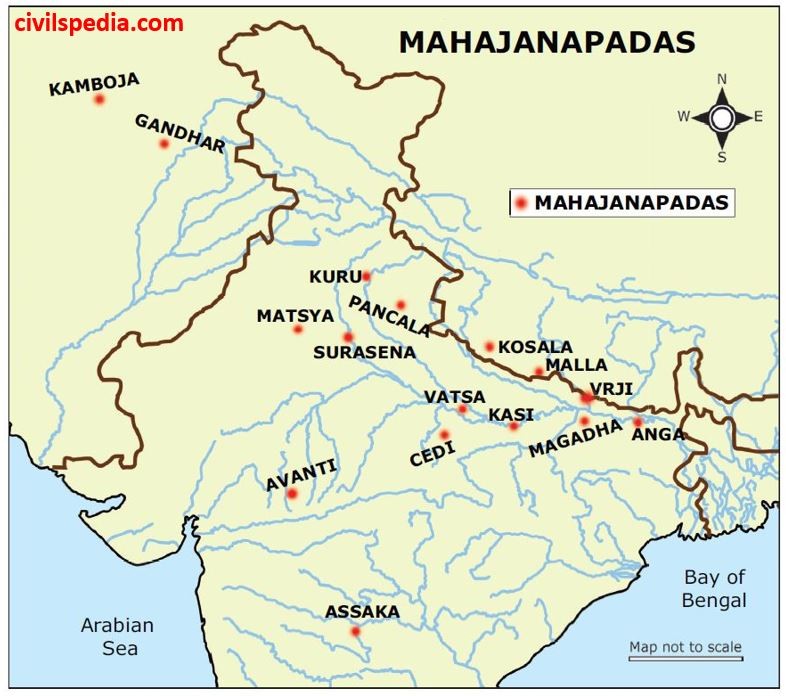
16 Mahajanapadas
According to Puranic, Buddhist
and Jaina traditions, there were 16 Mahajanapadas. These were
Gandhara
Kamboja
Assaka
Vatsa
Avanti
Shurasena
Chedi
Malla
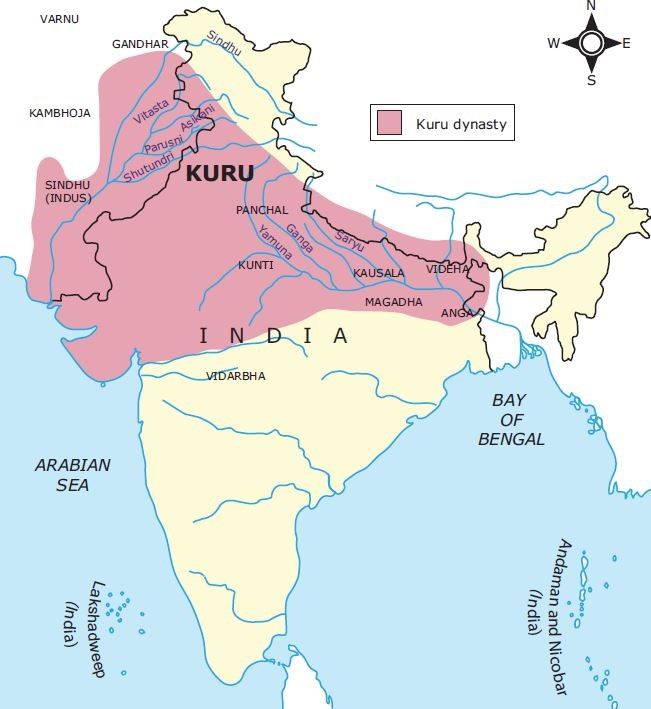
Kuru
Panchala
Matsya
Vajji (Vrijji)
Anga
Kasi
Kosala
Magadha
The Mahajanapadas are further
classified as Gana-Sanghas and Monarchies based on the nature of their
polity.
Gana-Sanghas
Gana-Sanghas were oligarchies,
which were centred on clans.
These kingdoms did not come
under the single decision-making authority of a king but decisions were
taken on a collective basis by the heads of the different clans together.
Powerful monarchies
have large standing armies but such organisation may be absent in
Gana-Sanghas . Their military
defeats from monarchical states was because of inability of military system to meet challenge of
empire building.
Varna organisation did not
determine social status . Two broad categories were those who owned land and
those who laboured on it. Brahmans might not have enjoyed same prestige as there was
hardly any reference of gift to Brahmana .
Two Mahajanapadas
– Vajji & Malla were Gana-Sanghas.
Side Topic : Were Gana-Sanghas Republic?
Translation of this
as Republic is misleading . These were oligarchies
where power was vested
in heads of leading Kshatriya families with no single
hereditary monarch .
Early studies on
ganas by nationalist
historians tended to glorify them by exaggerating their democratic
features . Comparisons were made with republics of Greece & Rome &
modern political institutions . Lot was to disprove the assertion of
western scholars that Indians had never known anything other than despotic
rule .
Their governance
was marked by Corporate
element . Arthashastra
(a later text although) outlines special strategies that ‘to be conqueror’
could use to vanquish ganas (advise focussed on creating dissension among
their ranks) .
Monarchies
Monarchical states
had
the king as head .
There was well developed taxation
system with standing armies .
Vedic orthodoxy was an
established practice in these kingdoms. The priestly class enjoyed a
preeminent status in the Mahajanapadas .
The Brahman priests provided the legitimacy to the king through
various rituals.
The kingship was hereditary
and the succession was in most cases based on the law of primogeniture.
The king was assisted by
councils called Parishad and Sabha. The councils were advisory in nature.
There was well developed
taxation system in Monarchical states. The revenue thus raised was used to
maintain elaborate administrative system and army.
Economy
Rural Economy
here was emergence of the private property in land .
Agriculture started
to produce surplus which led to rise of urban centres.
State also encouraged
expansion of agriculture .
Urban Economy
This period
led to the start of 2nd Urbanism .
Formation of states gave
impetus to Urban economy. Small aristocracy which extracted taxes started
to demand luxurious items giving push to artistic activities and trade .
Age of barter trade was almost over. Punch marked coins of copper
& silver came to use .
Society
There was shift in geographical region to Upper &
Middle Gangetic Plains .
This period led to the
institutionalisation of inequality in the society and hardening of caste
system .
Practice of untouchability started . Dharmasutras equated them with crows &
dogs.
Contact even accidental was considered polluting .
Strict control over women’s sexuality was practiced as it was essential for the
patrilineal transmission of property and for maintenance and perpetuation
of endogamous caste structure.
Wandering Ascetics
Paribrajakas and Sramanas. These were people who had renounced families
They
travelled from place to place and held discussions on meaning of life, society and
spirituality.
This article deals with ‘Vedic Period’ . This is part of our series on ‘Ancient History’ which is important pillar of GS-1 syllabus . For more articles , you canclick here.
Introduction
Decline of Harappan cities was
followed by another great civilisation and culture known as Vedic culture.
Vedic culture was the culture
of the speakers of Indo-Aryan language,
Sanskrit, who
would have entered India from the
north-west India.
Their initial settlements were
in the valleys of the north-west and the plains of the Punjab. Later, they
moved into Indo-Gangetic plains.
As they were mainly a cattle keeping people, they were mainly in search of pastures.
The period of Vedic Culture
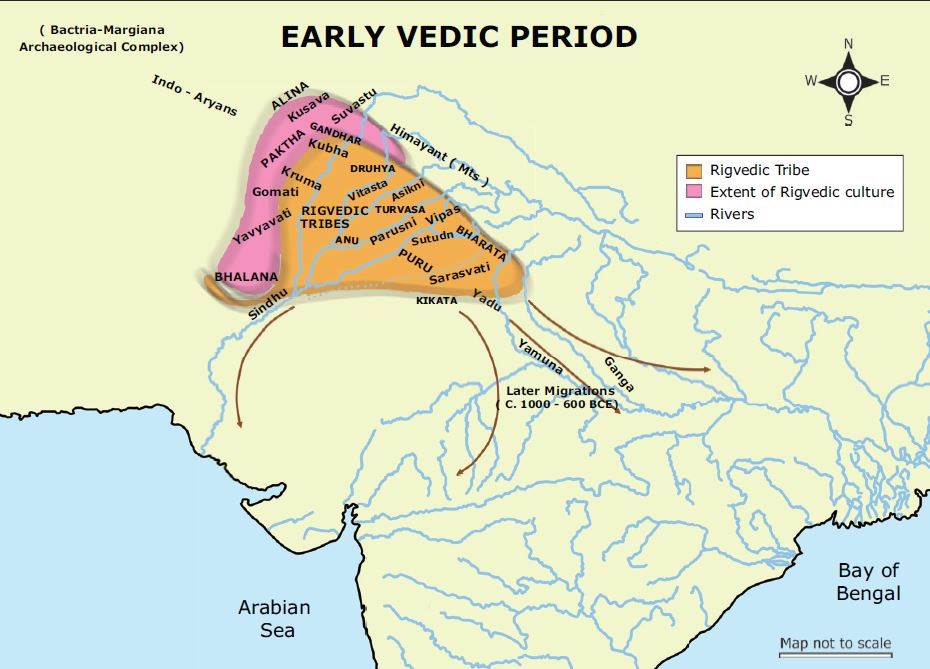
between 1500 B.C and 600 B.C may be divided into
Early Vedic Period or Rig
Vedic Period (1500 B.C -1000 B.C)
Later Vedic Period (1000B.C –
600 B.C)
Debate around original home of Aryans
The original home of
the Aryans is a debatable question and different scholars have different view
regarding this
European Theory : Supported by scholars like Sir William Jones , this theory was based on the similarity of all Indo-Aryan languages like Sanskrit, Greek, Latin, German etc. It states that Continent of Europe was the homeland of Aryans.
Central Asian Theory : Supported by scholars like Max Muller , it argues that Central Asia was the original homeland of Aryans based on the similarities in ‘Avesta’ (Iranian text) and the ‘Vedas’.
Artic Region Theory : Main proponent of this theory was Bal Gangadhar Tilak . According to this theory, the Aryans came from the Arctic region based on the astronomical calculations.
Indian Theory: This theory was supported by Dr. Sampurnanand and A.C. Das. They argued that Aryans were indigenous to the subcontinent. They argue that there are definite literary evidences in the Vedas that the Aryans regarded the Sapta Sindhu as their original home. Along with that, the sacrificial rituals of the Vedic Aryans having similarity with Harappan practices point towards their Indian origin.
The
most accepted view is that Aryans came to India from Central Asia from what is
known as Andronovo culture . This is corroborated by
similarities in the language of Rigveda and
Avesta (
oldest Iranian texts) along with other features like
Cremation , Fire Cult etc. Apart from that, Genetic Marker called M17 , found in 40% of Central Asian Steppe people is found in Speakers
of Indo Aryan Language .
Also, there wasn’t
any Aryan invasion but there was a
series of Indo-Aryan Immigrations and they came to the sub-continent as
immigrants.
Sources of Vedic Period
There are two type of sources i.e. Archaeological and Literary Sources.
1 . Archaeological Sources
Early Vedic culture is correlated with some Chalcolithic cultures of India especially Ochre Coloured Pottery Ware cultures.
On the other hand, Later Vedic culture is correlated with the Painted Grey Ware Culture of the Iron Age in North India.
But in contrast to Harappan Civilization, when the urban sites and farming cultures were present in a limited area, there was agricultural expansion in many parts of India accompanied with growth of craft production and population.
2 . Literary Evidences
2.1 Vedas
Vedas (Vid = to know,
Vidya) are one of the earliest known texts composed in India. The language of
the Vedas is Vedic Sanskrit. There are
four Vedas i.e. Rig Veda, Yajur Veda,
Sama Veda and Atharva Veda. The Vedic texts were memorized and orally
transmitted by Brahmins from generation to generation. They were written down
in the later period, after the introduction of writing. The earliest known written manuscripts of the
Vedas date to the 10-11th century CE.
a . Rig Veda
It is world’s oldest
surviving poetry
with extraordinary beauty & philosophical depth .
Total
number of hymns are 1028 , arranged in 10 Books or
Mandalas. These hymns personify forces of nature and try to control and appease them
.
Books of Rig Veda are as follows
Books 2-7
– They are the oldest books & known as Family Books . – These books are dated between 1500 and 1000 BCE and represent the Earlier Vedic Age. – Their composition is attributed to families of seer poets – Gritasamada, Vishvamitra , Vamadeva, Atri, Bhardwaj & Vasishtha .
Books 1,8,9,10
These books seems to be of younger age i.e. 1000 BCE onwards.
b . Sama Veda
There are total of 1810 hymns .
Most of the hymns are borrowed from Rig Veda & arranged according to needs of musical notations .
These hymns were used for singing in connection with sacrifices .
c . Yajur Veda
Yajur Veda consists partly of hymns & partly of prose sentence (yajus) . Most of hymns of Yajur Veda
are taken from Rig Veda.
Yajur Veda deals with performance of rituals .
d . Atharva Veda
Atharva Veda is the
latest Veda among four.
It consists
of 781 hymns
which are divided into 20 books.
It contains hymns ,
spells
and charms which reflect the popular beliefs .
Great importance of Atharva Veda lies in the fact that it is
the invaluable
source of knowledge of the real popular belief as yet uninfluenced by the
priestly religion
Note : Tradition of Vedic chanting is included in the UNESCO’s List of Intangible Cultural Heritage.
2.2 Brahmanas
Each
Veda has Brahmanas which are prose explanation of the Samhita portions in
terms of sacrificial rituals &
their outcomes.They reflect the spirit of an age in which
all intellectual activity was concentrated on the sacrifice .
Among most important Brahmanas
are
Rig Veda
Aitareya
Brahmana
Sama
Veda
Jaiminiya
Brahmana
Yajur
Veda
Taittiriya
Brahmana
Atharva
Veda
Gopatha
Brahmana
2.3 Aranyakas
Aranyakas are
also known as ‘Forest Books.’
They were probably composed for the
old men who had retired into forest & were unable to perform elaborate
sacrifices requiring many articles . For them meditation became of superior merit .
These
books interpret sacrificial rituals in a symbolic & philosophical way.
2.4 Upanishads
There are total of 108 Upanishads but 14 are considered principle .
Upanishads literally means to sit near someone & is understood as referring to pupils sitting near their teachers . Knowledge that was to be imparted was not ordinary knowledge . It was all encompassing the key to liberation from cycle of birth, death & rebirth , something that could be taught to select deserving pupils .
In Upanishads , Indian society started to question the traditional Vedic religious order. The materialistic aspect of religion was discarded and Vedic religion was raised to realm of philosophical doctrine involving around the new concept of Atman (the indestructible soul) and ‘Brahman’.
Note : Satyameva Jayate is taken from Mundaka Upanishad.
2.5 Vedangas
Vedangas are also known as
the limbs of the Vedas.
They include work such as
Srauta Sutras
Deal
with major rituals such as Ashvamedha and
Rajasuya .
Grihya Sutras
Which
lay down the norms for domestic rituals including rites of passage .
Dharma Sutras
that lay down
social norms .
Sulba Sutras
laying
down principle of geometry that were used for constructing the sacrificial
altar .
These texts were
also composed over a very long period of time, between c. 800 BCE to c.
200 BCE.
3 . Zend Avesta
Earliest part of Zend Avesta
is attributed to 1400 BCE .
Zend Avesta deals with fire
worship, horse sacrifice, cult of soma (or haoma in Avestan language) and
there is similarity in name of gods and social classes with Vedas.
Horse Centeredness in Vedic Culture
Horse is indispensable trait of Aryan culture .
In Vedic & Avestan Texts , personal names are horse centred . Various Iranian chiefs in Avesta & various Iranian tribes mentioned by Herodotus were named after Horse .
In Rig Veda, name ASVA comes in various forms 215 times . No other animal was named so frequently. Even Cow (Go) word occurs 176 times.
Rig Veda has prayers to god to grant King with ‘Swift Horses’ and ‘Strong Sons’.
Various sacrifices and ceremonies involved Horse. Eg : Ashvamedha & Rajasuya (chariot race) Yajnas.
Arguments to prove that Harappan & Rig Vedic people werent’ same
Mode of living was different
Harappan civilization was an
urban civilisation.
Rig Vedic people were
pastoral and rural in nature.
Archaeological evidences show
that
Harappan phase ended in 1900
BCE .
Aryans arrived in India
around 1500 BCE .
Rig Vedic people were only
aware of barley but Harappans were aware of wheat , sesamum, peas etc.
Vedic Chiefs were horse
centred but Harappans weren’t aware of this animal.
Writing of both Civilisations
was different. Rig Vedic people spoke Vedic Sanskrit whereas Harappan
Script has not been deciphered yet.
Harappans practiced earth
burials whereas Vedic people cremated the dead ones.
Culture reflected through Rig Veda Samhita
Historians
divide Rig Vedic Corpus into two parts
Early Vedic Texts
: Family Books of Rig Vedic Samhita .
Later Vedic Texts
: Books 1,8,9 & 10 of Rig Vedic Samhita + Samhita of Sama, Yajur & Atharva
Veda
+ Brahmanas, Aranyakas & Upanishads .
Cultural stages
reflected in two broad strata of early & later Vedic texts have come
to be known as early & later Vedic cultures .
Part 1: Early Rig Vedic Culture (1500 – 1000 B.C.)
During the Early
Vedic period, the Aryans were mostly confined to
the Indus region. They lived in the area of eastern Afghanistan,
Pakistan, Punjab and fringes of Western Uttar Pradesh. Rig Veda mentions some
of the rivers of Afghanistan like river Kubha along with Indus and it’s
tributaries. It also mentions Saraswati which has been identified as
Ghaggar-Hakra channel in Haryana and Rajasthan , but it’s Rig Vedic description
shows it to be Avestan river Harakhvati or present day Helmand in Afghanistan.
The political, social and cultural life of the Rig Vedic people can be traced from the hymns of the Rig Veda.
Political Organization
Rig Veda is pervaded with aura of wars .
Kinship was the
basis of the social structure of Rig Vedic society. People were identified
with specific clans and the clans formed the tribe or jana. People’s
primary loyalty was to the tribe. About 30 tribes/Janas have
been mentioned in the Rig Veda . Purus & Bharatas were two dominant tribes. They initially
seem to be allies but at some point fell apart .
Rig Vedas speak
about not only the Aryans, but also about the non-Aryan people, whom the
Aryans referred to as Dasas or Dasyus . Dasyus were dark
native people who had different cultural practices. When the Rig Vedic
people moved into India they came into conflict with these people .
Prayers
to Indra to defeat not only Dasa but also Arya enemies indicate there were
conflicts between Aryans too .
Aryans are
associated with introducing Age
of Chariot , spoked wheel and were equipped with better weapons and horses. This gave
them edge over original inhabitants.
Word Rajan occurs many times . Since full fledged
monarchical state hadn’t emerged , it is best translated as chieftain . His
main task was to protect his people & lead them to victory in war.
Reference to
Chieftain as Gopa /Gopati i.e. Lord of Cattles indicate protecting and
increasing herd was his major role .
Royal priest accompanied Rajan to Battle ,
recited prayers & supervised performance of rituals.
Rig Veda mentions Sabha
& Samitis . Such assemblies might have played important
role in redistribution of resources . Apart from that, it acted as check
on Rajan and Rajan
couldn’t do anything without the approval of these bodies.
Sabha
Seems to be smaller & more elite gathering
Samitis
Larger assembly presided by Rajan
Social Life
1 . Absence of strict social hierarchy (Caste)
In family books, ‘Varna’ word
occurs but it means ‘Colour’ . Word Brahmana & Kshatriya is frequently used
in family books but word Varna in context of fourfold divided society is never used . Word Vaishya
& Shudra is altogether absent .
(Purushasukta Hymn of Book 10 of Rig Veda was the first to speak
about 4 fold division)
Absence of
strict social hierarchy & existence
of social mobility is suggested in book 3 by hymn – ‘O Indra , fond of Soma , would you
make me the protector of people or would you make me a king , would you
make me a sage who drink soma , would you impart me endless wealth?’
2. Position of Women
19th century socio-religious
reformers & 20th century nationalist historians represented Vedic age as golden age for women . They pointed out that
Vedic
people worshipped goddesses .
Rig Veda contains
hymns composed by women .
Presence of women sages .
Women took part in rituals along with their husbands .
Women took part in chariot races .
Women attended Sabha & various social gatherings .
Rig Veda attaches
importance to institution of marriage . Rituals indicate post puberty marriage &
there are references of women choosing their husbands . Women could
remarry if his husband disappeared
.
Polyandry
was present as Maruts
are represented as living
with Rodasi and two Asvin brothers lived with daughter of sun god.
But other scholars
challenge it on following account
Great part of
discussion is about elite women ignoring less privileged ones.
Although Rig
Veda mentions goddesses but none of them is as important as major gods.
Social implication of worship of female deities is
complex . It shows ability of society to visualise
divinity in women form but it doesn’t automatically mean that
real women enjoyed power or privilege .
Proportion of hymns
attributed to women are minuscule 12-15 out of over 1000 .
Women participated
in Vedic rituals & sacrifices but as wives on behalf of his husband.
Vedic society was patrilineal &’patriarchal – women enjoyed little
control over material resources .
Rig Vedic prayers are for son & not
daughter & absence of sons is deplored .
3. Nature of Household
Household was called Dam which was under joint control of
husband and wife, called dampati (dual).
Both sons and daughters seem
to have been welcome in the dam.
4. Joint Family
There is single word to denote nephew, grandson , cousin etc. This imply that differentiation in family relationships leading to the setting up separate households had not occurred and family was a large joint unit.
5. Food
Wheat and barley, milk and its products like curd and ghee, vegetables and fruits were the chief articles of food.
However, the eating of cow’s meat was prohibited since it was a sacred animal and was considered aghnya (not to be killed).
Drink known as SOMA consisted of the juice of Soma plant, mixed with milk, sour milk or yava (cereal) was their favourite . SURA seems to be intoxicating drink made by fermenting grain.
6. Leisure time
There are references to singing , dancing & musical instruments eg vina , vana &’drums. Dramas , Chariot racing & gambling with dice were source of entertainment .
Economic Condition
Pastoralism
Prayers in Rigveda suggest that Early Vedic Economy was predominantly , if not exclusively , Pastoral in nature. It is corroborated by the references to cattle as wealth and typical kind of animosity shown towards urbanity as Indra known as Purandara (breaker of Forts / Cities) .
Agriculture
Pastoralism
was no doubt important but Agriculture cant be altogether ignored .
Archaeological evidence points
to the development of agriculture among the Rig Vedic people.
The ploughshare is
mentioned in the Rig Vedas. There are hymns in Rig
Veda referring to levelling of fields for cultivation, desire for fertile
fields & producing rich
harvests . There are prayers to Indra to
grant or enrich fields . Indra is also referred to as protector of
crops and winner of fertile lands .
They cultivated barley (yava).
Craft Production
Rig Veda mentions artisans such as carpenters, chariot-makers, weavers and leather-workers.
Weaving of clothes of cotton and wool is also mentioned.
Copper metallurgy was one of the important developments of this period.
Word Ayas occur in many contexts like Indira’s thunderbolt of Ayas , Agni compared to edge of Ayas etc. . But it is not clear which metal these objects were made of . Some scholars interpreted Ayas as Iron artefacts which is not true as Early Rig Vedic Age was chalcolithic in nature . Ayas could have meant copper, bronze or may be general term for metals .
No notion of private property
Notion of private property ownership didn’t exist . Clan as whole enjoyed rights over major resources like land & herds .
Trading
Although trading activities
were limited but traders referred to as ‘Panis’ were present during the
Early Vedic period.
Coinage system was not
developed and most of the trade was carried in Barter.
Transportation
Bullock carts, horses and
horse-drawn chariots were used for transport.
There are references to the
sea (samudra) and boats (nau) indicating riverine transportation as well.
No formal taxation system
There was no
regular revenue system although Rig Veda mentions
the voluntarygifts (bali) received by Rajan from
the members of clan .
War booty was major source of wealth .
Religion
Rig Vedic Aryans
worshiped the natural forces like earth, fire, wind, rain and thunder i.e.
Rig
Veda reflects Naturalistic
Polytheism. They personified these natural forces into many gods and
worshipped them. The important Rig Vedic gods were Indra (thunder) ,Agni
(Fire), Prithvi (Earth), Vayu (Wind) and Varuna (Rain) .
Religion followed by the Early Rig
Vedic people was ‘sacrificial’
in nature. Animal
sacrifice is way to kill older animals with no economic utility and lessen
the burden on their owner.
Indra was the most
important and most
frequently invoked god in Rig Veda .250 Rig Vedic hymns
are attributed to him. He was vigorous & strong , great
warrior . His weapon was thunderbolt
(Vajra) &
he led Aryas to victory in Battles . He loved to drink Soma . The most
important myth associated with him
was his win over serpent demon
Vritra who was hiding water. Indra finally killed him with his Thunderbolt
& released the water. According
to (historian) DD Kosambi,
these stories originated from the clashes between Aryan Tribes whose chief
was envisaged as Indra and Non-Vedic original settlers and breaking of
agricultural dams built by these settlers.
Next in
importance was Agni
who was regarded as an intermediary between the gods and people.
Varuna who personified water
was supposed to be the upholder of the natural order.
There were female gods like
Aditi and Ushas as well.
There were no temples and no
idol worship during the early Vedic period.
Part 2 : Later Vedic Period (1000 – 600 BC)
The Later Vedic culture is
dated to the period between 1000 BCE
and 700–600 BCE. The Satapatha Brahmana refers to the
expansion of Aryans to the eastern Gangetic plains
The Painted Grey Ware Culture of the
Iron Age is associated with the Later Vedic culture.
The Aryan speakers expanded till Ganga-Yamuna doab in the Later Vedic period.
The Bharatas and
Purus, the two major tribes, combined and thus formed the Kuru people.
Soon the Kurus occupied Delhi and the upper reaches of the doab,
the area called Kurukshetra or the land of the Kurus. Gradually they
coalesced with a people called the Panchalas who occupied the central part
of the doab. The authority of the Kuru–Panchalas people spread over Delhi
,and the upper and central parts of the doab. They set up their capital at
Hastinapur situated in Meerut district. The history of the Kuru tribe is
important for the battle of Bharata, which is the principal theme of the
great epic called the Mahabharata. This war is supposed to have been
fought around 950 BC between the Kauravas and the Pandavas. Since both of
them belonged to the Kuru clan, as a result of war virtually the whole of
the Kuru clan was wiped out.
Political Organization
Larger Kingdoms
Later Vedic people led a
settled life leading to formation of territorial units.
Larger kingdoms were formed
during the later Vedic period. Many Jana or tribes were amalgamated to
form Janapadas.
The wars were no longer fought
for cows, but for territories.
Hereditary Kings
Hereditary Kingship was emerging &
Shatapatha Brahmanas refer to kingdom of 10 generations .
In
absence of firmly established principles of heredity & primogeniture, rituals became important for ruler to assert his authority. Ceremonial sacrifices like Rajasuya
(consecration ceremony), Ashvamedha (horse sacrifice) and Vajpeya (chariot
race) were performed on
lavish scale and were thought to give Super-Human status to chiefs ,
legitimising their rules.
Taxes
Taxes were not yet formally collected although Bali was
possibly acquiring an obligatory character.
The king received voluntary or
compulsory contribution called Bali from the people .
Bureaucracy
Although well developed
bureaucracy was still absent but number of officials increased than Early
Vedic Culture. Some of the
officials include
Purohita :
Chief Priest
Charioteer or Suta :
Companion of Raja in his exploits & who narrate tales of valour on a
number of occasions.
Senani : Leader of the Army
Sangrahitr : Associated with
gathering resources.
At the lower level, the
administration was possibly run by village chief called Gramini.
Even in later Vedic times the
king did not have a standing army. Tribal units were mustered in times of
war .
Reduced powers of Sabha and Samiti
Sabha & Samiti continued
to exist but with increase in power of king , power of these assemblies
decreased.
Membership was also
reduced to chiefs and rich nobles, and women were no longer permitted to
sit in the Sabha .
Social Conditions
Varna Hierarchy
Purushasukta
Hymn in Book 10 of Rig Veda for the first time refers to 4 social
groups – Brahmana , Rajanya (or Kshatriya) , Vaishya & Shudra . Varnas are described as being created at same
time as that of earth , sky , sun & moon indicated this was considered a part of natural & eternal order of world
.
The two higher classes –
Brahmana and Kshatriya enjoyed privileges that were denied to the Vaisya
and Sudra.
The concept of dvija (twice-born) developed and the upanayana (sacred thread) was limited
to the upper sections of the society. This ceremony marked the initiation
for education. The fourth varna was denied this privilege and the Gayatri
mantra could not be recited by the Sudras. Women were also denied
upanayana and Gayatri mantra
Although there is no
indication of practice of untouchability but in later Vedic
texts groups like Chandalas were
looked upon with contempt by elites . In Chandogaya Upanishad , they are described as
victims to be offered in symbolic Purushamedha (human sacrifices) & dedicated to
deity Vayu (wind) suggesting they lived in open air .
Position of woman
Position of woman started to
deteriorate compared to the Early Vedic Period corroborated by following
facts
Women lost their political
rights of attending assemblies.
Child marriages became
common.
According to Aitreya
Brahmana, a daughter has been described as a source of misery.
Polygyny became frequent.
Society became strictly
patrilineal and patriarchal .
Atharva Veda contains
charms for changing a female foetus into a male one .
But at some places, Women were
praised & exalted in in
later Vedic texts . For instance
Shatapatha Brahmana states
that wife is half the other half
of her husband & completed him .
A
few women like Gargi
& Maitreyi
participated in the philosophical debate with Upanishadic
Sages .
Vishpala was a women
warrior who lost a leg in battle
but such references were far apart & minuscule .
Nature of Household
Household was called Griha which was under the control
of husband called Grihapati.
Griha had three components: a patni, cattle
and sons.
Food
Apupa was the cake mixed with ghee .
Milk products were
consumed.
Meat was eaten on
special occasion like honouring guests .
There are references of
intoxicants like Sura .
Soma plant become difficult to
obtain . Hence, substitutes were allowed .
Economic Conditions
Use of Iron
Earliest references to iron
found are during Later Vedic Period
Term Krishna Ayas in Yajur Veda &
Atharva Veda refers to Iron.
Taittariya Samhita mentions ploughs driven by 6 or even 12 oxen (made of iron) .
Iron was used extensively in
this period and this enabled the people to clear forests and to bring more
land under cultivation. Iron is
believed to have played an important role in the conversion of the forests
of the Ganga Valley into agricultural lands.
Agriculture
Agriculture became the chief
occupation as iron helped to clear the forests.
Improved types of implements
were used for cultivation.
Satapatha Brahmana mentions
rituals related to ploughing. The
god Balarama is depicted with a plough, which suggests the importance of
cultivation.
Besides barley , rice and wheat were grown.
Property rights
Land was owned and occupied by extended families .
Craft Production
Arts and crafts proliferated
during the Later Vedic age and craft specialization took deep roots.
Metal work like iron and
copper became important. Weaving
was undertaken by women. Leatherwork, pottery and carpentry were well
known.
Bow makers, rope makers, arrow
makers, hide dressers, stone breakers, physicians, goldsmiths and
astrologers are some of the specialized professional groups mentioned in
the texts.
Trading
Vaisyas carried on trade
and commerce. They organized themselves into guilds known as ganas.
No evidence of coins has been found and therefore barter must have been the
medium of exchange. The introduction of coins took place after about 600
BCE.
Religion
Gods of the Early Vedic period
like Indra and Agni lost their importance. Prajapati (the creator), Vishnu
(the protector) and Rudra (the destroyer) became prominent during the
Later Vedic period.
Sacrifices became
very elaborate. The importance of prayers declined and that of
sacrifices increased. It was
believed that sacrifices could solve many problems. The correct performance of sacrifices
was stressed. Stress was laid on paying dakshina to the Brahmins
performing the sacrifices.
The rise of Buddhism and
Jainism and upanishadic philosophy within hinduism was the direct result
of reaction to these elaborate sacrifices. Upanishads stress the
importance of realising the atman or inner self and heterodox faiths such
as Buddhism and Jainism emphasized
on correct human behaviour and discipline.
This article deals with ‘Harappan Civilisation’ . This is part of our series on ‘Ancient History’ which is important pillar of GS-1 syllabus . For more articles , you canclick here.
Introduction
Indus Valley Civilisation
represents the first phase of urbanisation in India contemporaneous with
the civilisations of Mesopotamia and Egypt
This civilisation did not
appear all of a sudden. It developed gradually on the foundations provided by Neolithic
villages in the area. For example,
Neolithic villages in this region go back to about 7000 BCE at the
Neolithic site of Mehrgarh.
It is known by various names
like
Indus Valley Civilization :
It was mainly spread in valley of Indus and it’s tributaries.
Harappan Civilization : As Harappa was the first site of this
civilisation to be discovered.
Area of spread
Civilization was spread over
nearly 1.5 million sq. km area.
Its core area was in the regions of Pakistan, Punjab, Haryana,
Rajasthan and Gujarat.
It is spread between
Sutkagen-dor (on
Pakistan-Iran border) in the west
Manda (Jammu and Kashmir) in
the north
Alamgirpur (Uttar Pradesh,
India) in the east
Daimabad (Maharashtra, India)
in the south
Phases of Harappan Civilisation
Harappan
civilisation is dated between c. 2600 and 1900 BC. There were earlier and later
cultures, often called Early Harappan and Late Harappan. The Harappan
civilisation is sometimes called the Mature Harappan culture to distinguish it
from these cultures.
Early Harappan
3000 to 2600 BCE
It is known as ‘Period of Regionalisation‘. It was proto-urban formative phase . Settlements had fortifications and craft specialisation started to develop. But large cities were absent.
Mature Harappan
2600 to 1900 BCE
It is known as ‘Period of Integration ‘. It was full fledged Urban phase. Settlements were large and high degree of craft specialisation was reached.
Late Harappan
1900 to 1700 BCE
It is known as ‘Period of Localisation‘. It was post-urban phase . Settlements were small , more in number but rural in character. Single Harappan Culture fragmented to 3local phases 1. West Punjab Phase (Cemetery- H Culture) 2. Jhukar Phase Rangpur Phase 3. Ganga Yamuna Doab Phase
Note : The urban
phase was prevalent in the mature Harappan period and began to decline
afterwards.
Town Planning
1 . Planned Towns
Harappan Cities were well planned .
There was Grid Pattern of streets cutting each other at right angles . The streets were wide enough for too and fro movement of traffic.
City was divided into two distinct parts i.e.
Citadel : Small , higher & fortified (walled) which housed importantbuildings like Granaries, Great Bath etc.
Lower Town : Bigger , lower and separately walled housing common public .
Since the city was walled, it meant that once the wall was built, it couldn’t be expanded. It corroborates the fact that city was first planned and then built according to the plan.
2 . Fortified Towns
Harappan cities were fortified .
These fortifications could have served following purposes :-
Protection from attacks .
Exclude outsiders .
Helps to control activities inside the fortification.
If traders bring goods from places faraway they can demand share for allowing access to potential buyers inside
3 . Impressive drainage system
It was the most complete ancient drainage system seen in any ancient civilization. Perhaps no other Bronze civilization paid such emphasis on health and cleanliness as Harappans.
Every house was connected to street drains.
Main channels were made of bricks set in mortar and covered with loose bricks that could be removed for cleaning. House drains first emptied into a sump or cesspit into which solid matter settled while waste water flowed out into the street drains.
Drainage systems were not unique to the larger cities, but were found in smaller settlements as well.
4 . Extensive use of standardised baked bricks
Size of bricks was uniform (ratio = 4:2:1).
Standardised size of bricks indicate that brick making was organised on large scale.
Various brick laying techniques were used including ENGLISH BOND STYLE (for maximum strength).
Note : In contemporary Egyptian Culture, dried bricks were used . Although, baked bricks were used in Mesopotamia but they were used much widely in Harappan culture.
5 . Houses
People lived in houses of
different sizes showing that stratification was present in the society.
Staircases were present in
some houses which might have led to roof .
Although most of houses were
single storied . But two and three storied houses were also present.
Floors
were made of high packed earth.
Small
houses attached to large ones might have been quarters of service
groups .
Toilets & Bathrooms : Houses had separate bathing & toilet areas
. Floor of these was made of tightly fitted bricks .
Houses were without much
decoration
showing utilitarian outlook of Harappan people .
Crafts and Techniques
Harappans mass – produced
standardised items.
Some were quintessentially Indus, i.e. they are
neither found prior to the advent of civilization nor after its collapse.
Eg : Indus seals .
1 . Harappan Pottery
Harappan Pottery reflects efficient mass production .
Features
of typical Harappan Pottery were
Harappan pottery was well
baked .
Harappan Pottery was made
with potter’s wheel.
Pottery has bright
red slip decorated with
black designs .
Shapes – There was great variety of shapes like pots, large Jars (to store grains or water),
flattish dishes (used as plates), perforated jars (use not clear) etc.
Decorative designs on pottery include – fish scales, pipal leaves , horned deity , intersecting circles,
zig-zag lines etc.
2 . Copper Objects
Harappan civilisation was a ‘Bronze Age civilisation’ and Harappans knew how to make copper and bronze tools. They did not have the knowledge of iron.
Harappans used pure copper as well as copper alloyed with Arsenic , Tin or Nickel .
Artefacts include vessels , spears, knives, short swords, mirrors , rings & bangles etc.
With time %age of bronze increases.
Side Topic : Dancing Girl
Most of metal objects found are Utilitarian .
Most important Non-Utilitarian Copper Object excavated from Harappan Civilization is Dancing Girl found at Mohenjodaro .
It was made using LOST WAX TECHNIQUE .
Features of Dancing Girl
She is standing in Tribhanga posture .
She is naked .
She is wearing a necklace, 24-25 bangles in left arm & just 4 on right arm .
John Marshall called it DANCING GIRL (thought her to be equivalent of Nautch Girl dancing on music) . Although name struck , but she might not have been dancing at all .
3 . Seals
Use of seals was to facilitate long distance communication. They might have been used
For stamping on bag’s rope knot .
Insignia / images on seal
conveyed the identity of sender.
Seals were square or rectangular .
Average size of square seal
was 2.54 cm .
Material used –
Steatite
Carvings are in intaglio
ie sunken engravings with impression appearing in
relief
Motifs on seals include elephant,
tiger, humped bull, rhinoceros
, one horned unicorn etc.
Most seals have short inscription. The longest inscription has about
twenty six signs.
4 . Beads and Bangle making
This craft was known in
earlier cultures too but Harappans
used new materials and better techniques
Beads
Material used included
Steatite, Carnelian , Lapis Lazuli ,etc.
Harappan long barrel cylinder carnelian beads were so beautiful that
they are found in royal burials of
Mesopotamia.
Main centres of Bead making
were Chanhudaro & Lothal . Bead making tradition in Gujarat
today give us
clue on how Harappan craftsmen might have made beads
Bangles
Bangles were often
made from conch shell .
Nageshwar (near Jamnagar) and Balakot ,
situated near the coast, were exclusively devoted to Bangle making from shell .
Dancing girl found
at Mohenjo-Daro is shown wearing bangles in large numbers .
Water Management System
Harappan sewage & drainage was far more advanced
than any other found in contemporary
urban sites in the Middle East.
Sewage System
Every house was connected to street drains.
Main channels was made of bricks set in mortar and was
covered with loose bricks that could be removed for cleaning.
House drains emptied into
cesspit where solid matter settled and waste water flowed into street
drains
Water Management in various cities
Mohenjodaro
– Almost all houses had private wells (700 wells found in city). – It also had the Great Bath .
Lothal
It had port with a dockyard .
Dholavira
– System of water management was architectural marvel . – Two seasonal streams – Manhar and Mansar – was dammed and diverted to the large reservoirs within the city walls . It had 16 water reservoirs covering as much as 36 % of the walled area.
Shortughai
– Canal for irrigation brought water from nearby Kokcha river .
Agriculture
Harappans were
producing enough food to sustain urban population which was engaged in
activities other than agriculture. Their subsistence base was wide and
diverse as it was situated on alluvial plains , mountains , plateaus & sea coasts .
Today the rainfall
in Sindh is about 15 cm, but in the fourth century BCE , one of the
historians of Alexander informs us, that Sindh was a fertile part of
India. In earlier times, the Indus region had more natural vegetation
which contributed to rainfall. Along with that , annual inundation of
Indus made the region very fertile. Just as the Nile created Egypt and
supported its people, so too the Indus created Sindh and fed its people
Crops : Harappans cultivated
diverse crops such as
Wheat
Barley
Lentil
Chickpea
Sesame
various millets
Note : although rice husk has
been found at sites like Rangpur but it wasn’t the main crop of Harappan
civilisation.
Cotton : Cotton was cultivated
in Harappan civilisation . Following evidences prove this fact
Mesopotamian texts state that
cotton was important import from Meluha .
Ploughing : Harappans used ploughs. They ploughed
the land and then sowed the seeds increasing the agricultural output. Ploughed fields have been found at Kalibangan. Terracotta models of the plough have
been found at at Banawali (Haryana).
Irrigation : Most Harappan sites
are located in semi-arid lands, where irrigation
was probably required for agriculture. Harappans built embankments and dams
for irrigation. For example :-
Irrigation
canals have been found at Shortughai .
Water drawn
from wells was also used for irrigation.
Water
reservoirs found in Dholavira
(Gujarat).
Animal Domestication
Animals were domesticated by
the Harappans for meat, milk and draught purposes.
They domesticated sheep, goat, buffalo , fowl etc.
They also ate fish
. In states like Gujarat, Molluscs were widely consumed. Marine catfish bones have been
found at Harappa showing coastal community traded in dried fish .
Evidence
from seals
show region also housed humped bulls, rhinoceros, ibexes , boar, deer and
gharial .
Issue of Horse is controversial
Horse remains have been reported
from Harappa
, Lothal, Surkotda & Kalibangan . But analysis of bones is questioned by
other scholars .
In any case, the Harappan
culture was not horse-centered. Representation of horse has not been
found on seals or pottery .
For UPSC exam, we can say
that horse was not known to them.
Trade and Exchange
Harappans did not use metal
money, and in all probability carried exchanges through a barter system.
Two types of trade was going
on
External
Trade
With
Mesopotamia & Persian Gulf
Internal
Trade
Between
different Harappan sites and various other cultures of India .
External Trade
Evidences showing External
Trade are as follows
Harappan
seals and materials found in the
Sumerian and Mesopotamian sites as well as in Oman, Bahrain and Iran.
Mesopotamian inscriptions mention the trade between
Mesopotamia and Harappans. The mention of “Meluha” in the
Mesopotamian inscriptions refers
to the Indus region.
Important exports were
Carnelian beads – found even in Mesopotamian Royal Graves
Textile – Mesopotamian Records of King Sargon mention this
Ivory & Ivory objects
Lapis Lazuli,Gold, Silver , copper, tortoiseshell , chicken like bird
Import imports were
Fish, grain , wool, woollen garments & silver from Mesopotamia
Internal Trade
Harappans also interacted with
various regions of India and acquired raw materials and processed them.
These regions were as follows
Copper
Khetri deposits
in Rajasthan
Tin
Tosam area of
Haryana
Gold
Kolar mines of
Karnataka
Most
semi precious stones except Lapis Lazuli
Gujarat
Lapis Lazuli
Shortughai in
Afghanistan
Weights and Measures
Harappans had developed proper weights and measures. Since they were involved in commercial
transactions, they needed standard measures.
Cubical weights
made of chert, chalcedony, black stone etc. have been found at excavated
sites.
Weights exhibit a binary
system. The ratio
of weight is doubled as 1:2:4:8:16:32.
They also used a
measuring scale in which one inch was around 1.75 cm. Sticks inscribed
with measure marks have been found, and one of these is made of bronze.
Faiths and Belief System
Harappan people had wide faiths and belief systems.
1 . Nature worship
Harappan seals, sealings, amulets & copper tablets depict number of trees , plants & animals . Some might have cultic significance as well and these include
Pipal (Ficus Religosa)
Bull which is symbol of male virility . Seal from Chanhu-daro depict a bull bison with erect penis, fecundating a supine human figure.
One horned animal probably Unicorn.
Composite animals like Tiger-Human. Conception of composite gods like Narsimha can be traced back to this .
2 . Mother Goddess
Worship of female goddesses is historically
associated with fertility .
Mother
Goddess is slim female with fan shaped headdress & wearing short
skirt . She is heavily ornamented with necklaces and earrings.
3 . Proto Shiva
Harappans
also worshipped male god
represented on seal discovered at
Mohenjodaro known as Pashupati Seal. The god is surrounded by an elephant, a tiger, a
rhinoceros, and below his throne there is a buffalo, and at his feet two
deer.
Note : It resembles with
Shiva who is Mahayogi (the great
yogi) & Pashupati( lord of
animals)
4 . Priest King
Found at Mohenjo Daro known as Priest king.
He was called Priest King because archaeologists were familiar
with Mesopotamian
history and its “priest-kings” .
5 . Fire Alters
Citadel at Kalibangan consists of fire alters where offerings were made into fire.
Fire Alters have also been reported at Banawali, Lothal, Amri & Rakhigarhi .
Fire ritual was central to Vedic religion . These evidences indicate that Aryans might have adopted this from Harappans when they came & settled down in these areas .
6 . The Great Bath
The Great Bath found at
Mohenjodaro might have religious
significance as well.
The Great Bath was a large
rectangular tank with two staircases
on the north and south leading into the tank. There were rooms on
three sides, in one of which was a large well. Water from the tank flowed
into Great Bath . Across a lane to
the north lay a smaller building with eight bathrooms. The uniqueness of
the structure and fact that it was found on citadel led scholars to suggest that it was
meant for some kind of a special ritual bath.
Burial Systems
Harappans buried the dead.
The Harappan burials have
grave goods in the form of pottery, ornaments, jewellery, copper mirrors
and beads. This suggest their belief in an afterlife.
Compared with other
civilisations, it can be said that on the whole, it appears that the
Harappans did not believe in burying precious things with the dead.
Note : Although Harappans
buried their dead but Harappan civilisation hasn’t yielded a monument for
the dead which could equal Pyramids
of Egypt or Royal Cemetery of Ur .
Nature of Writing
The biggest
mystery about the Harappans is which language(s) they spoke.
Harappan script consists of 400-450 basic
signs.
Harappan script was pictographic in nature (i.e.
picture used to represent a word).
It was
written from right to left corroborated by the fact that some seals show a wider
spacing on the right and cramping on the left.
Although larger inscriptions
were rare. In large inscriptions , they followed Boustrophedon Style (i.e. first line in
right to left , then next line in left to right)
Nature of
Language
Some
scholars argue that Harappan script and language belonged toDravidian family
. Father Heras was strong advocate of this view . He
argued that Brahui
, language still spoken in this
region , belongs to Dravidian family .
Others
historians believe that it
belonged to Indo-Aryan languages
.
Yet others believe that it
belonged to the Sumerian language.
Harappan script has not been
deciphered yet . Mortimer
Wheeler writes the conditions requisite for the interpretation of the
script are (1) bilingual inscriptions with known language and (2) long
inscription with significant recurrent features . Both these conditions
aren’t present in Harappan inscriptions.
Nature of Polity
State was
present in Harappan Civilisation . Following things prove the existence of
state
Uniform culture over such a large area wasn’t possible without central authority.
Granaries at Mohenjo-Daro and Harappa where surplus was collected and stored , most probably by the rulers.
Control of labour as indicated by elaborate drainage system, citadels and public buildings which were made by mobilising labour on large scale.
Standardisation , site specialisation and establishment of trading outpost at Shortughai .
Common system of writing across wide area .
FORTIFICATIONS especially imposing ones like Dholavira, Harappa and Mohenjo-Daro.
We have no clear idea of an organized force or standing army, but a heap of sling stones and the depiction of a soldier on a potsherd at Surkotda may suggest a standing army.
Harappan civilisation lasted for 700 years & artefacts continued unaltered which suggests strong political stability .
Side Topic : A Priest King
In ancient
Mesopotamian & Egyptian civilisations,
rulers were portrayed extensively in stone reliefs & sculptures to proclaim their power . But
Harappan case is strikingly different because here no such things have
been found .
Taking view from Egypt &
Meso Civilisation , stone bust of Male found at Mohenjodaro is given label
of Priest King . However whether he represent
priest or king or both is far from certain.
Contemporary Cultures of the Harappan Civilisation
While the Indus Civilisation
was flourishing in the north-western part of India, several cultures were
developing in different parts of India..
Kashmir
Kashmir was under Neolithic culture during this phase. Sites like Burzahom belong to this phase.
Deccan and Western India
Chalcolithic cultures were prevalent in Deccan and western India.
Chalcolithic culture in the
form of Ganeshwar-Jodhpura culture was prevalent in Rajasthan.
Harappans imported copper from here (Khetri copper mines).
South India
Kerala and Sri Lanka were
still under hunting and gathering
phase.
Northern part of South India,
i.e. the Karnataka and Andhra region, had Neolithic cultures, engaged in
pastoralism and plough agriculture.
Harappans used to send
expeditions to South India to import gold especially from region
surrounding Kolar gold fields.
Morphology of Harappan Cities
1 . Mohenjo Daro
Region
Sindh (Pakistan)
River
Indus
Excavator
RD Banerji (1922)
Important points
– It was the second site to be discovered after Harappa. – It was spread over area of 125 Hectare and at it’s peak , used to house population of around 35,000. – Important things excavated here includes 1. Great Bath 2. College of Priests 3. Granary 4. Large Pillared Hall 5. Dancing Girl 6. Pashupati Seal 7. Superficial evidence of horse (although refuted by many historians) 8. Model of ship/large boat
– Problem – water levels in Mohenjodaro has risen high . As a result, it is not possible to determine whether early Harappan levels were present
2. Harappa
Region
Punjab (Pakistan)
River
Ravi
Excavator
Rai Bahadur
Dayaram Sahni (1921)
Important points
– It was the first site to be discovered . – Important things excavated here include 1. 6 Granaries 2. Cemetery H with urn-burials 3. Large number of wells 4. All other Harappan features like Citadel, sewage system, fortification etc. – Issue : most of the citadel buildings was already destroyed (bricks used in railways & robbed by brick robbers). Clear profile of main citadel is lacking .
3. Kalibangan
Region
Ganganagar district of Rajasthan (India)
River
Ghaggar
Excavator
Amalanand Ghosh (1953) and BK Thakur (1961)
Important points
– Get its name from the thick cluster of black bangles lying all over mounds . – Important things excavated here include 1. Fire Alters – Interpreted as sacrificial pits 2. Ploughed fields – first of its kind in history 3. Black bangles – It wasn’t as well developed as Mohenjodaro and Harappa. Lower town didn’t have well developed drainage system. – It survived till 1800 BCE when Ghaggar river completely dried up
4. Lothal
Region
Near Khambat in Gujarat
River
Between Sabarmati
river & its tributary Bhogavo
Excavator
SR Rao (1957)
Important points
– It was a sea-port . – Although , not big in size but it was economically important . – Important things excavated here include 1. Huge basin / dockyard to dock ships . 2. Evidence of rice husk . 3. Evidence of double burial i.e. man and woman buried together. 4. Fire altars 5. Bead factory
5. Dholavira
Region
Kadir Island
in Gujarat (Rann of Kutch)
Excavator
JP Joshi
(1990)
Important point
– It was a large city spanned over 160 hectares. – It is one of the newest site to be excavated. – Important things excavated here includes 1. Extensive use of stone (instead of bricks). 2. 16 water reservoirs within the walls of city covering 36% of walled area. 3. Largest number of inscriptions have been found here.
6. Chanhudaro
Region
Near
Mohenjodaro in Sind (Pakistan)
River
Indus
Excavator
NG
Mazumdar (1931)
Important point
– It is a small settlement spread in just 7 hectares . – Important things excavated here includes 1. It was important craft centre devoted to bead-making, shell-cutting, metal-working, seal-making and weight-making. 2. It is the only Harappan site without fortifications.
7. Rakhigarhi
Region
Hissar district of Haryana (India)
River
Ghaggar
Important points
– It was large city spread over 350 hectares. – Important things excavated here includes 1. Fire altars like those found at Kalibangan. 2. Redware similar to Dancing Girl.
8. Banawali
Region
Hissar
district of Haryana (India)
River
Rangoi
Excavator
RS Bist
(1970s)
Important points
Important things excavated here includes 1. Barley of high quality. 2. Fire altars 3. Terracotta model of plough
9. Ropar
Region
Punjab
(India)
River
Sutlej
Excavator
YD
Sharma (1955)
Important points
– It was a small site. – Important things excavated here includes 1. Harappan seals 2. Cemetery where dead were buried. 3. Burial where man was buried with dog.
10 . Rangpur
Region
Near
Lothal in Gujarat
River
Madar
Excavator
MS Vatsa
(1931)
Important point
Rice
husk found here is important finding .
11. Surkotda
Region
Gujarat
Excavator
JP Joshi
Important point
Bones of
horse have been excavated from this site.
12. Suktagendor
Region
Baluchistan
(Pakistan) on Iran-Pakistan border
River
Dasht
Excavator
A Stein
Important point
– It is the western-most site of Harappan civilization . – Port town with trade links with Mesopotamia and Sumeria.
13. Shortughai
Region
North-East
Afghanistan
River
Oxus and
Kokcha
Important points
– It was small site (2 ha). – It was an isolated Harappan site . – Excavations include Pottery with Harappan Designs, Toy carts , Lapis Lazuli , Carnelian , shell bangles etc. – Ploughed field covered with flax in area unsuitable for farming ( dry farming practiced here) . – Small irrigation canals drawing water from Kokcha .
Reason for making an isolated site
1. Lapis Lazuli mines nearby 2. Second Possibility – Tin mines of Afghanistan 3. Third Possibility – role to play in Camel Trade
The decline of Harappan Civilization
It was a gradual decline
Roughly around 1900 BCE, there is a visible change in the
material record.
Population
seems to have either perished or moved away . Number of
settlements in Core Harappan areas decreased but number of
settlements in the outlying areas of Gujarat, East Punjab, Haryana and
upper Doab increased (explained by
the emigration of people from the core regions of Harappan Civilisation
to outlying areas) .
In few Harappan sites that
continued to be occupied after 1900 BCE, Material culture underwent a change – a far smaller, and that too more locally exploited raw materials was utilized .
There was disappearance of
weights, seals, special beads, writing, long-distance trade, and
craft specialisation .
Overall, artefacts and settlements indicate a rural way of life in what
are called “Late Harappan”
Mesopotamian
literature stops referring to Meluha by the end of 1900 BCE .
Many theories are given for the decline of Harappan Civilisation by various scholars
Reason 1: Aryan Invasion
Theory was
given by Ramaprasad Chanda in 1926 but elaborated by Mortimer Wheeler .
References to
various kinds of forts of Dasas
& Dasyus, attacks
on fortified cities & epithet
Puramdara(fort destroyer) given to Indra reflect
invasion of Aryans on Harappan cities .
Rig Veda
mentions a place
called Hariyupiya located on the bank of Ravi where Aryans fought a battle . Name
of the place sounds very similar to that of Harappa. Based on this,
Wheeler concluded that it was the Aryan invaders who destroyed the city.
Arguments against
this theory
Historians like George Dale
& BB Lal argue that Rig Veda is a religious text of
uncertain date & taking it as evidence on face value is not correct .
Harappans &
Aryans are unlikely to
have met each other. Harappan Civilisation declined around 1900 BCE whereas Aryans
arrived in India around 1500 BCE.
No evidences
of military assault have been found . Earlier Deadman
Lane Theory of John Marshall has been discarded . Deadman lane is a street in
Mohenjodaro where dead-bodies of 17 people were excavated. But later it
was found that they didn’t belong to same period. No bodies of warriors clad in armour and
surrounded by the weapons of war have been found. The citadel, the only
fortified part of the city, yielded no evidence of a final defence.
Reason 2 : Fall in Mesopotamian Trade
There was sudden end of long distance land and sea trade with Mesopotamia. Trade in luxurious items like lapis lazuli, beads etc. passed through Elam (located on eastern border of Mesopotamia) . In 2000 BC, Elam emerged as powerful state impacting Harappan exports to Mesopotamia and Mesopotamian Imports including tin to Harappa. Decline of trade led to decline of Harappan Civilisation as well.
Reason 3 : Raike’s Hypothesis – Floods
RL Raikes
was famous hydrologist .
He believes that the Harappan civilization declined because of catastrophic
flooding. But such flooding which could
drown buildings 30 feet was not result of normal flooding . Geomorphologically , the Indus area is a disturbed seismic zone. Earthquakes might have raised the level of the flood plains
of the lower Indus river along an axis roughly at right angles . This led to the ponding of the waters of
the river Indus.
Reason 4 : Shifting away of Indus
Indus was unstable river system which altered its
course many times .
River Indus shifted about 30 miles
away from Mohenjodaro. People deserted the area because
they were starved of water.
But this cannot explain the
decline of the Harappan civilization in totality. At best, it can explains
the desertion of Mohenjodaro.
Reason 5 : Drying up of Ghaggar
Ghaggar-Hakra area represented one of the core regions of Harappan civilization. Ghaggar was a mighty stream . Rivers Sutlej and Yamuna used to be the tributaries of this river. Because of some tectonic disturbances, the Sutlej stream was captured by the Indus river and the Yamuna shifted east to join the Ganges. This kind of change in the river regime, which left the Ghaggar waterless, would have catastrophic implication for the towns located in this area.
Reason 6 : Increased Aridity
This theory was given by DP
Aggarwal & Sood .
Basing their conclusions on
the studies conducted in the U.S.A., Australia and Rajasthan , they have
shown that there was an increase
in the arid conditions by the middle of the second millennium B.C. In
semi-arid regions like those of the Harappa, even a minor reduction in
moisture and water availability could spell disaster. It would
affect agricultural production which in turn would put the city economies under stress.
Reason 7 : Ecological Imbalance
“Harappans were over-exploiting their environment through over-cultivation,
over-grazing, and excessive cutting of trees for fuel and farming. This would have resulted
in decreasing soil fertility,
floods, and increasing soil salinity.”
Deforestation was carried out
on large scale for fuel to make bricks. Deforestation also reduced the
rainfall in the area.
To sustain the city
population, agriculture was to be done on large scale decreasing the soil
fertility . Exhaustion of the soil may have diminished cereal production and
starved the urban people.
Gradual
movement away to other areas was already happening so as to reduce the
pressure on the limited land. Harappan communities moved towards Gujarat
and eastern areas, away from the Indus.
Localisation Phase
Debate on Terminology : Late
Harappan vs Post Harappan
Those historians
who are in favour of decline
of Harappan Civilisation prefer to call it Post Harappan Civilisation .
Whereas those who argue for Transformation of Harappan Civilisation call it Late Harappan. Later Harappan terminology is preferred by
most historians now a days.
Scholars working on
the Indus civilization no longer look for the causes of its decline because of the fact that the scholars
who studied the Harappan civilization right upto the 1960s believed that
the collapse of the civilization was sudden. It was towards the end of the
1960s
that scholars like Malik and Possehl focused their attention on various aspects of
continuity of
Harappan tradition
Archaeologically
speaking some changes are observable-
Some of the
settlements were abandoned .
Tradition of
uniform writing, seals, weights and pottery was lost.
Objects
showing intensive interaction among the far flung settlements were lost.
In other words the activities
associated with city-centred economies were given up.
But there was
continuity as well.
Three prominent cultures which came after Mature Harappan Phase declined & Localisation Phase started were
Cemetery H
Jhukar/Late Kulli
Rangpur
1 . Cemetery H
Cemetery H is a
site in Harappa . Here, large Urn Burials dateable to Post Urban Culture were
found.
Dated from
1900-1300 BCE.
Cemetery H Culture
had Black
on Red pottery with similar shapes of pottery as that of Mature Harappan
Culture , although motifs on
pottery differed .
2. Late Kulli / Jhukar
Found in Southern
Sindh, Chanhu–Daro , Jhukar etc .
Some of typical Harappan elements like Stamp
Seals continued but it was made of Terracotta or Faience .
They were still staying in brick houses but they gave up the planned lay out.
3. Rangpur
Found in Gujarat . Main sites were Rangpur & Lothal & Prabhas Patan (Somnath) .
There were fewer number of sites and settlements were smaller.
They were using ‘Lustrous Redware’ characterised by bright & burnished slipped surface.
This marks the end of our article on ‘Harappan Civilisation’ .
This article deals with ‘Introduction to Drainage System ’ This is part of our series on ‘Geography’ which is important pillar of GS-1 syllabus . For more articles , you canclick here
Terminology
Channel
A defined zone
which has a certain depth in which there is continuous flow of water under
normal conditions.
Drainage
The flow of water
in well defined channel is known as Drainage .
Drainage System
The network of
channels which drains a region is known as Drainage System.
Drainage Basin
The drainage basin
is the area drained by the river and it’s tributaries.
Catchment / Catchment Area
The river drains
the water collected from a specific area. This area is known as the Catchment
Area or Catchment .
Water Divide / Watershed
Watershed divides
the one catchment area from other catchment area. It is also known as Water
divide.
River Regime
The seasonal flow of water
in a river is known as River regime. Hence, if the water availability is
uniform around the year, it is known as Uniform River Regime. Whereas rivers
where the water is seasonal, it is known as Non-uniform River Regime. Such
seasonal rivers are also known as Ephemeral rivers.
Inland Drainage
Rivers which don’t
reach the ocean . In desert or arid regions, such rivers lead to the
formation of Salt Lakes or Playa Lakes .
Types of drainage pattern
Geometric
system of streams in a region is determined by.
1. Slope
3. Hydraulic Variability.
2. Difference in rock resistance to erosion
4. Structural control of Landscape.
1 . Antecedent or Inconsequent
Antecedent drainage pattern is one in which a part of a river slope and the surrounding area gets uplifted but the river sticks to its original slope, cutting through the uplifted portion forming deep gorges
Eg : Those rivers which existed before upheaval of Himalayas like Indus, Satluj, Ganga, Brahmaputra, Arun, Tista etc. . These rivers originates in Tibet and cut across Himalayas forming deep gorges.
2. Consequent
Rivers which flow in direction of slope.
Most
peninsular rivers like Godavari, Krishna, Cauvery etc.
3. Superimposed /Superinduced
In this, drainage pattern exhibits discordance with underlying rock because
it originally developed on a cover of
rocks that has now disappeared .
The river has enough erosive
power that it can cut through any kind of bedrock, maintaining
its former drainage pattern.
Damodar,
Subarnarekha,Chambal, Banas etc.
4. Dendritic
Drainage in which
branches give appearance
of tree .
Dendritic pattern develops in
a terrain which has uniform lithology, and where faulting and jointing are
insignificant.
Most rivers
of Indo-Gangetic plain show Dendritic drainage pattern.
5. Trellis
Rectangular pattern where two sets of structural control occur at right angle.
Eg : Drainage pattern of Singhbhum(Chotanagpur).
6. Obsequent
In Obsequent
drainage pattern, tributaries intend to flow upstream instead of downstream.
Eg
: Arun river which is tributary of Kosi & Suru of Indus.
7. Rectangular
The main stream bends at right angles and the tributaries join at right angles creating rectangular patterns.
It differs from trellis as it is more irregular.
It is found in Vindhyan mountains.
8. Radial
Outflowing rivers , away from
central point.
Radial pattern tends to
develop on flanks of a dome or volcanic cone.
Subsequent stream flows curving prior to joining the consequent
stream.
It
is not very common . In India, it is found in Nilgiri hills of Tamil
Nadu & Kerala.
10 . Parallel
Rivers flow
parallel to each other. In this, rivers will not meet but keep on running
parallel.
Small rivers
originating in western ghats & discharging water in Arabian sea.
11. Deranged
Uncoordinated
pattern of drainage, characteristic of a region recently vacated by ice
sheet & has not adjusted
according to solid rocks underlying.
Eg : Drainage pattern found in
glaciated valleys of Karakoram.
Indian rivers
There are various ways to classify Indian Rivers.
1 . On basis of Discharge of Water
All Indian rivers discharge
water either in Arabian Sea or Bay of Bengal.
Nearly 77% of the
drainage area
consisting of the Ganga, the Brahmaputra, the Mahanadi, the Krishna, etc.
is oriented towards the Bay of Bengal while 23% comprising the Indus, the Narmada, the Tapi, the Mahi
and the Periyar systems discharge their waters in the Arabian Sea.
They are separated from each
other through the Delhi ridge, the Aravallis and the Sahyadri.
It should be
mentioned here that the over 90% of the water carried by the Indian rivers is
drained into the Bay of Bengal; the rest is drained into the Arabian Sea or forms
inland
drainage.
2. On Basis of Size of Watershed
Major
River Basins
Catchment
area of more than 20,000 sq.
km
14
Medium
River Basins
2,000
to 20,000 sq. km
44
Minor
River Basins
Less
than 2,000 sq. km
55
Ranking (catchment area)
Ganga
Mahanadi
Indus
Narmada
Godavari
Kaveri
Krishna
Tapi
Brahmaputra
Pennar
3. On Basis of Mode of Origin
Northern/Himalayan
Rivers
Peninsular Rivers.
Although it has the problem
of including Chambal, Betwa, Son, etc. which are much older
in age and origin. than other rivers that have their origin in the
Himalayas, it is the most accepted basis of classification.
This marks the end of our article on Introduction to Drainage System. For other articles on geography, CLICK HERE.
This article deals with ‘Non Performing Assets.’ This is part of our series on ‘Economics’ which is an important pillar of the GS-3 syllabus. For more articles, you can click here.
Scale of Problem
Till recently, India was facing a severe NPA problem.
Indian Commercial Banks’ NPA peaked at ₹12 lakh crores in 2018, comprising 11.2% of total lending.
NPAs are declining after achieving a peak in 2018 due to various steps taken by the stakeholders.
Most of these NPAs are in Public Sector Banks (Rs 10 lakh crore in 2018) and are in the name of Big Business Houses, leading to the Twin Balance Sheet Problem.
What is NPA?
Generally speaking, Non Performing Asset or NPA is any asset of a bank that is not producing any income.
On a bank’s balance sheet, loans made to customers are listed as assets. The biggest risk to a bank is when customers who take out loans stop making their payments, causing the value of the loan assets to decline.
Criteria of deciding NPA
Loans don’t go bad straightaway. Customers are allowed a certain grace period.
Commercial Loans: More than 90 days overdue.
Agriculture Loans: More than 2 harvest seasons or 2 years, whichever is lesser.
Categories
Net NPA
Above is Gross NPA. Net NPA is obtained by taking Provisioning into account.
Provisioning means banks are required to set aside some funds to cover the losses done by NPAs.
Stressed Assets
Stressed Assets = NPA + Loans Written Off
Banks generally write-off loans to reduce their taxable income & corporate tax & also to clean up their balance sheet. But Write-off doesn’t mean Loan Waiver. Banks still have the right to recover their loans.
Causes of huge NPA
NPAs had reached the level of ₹12 lakh crore in 2018. The main reasons for the situation reaching such a level are
Over-optimism of the Banking Sector: Many NPAs can be traced back to 2006-2008 when banks didn’t pay due diligence while giving loans to power and infrastructure projects, anticipating high economic growth.
Global and Domestic Macro-economic instabilities in the recent decade: Due to this, a slowdown was seen in the economy diluting the capability of the borrowers to service the loans.
Cost Overruns: Projects suffered from delays due to Policy Paralysis, Judicial Activism and Environmental Activism, thus impacting the loan servicing capability of the borrowers.
Projects were not able to recover their costs due to the Global Financial Crisis of 2008.
Poor Credit Appraisal System: The banks have not developed sufficient capacity to undertake credit appraisal before giving loans.
Wait & Watch Approach of Banks: Evergreening of loans (i.e. zombie lending or giving the loan to pay back the old loan) by banks before forming Bankruptcy code.
Regulatory and Policy Risks: The past few years in India saw a volatile regulatory framework that built stress in certain industries. Some examples include
Mining ban in certain southern Indian states
The decision to cancel and re-auction the telecom airwaves
Industry-Specific Risks: Industry-specific reasons caused a rise in NPA levels in India. Sectors that are seeing advanced stress are aviation, textile, and telecom. The higher NPAs in the aviation sector can be attributed to the high cost of aviation turbine fuel, which accounts for 45% of total operating costs.
Wilful Defaulters: There has been an increase in the number of wilful defaulters who have failed to repay their loans in spite of having the capability to do so.
Priority Sector Lending loans turned NPA because they cater to economically vulnerable sections.
Credit Culture: The announcement of farm loan waivers by the Central Government and various state governments has affected the credit culture in India.
Lack of Policy Foresight: Delay in the formulation of Insolvency and Bankruptcy Code for faster resolution of NPAs.
Lack of Integrated Database on Credit Information: Presently, multiple agencies capture credit-related information without proper coordination. Further, the RBI’s proposal to create Public Credit Registry faces legal challenges.
Impact of Higher NPAs
Reduced Profitability of Banks: Due to the provisioning, banks are forced to keep 25 to 30% of NPAs in provisioning, impacting banks’ profitability.
Capital Adequacy: With the increase in the NPAs, the banks’ capital requirements become higher, thus putting additional pressure on the government to recapitalize the banks.
Lower Confidence of the Shareholders: The increase in the levels of NPAs decreases shareholders’ confidence, making it difficult for the banks to raise capital from the market.
Public Confidence: It lowers the confidence of the common public in weak banks, making it difficult for such banks to gather cash for their operations.
It has led to the scarcity of funds in the Indian market. Consequently, businesses can’t get loans to expand their businesses.
Fall in the Value of shares of Banks: Return on Assets (ROA) of Indian banks has become lower than international norm of 1.5% . Hence, Investors are not willing to invest in shares of Banks .
Total NPAs have touched figures close to the size of the UP budget. Imagine if all the NPA was recovered and how well it can augur for the Indian economy.
In a nutshell, the high incidence of NPA has a cascading impact on all important financial ratios of the banks viz., Net Interest Margin, Return on Assets, Profitability, Dividend Payout, Provision Coverage Ratio, Credit Contraction etc., which may likely erode the value of all stakeholders including shareholders, depositors, borrowers, employees and public at large.
But Indian Case is unique in some sense
When Japan (1990s), East Asia (1998), and the US & UK (2008) faced such an NPA crisis, their economies collapsed. But it didn’t happen in India because the Indian NPA crisis is unique.
Reasons for this are
NPAs are concentrated in Public Sector Banks which enjoy Sovereign Backing. No bank run has happened due to this.
The majority of NPA is in infrastructure loans like Power Plants, Ports etc. Once the world economy starts to boom, these projects will begin to generate income (in contrast to US Subprime Crisis, where NPAs were concentrated in Housing loans).
Most NPAs are concentrated in a few big corporate houses. Hence, banks have to deal with a few cases.
What RBI has done to tackle this menace?
1. Special Mention Account (SMA)
Loans become NPA after 90 days. If we can classify assets that are approaching to become an NPA but haven’t yet become NPA, we can tackle them.
Hence, RBI came up with a new category known as Special Mention Accounts (SMA) between Standard Asset and NPA.
SMA 0
If loan principal / interest unpaid for 1-30 days from its due date
SMA 1
31-60 days
SMA 2
61-90 days
2. Asset Quality Review (AQR)
In 2015, RBI ordered the Banks to conduct Asset Quality Review (AQR) and start rectifying bad loans, i.e. Bank doesn’t change loan’s interest, tenure or terms but asks the client to rectify his irregularity in loan repayment.
3. Strategic Debt Restructuring
Under Strategic Debt Restructuring, Bank converts its debt to equity (shares with voting rights). Later, the bank sells this equity to the highest bidder.
But scheme remained unsuccessful as floating shares with voting rights require the approval of existing shareholders.
4. 5/25 for Infra Loans
RBI allowed banks to extend the tenure of infrastructure loans to 25 years and even reduce loan interest rate for the client, so that tenure of the loans matches the long gestation period in the sectors. But, such an interest rate was to be reviewed every 5 years.
5. Scheme for Sustainable Structuring of Stressed Assets (S4A)
Under S4A , the unsustainable portion of the debt is converted to equity (Preferential Shares without voting rights).
This scheme was more successful than the Strategic Debt Restructuring as no permission is required for floating such shares as it doesn’t affect the voting powers of existing shareholders.
6. SARFAESI
Earlier, banks couldn’t recover their loans because clients used to obtain stay orders from ordinary courts. Hence, Narsimham Committee recommended the formation of the Debt Recovery Tribunal (DRT). DRT was formed in 1993 so that ordinary courts couldn’t interfere in loan recovery cases.
To further empower Banks, the Securitization and Reconstruction of Financial Assets and Enforcement of Security Interest (SARFAESI) Act was enacted in 2002, under which
Banks and Housing Finance Companies (NBFCs) can attach the mortgaged assets when the loan is not repaid. They can also change the board of directors, auction such assets, and sell them to Asset Reconstruction Companies (ARC).
SARFAESI is not applicable on farm loans.
If the loan-defaulter wants to obtain a stay order against the decision of the Bank, he can’t go to ordinary courts. He will have to approach DRT. The decision of DRT can be challenged in the Debt Recovery Appellate Tribunal (DRAT) after depositing a minimum 50% of the loan dues.
The Loan Defaulter also enjoys some legal rights under SARFAESI Act. These include
Right to be Heard (i.e. make representation to the Lender)
Right to Ample Notice (at least 60 days notice must be served before starting auction)
Now, just the Insolvency and Bankruptcy Code will be used to settle all the cases involving NPAs. All other schemes have been scrapped.
8. Haircut / One Time Settlement (OTS) Scheme for Agriculture Loans
Agricultural
Loans don’t come under SARFAESI Act. The
Haircut / One Time Settlement (OTS) Scheme is used to settle such cases.
Under the scheme, some part of the loan is waived, and the rest is recovered from the farmer.
E.g., For Tractor Loans given before September 2011, there was a total of 6,000 crores worth of doubtful/loss cases. One Time Settlement with a Haircut of 40% (i.e. have to pay 60%) was announced in 2017.
9. Amendment to Banking Regulation Act
Earlier, Officers of the Banks were not able to take decisions to resolve NPAs in fear of persecution by CVC, CBI, CAG etc., as resolving such cases requires giving haircuts and restructuring loans.
To solve this problem, the government amended Banking Regulation Act. The amendment has the following provisions
Government can order RBI to initiate Insolvency & Bankruptcy proceedings against defaulters.
It empowers Central Bank to identify specific stressed assets and initiate Insolvency and Bankruptcy proceedings against them.
The decisions of bank officials will be ratified by Oversight Committees appointed by the RBI, which will ensure that due process was followed to reach a particular decision.
10. Prompt Corrective Action
Under Prompt Corrective Action (PCA), Banks are categorized in Category 1, 2 or 3 based on levels of NPA in that bank.
Then, accordingly, RBI will take corrective actions against weaker banks with high NPA like :
Restricting raise in salaries of bank directors.
Stopping banks to give a dividend to their investors.
Restricting branch expansion.
Restricting lending operations of weak banks.
Forcing merger and shutdown of the weak bank.
If a bank wants to come out of restrictions, it will have to reduce its NPA.
11. Wilful Defaulters
A Wilful Defaulter is one who
is financially capable of repaying and yet does not do so OR
diverts the funds for purposes other than what the fund was availed for OR
has sold or disposed of the property used as a security to obtain the loan OR
Siphoned off the funds from one company to another OR
Misrepresented the records OR
Made Fraudulent transactions
If an entity’s or individual’s name is figured in the list of Wilful Defaulters, it is barred from availing of any banking facility and accessing financial institutions for five years. The lenders can initiate the recovery process and can even initiate criminal proceedings if required.
12. Fugitive Economic Offenders Act, 2018
This act targets economic offenders accused of cheque dishonour, loan and investment scam, money laundering etc., worth ₹ 100crores or more & left India to avoid prosecution.
Special courts under the PMLA (Prevention of Money-Laundering Act, 2002) have the power to order a fugitive to appear within 6 weeks. If the person doesn’t comply, he is declared a “Fugitive Economic Offender”. Subsequently, Indian & Overseas & Benami properties of such fugitives can be attached.
No ordinary Civil Court or Tribunal can issue a stay order. The person can appeal only in High Court and Supreme Court.
13. Unified Lender Interface
ULI is proposed by the RBI Governor to revolutionize the lending ecosystem in India (similar to UPI for payments)
The
simplest approach to cut down NPA is to recover the debt by
Making Bad Bank/ PARA (explained below).
Amending Bankruptcy Act to make it friendly for creditors to recover their money.
2. Using tools of Information Technology
Economic Survey (2020) has suggested to
used AI and ML to fight the menace of NPAs. It can be used in the following
ways
Using Artificial Intelligence (AI) and Machine Learning (ML): AI can be used to monitor transactions of Wilful defaulters so that they can be stopped from transferring assets of the company to other accounts before applying for insolvency.
Geo-tagging the assets of the company (using GPS technology) so that defaulters can’t pledge the same assets to take different loans and move assets from the property before undergoing bankruptcy.
Using Blockchain Technology to check the authenticity of data provided by the creditors.
Tracking Social Media accounts and travel history of the defaulters using AI and ML to know about the actual financial position of the defaulter.
3. Using PSBN
Economic Survey (2020) has recommended creating Public Sector Bank Network (PSBN).
PSBN will act as a Financial Technology Hub that will connect all the banks to a single server containing data from the past 50 years, Financial data from the Corporate Affairs Ministry, SEBI, Income Tax Department etc.
4. Employee Stock Option Plans (ESOPs)
ESOP is a type of benefit plan wherein employees are given some company shares apart from regular salary (companies like Facebook, Google and many other StartUps already use ESOPs).
The existing salary-based compensation mechanism encourages employees to prefer safety and conservatism over risk-taking and innovation. But giving them some shares via ESOP may encourage risk-taking and a possible change of mindset from that of an employee to that of an owner.
5. Conservatism
Banks need to be more conservative in granting loans to sectors that have traditionally been contributors to NPAs. The infrastructure sector is one such example.
6. Deregulate Economy
Government should promote the Corporate Bond market so that Corporate houses and entrepreneurs can directly raise debt from the market instead of approaching the banks.
7. Merger and Privatization
Government should recapitalize only profit-making banks, while loss-making PSBs with high levels of NPAs should either be merged with some anchor bank or privatized.
Bad Bank / PARA
To solve the NPA problem, PARA/ Bad Bank buys bad loans from PSBs and tries to salvage the loan’s maximum value by either restructuring loan or liquidation, auctioning or changing ownership of the company and absorbing the losses.
July 2021: The government of India set up National Asset Reconstruction Company Ltd (NARCL) and Indian Debt Resolution Company Ltd. (IDRCL) (together NARCL and IDRCL will act as the Bad Bank) to clean up the NPAs.
Process
NARCL will acquire the NPAs up to the worth of Rs 2 lakh crore from commercial banks by paying 15% of the agreed price as upfront money and the rest of 85% in the Security Receipts. NARCL will be capitalised through equity and debt from various banks and has a limited life of 5 years.
These NPAs will then be transferred to Indian Debt Resolution Company Ltd. (IDRCL), which will sell the stressed assets to recover the money.
Why Bad Bank can be a good idea?
East Asian Economies have successfully used this approach to solve the mess created during the South Asian Currency Crisis of the mid-1990s. Similarly, other countries such as Malaysia, Finland, Belgium, Indonesia etc., have also set up Bad Banks to deal with NPAs.
Decentralised Decision making isn’t working because there are coordination problems since large debtors have many creditors. Bad Bank can solve this issue.
Stressed debt in India is heavily concentrated in large companies. Such big debts can be solved by a professional organisation like PARA or Bad Bank.
Before this arrangement was put in place, India has 28 ARCs (Asset Reconstruction Companies). But they haven’t proved any more successful than banks in resolving bigger NPAs due to limited capitalisation. But international experience shows that a professionally run central agency with government backing can provide the solution in this regard.
It will lead to the unlocking of capital locked up as provisioning requirements, thus increasing the credit creation.
Enable the bank to focus on its core areas of accepting deposits and lending loans when the recovery of bad loans gets transferred to the specialist Bad Bank.
Aggregating debt: Set up of NARCL will help address the problem of contradictory views (lack of consensus) among different lenders, allowing debt recasts.
Arguments against
Moral Hazard: Shifting of NPAs without accountability risks the moral hazard of reckless lending, further amplifying the problem.
It will not have a long term impact because it doesn’t solve the underlying problem of NPAs in the country and only leads to the transfer of NPAs.
Financing a Bad Bank in India is also very difficult.
Qualified Professionals: India lacks adequately trained manpower.
Mere shift of bad loans: According to ex-RBI Governor Raghuram Raman, the setting up of a Bad bank will merely transfer Assets from one entity to another.
RBI has raised issues over the structure of this mechanism. According to the SARFAESI Act, which deals with the ARCs, there needs to be one entity that deals with both the purchase of the bad loans and the resolution of those loans.
Side Topic: Deposit Insurance & Credit Guarantee Corporation of India (DICGCI)
It is a 100% RBI owned company.
It provides insurance cover to Commercial banks, Regional Rural Banks, Local Area Banks, Payment Banks, Small Finance Banks and Cooperative Banks. (BP Kanungo Committee (2022) has recommended that DICGC should insure deposits in Mobile Wallets.)
All Banks have to buy insurance from DICGCI on their deposit. A maximum of 5 lakh (changed in Budget 2021 – earlier it was Rs 1 lakh) of each depositor is insured in the case of a Bank shut down or if the bank is placed under moratorium.
Problem
If a customer had deposited more than ₹5 lakh in a single commercial bank, then he gets only ₹5 lakh from DICGCI. For the remaining amount, he must wait till RBI liquidates the bank.
DICGCI doesn’t cover NBFCs. E.g., UTI Mutual Fund Case of 2002.